LinkedIn Best Practices for Company Pages: What Actually Works in 2026
LinkedIn best practices for 2026: content formats, posting frequency benchmarks, and strategies that move the needle for company pages.

Forget the generic checklists.
Most lists of LinkedIn best practices read the same: post consistently, be authentic, engage with your audience. None of that tells you which format to prioritize this week or how often to post it.
That's why I've pulled together what the data actually says about posting frequency, content formats, engagement, and measurement, so you can make those calls with numbers behind them instead of a gut feeling. Let's dive in!
Key takeaways
- Native documents, multi-image posts and videos are the top most engaging content formats on LinkedIn.
- Employee-generated content outperforms branded LinkedIn company page posts on engagement because it reads as less promotional, making employee advocacy and active comment engagement two of the highest-leverage tactics for company pages.
- LinkedIn performance should be measured against benchmarks matched to page size and content format, since a single platform-wide average can make a well-performing page look weak or a struggling one look fine.
LinkedIn posting strategies best practices
One of the most common questions about LinkedIn posting best practices for companies isn't "how often should we post," it's "how often should we post of what."
According to Socialinsider's 2026 LinkedIn benchmarks study, brands didn't just post more over the past year. They specifically shifted their content calendar toward visual-first formats.
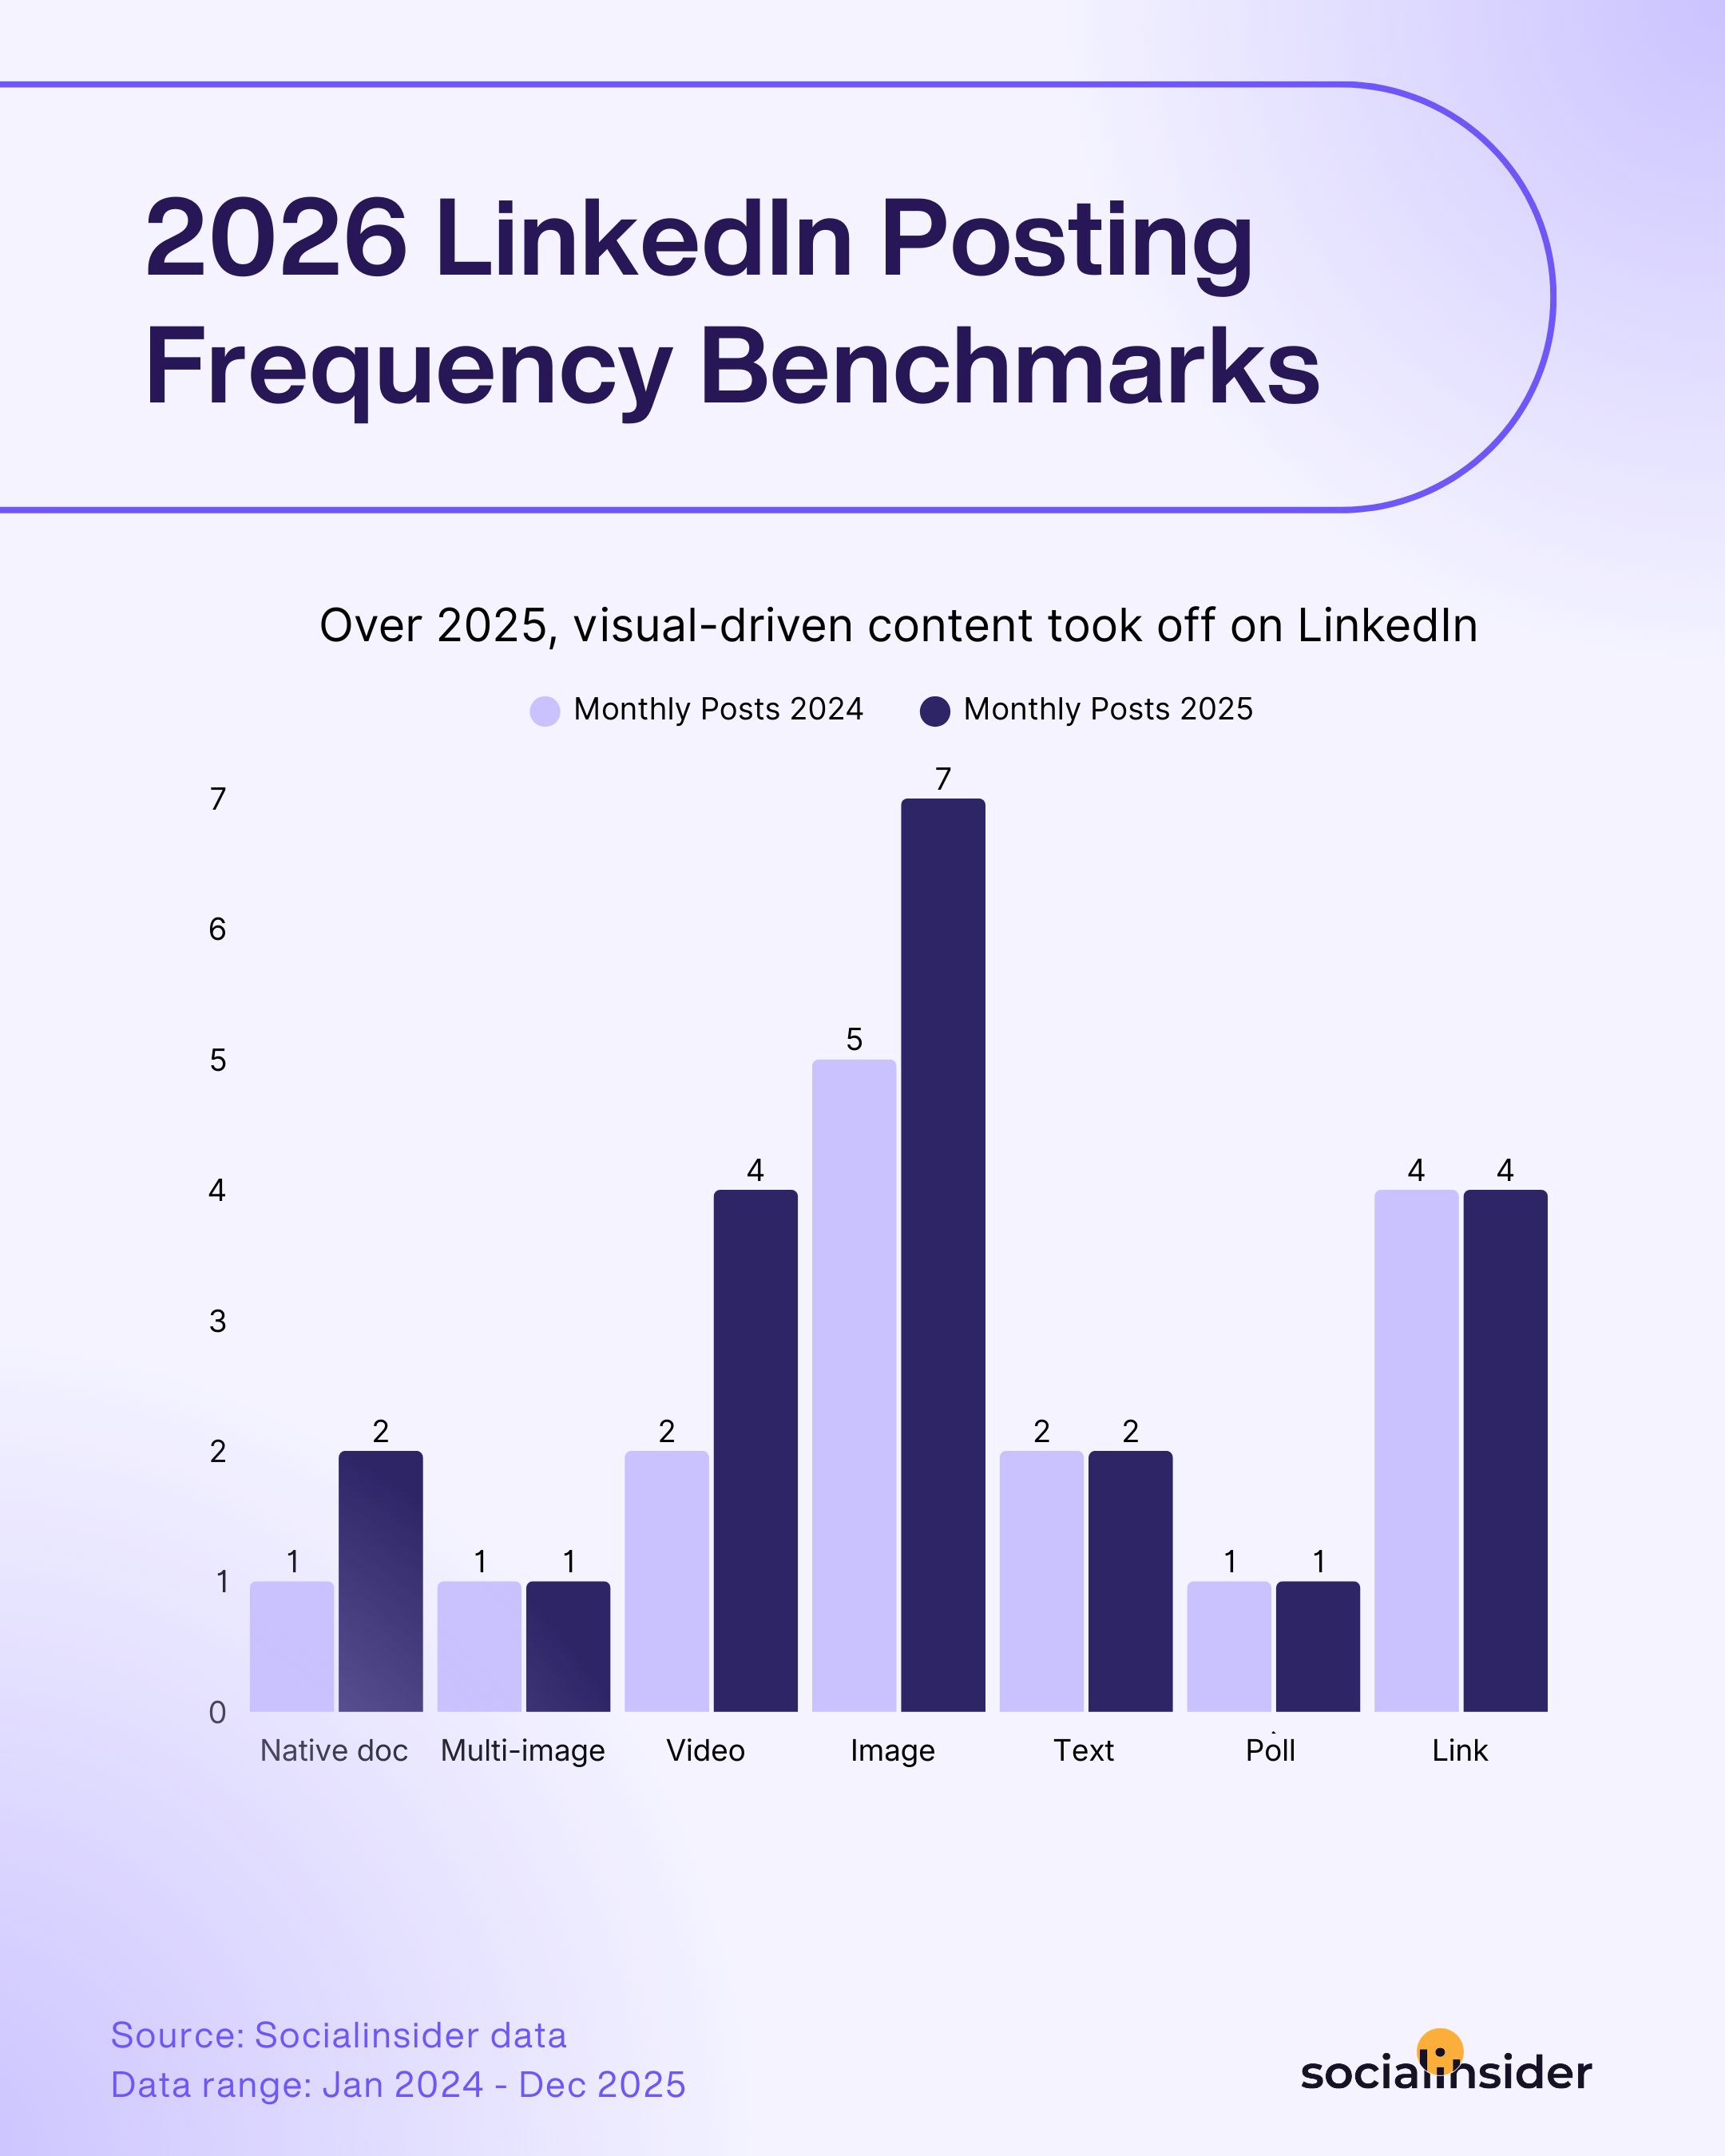
A few notable takeaways from the study:
- Video and native document frequency doubled.
- Image posting climbed from 5 to 7 posts a month.
- Meanwhile, text, poll, and link posting held flat.
That's the real lesson behind LinkedIn posting frequency best practices this year: brands aren't posting more across the board, they're reallocating their frequency toward the formats already proven to perform, and holding steady everywhere else.
For your own social media posting frequency, this is a useful benchmark to build a content calendar against; not a quota to hit, but a ratio to aim for. If your calendar is still weighted toward text and link posts, that's the first thing to rebalance.
A sustainable LinkedIn content calendar comes down to three things:
- Batch production. Set aside dedicated days each month to create and schedule content, so your team isn't scrambling for a post the morning it's due.
- Templates for repeat formats. Document your process for each content type (announcements, tips, client stories) so anyone on the team can produce them without reinventing the format each time.
- A shared ideas bank. Keep a running list of post ideas your team can draw from, so brainstorming isn't a bottleneck.
Posting too little and you disappear from the feed. Posting too much without a plan burns out whoever's producing the content. The formats table above is your guide for where the extra effort should actually go.
LinkedIn content formats best practices
Posting consistently only gets you so far if you're posting the wrong things consistently. Here's what the data shows about which formats to prioritize, and how to execute each one well.
Native documents
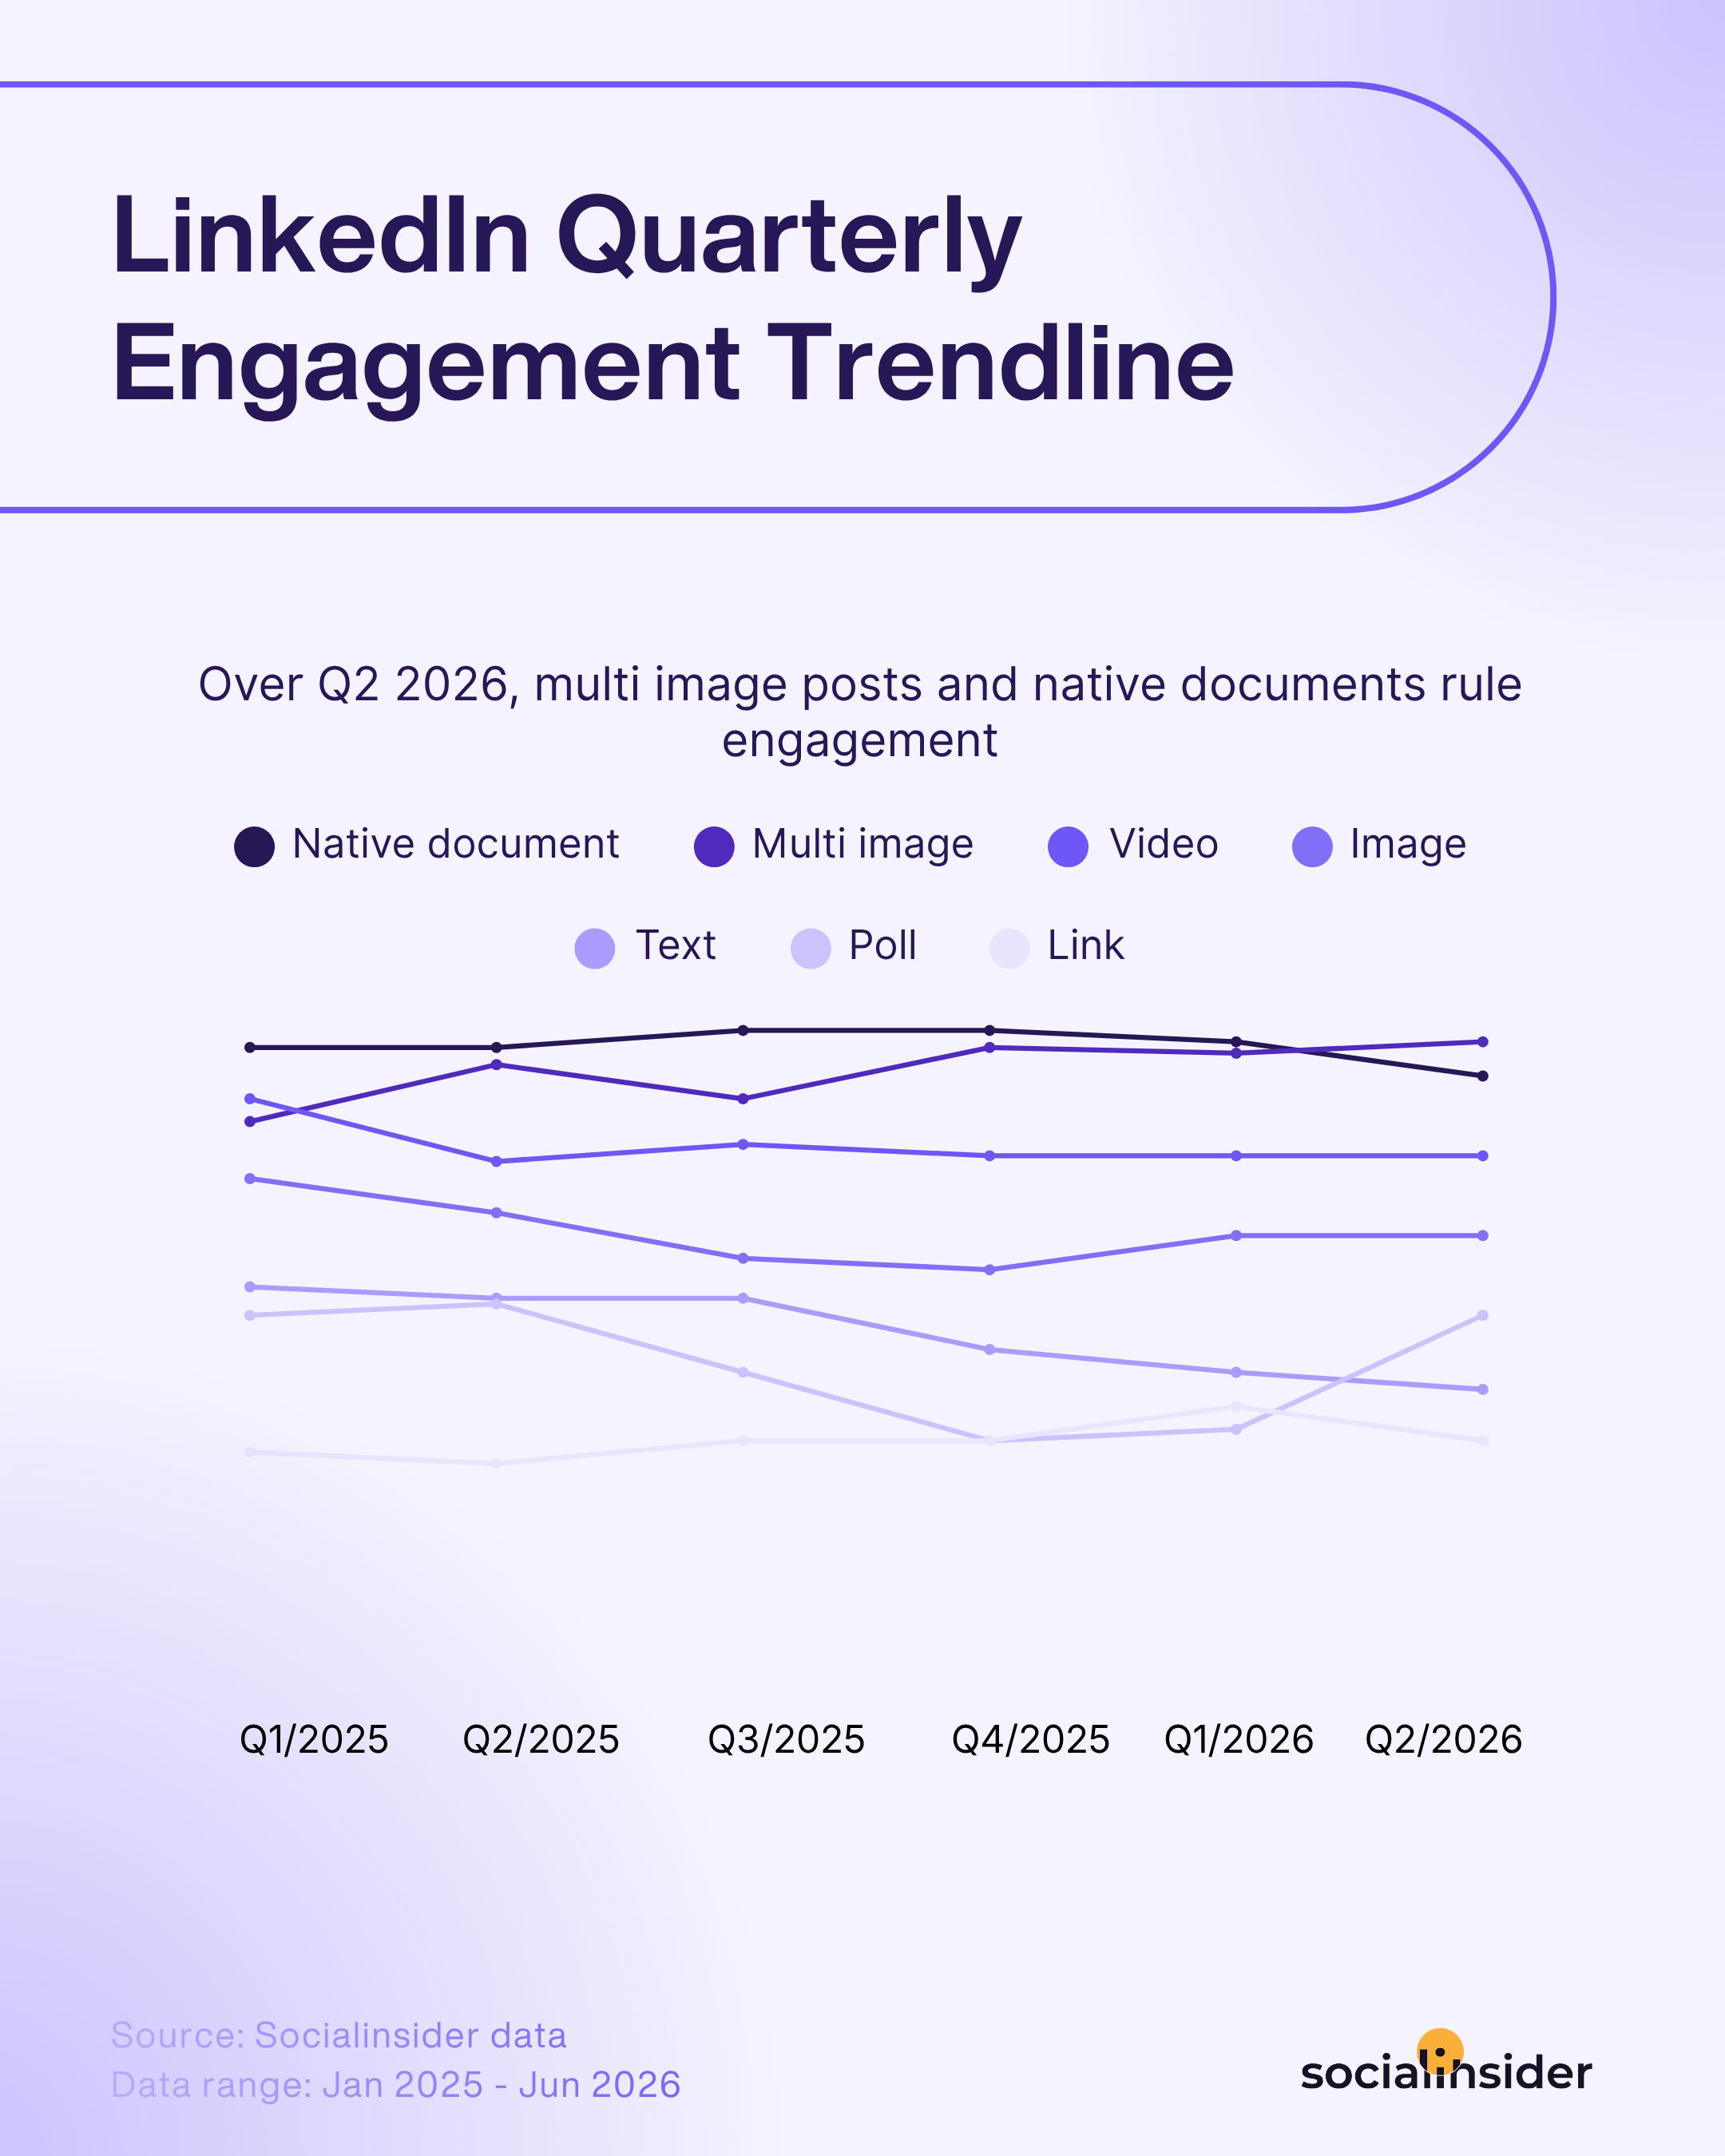
Native documents (PDFs uploaded directly to LinkedIn, formatted like a carousel) are the single best-performing format on the platform right now, averaging a 7.00% engagement rate, up 14% year over year.
As Julia Holmqvist, Social Media Manager at Semrush, put it when explaining the format's rise:
Document posts perform well because they behave like 'free value' on a platform where people actively want to learn. Documents work great because they're downloadable. People can save them and actually use them later, and they're very UX-friendly. The carousel format makes it easy to scan.
If you're building out LinkedIn carousel best practices for your team, the format rewards content people can actually use: frameworks, checklists, step-by-step breakdowns, or condensed research findings. Keep each slide focused on one idea, and design for skimming, since most people are swiping through quickly rather than reading closely.
Multi-image posts
Multi-image posts (an album-style upload of several photos) consistently rank second for engagement, and they're the strongest format for driving likes as a page grows. The format works because it rewards a bit of patience: each slide invites the viewer to keep swiping rather than scroll past after a single glance.
A few things worth building into your LinkedIn content creation best practices for this format:
- Design for the thumbnail. The first image has to earn the swipe on its own, since it's competing with everything else in the feed before someone even sees slide two.
- Repurpose what already works. A blog post, a webinar recap, or a set of survey findings can all become a multi-image sequence with minimal extra production, and it's one of the more efficient content repurposing plays on the platform.
Video
Video engagement is up 7% year over year, but the bigger story in this year's data is a 36% decline in average video views across every page size. That's not a reason to drop video from your content mix, but it does change how you should approach it.
A few LinkedIn video best practices worth building into your process:
- Lead with a summary, not a teaser. A descriptive, actionable caption above the video increases the odds someone stops to watch, since LinkedIn doesn't reward mystery the way other platforms do.
- Caption everything. Most people watch on mute. Captions and on-screen text protect your completion rate.
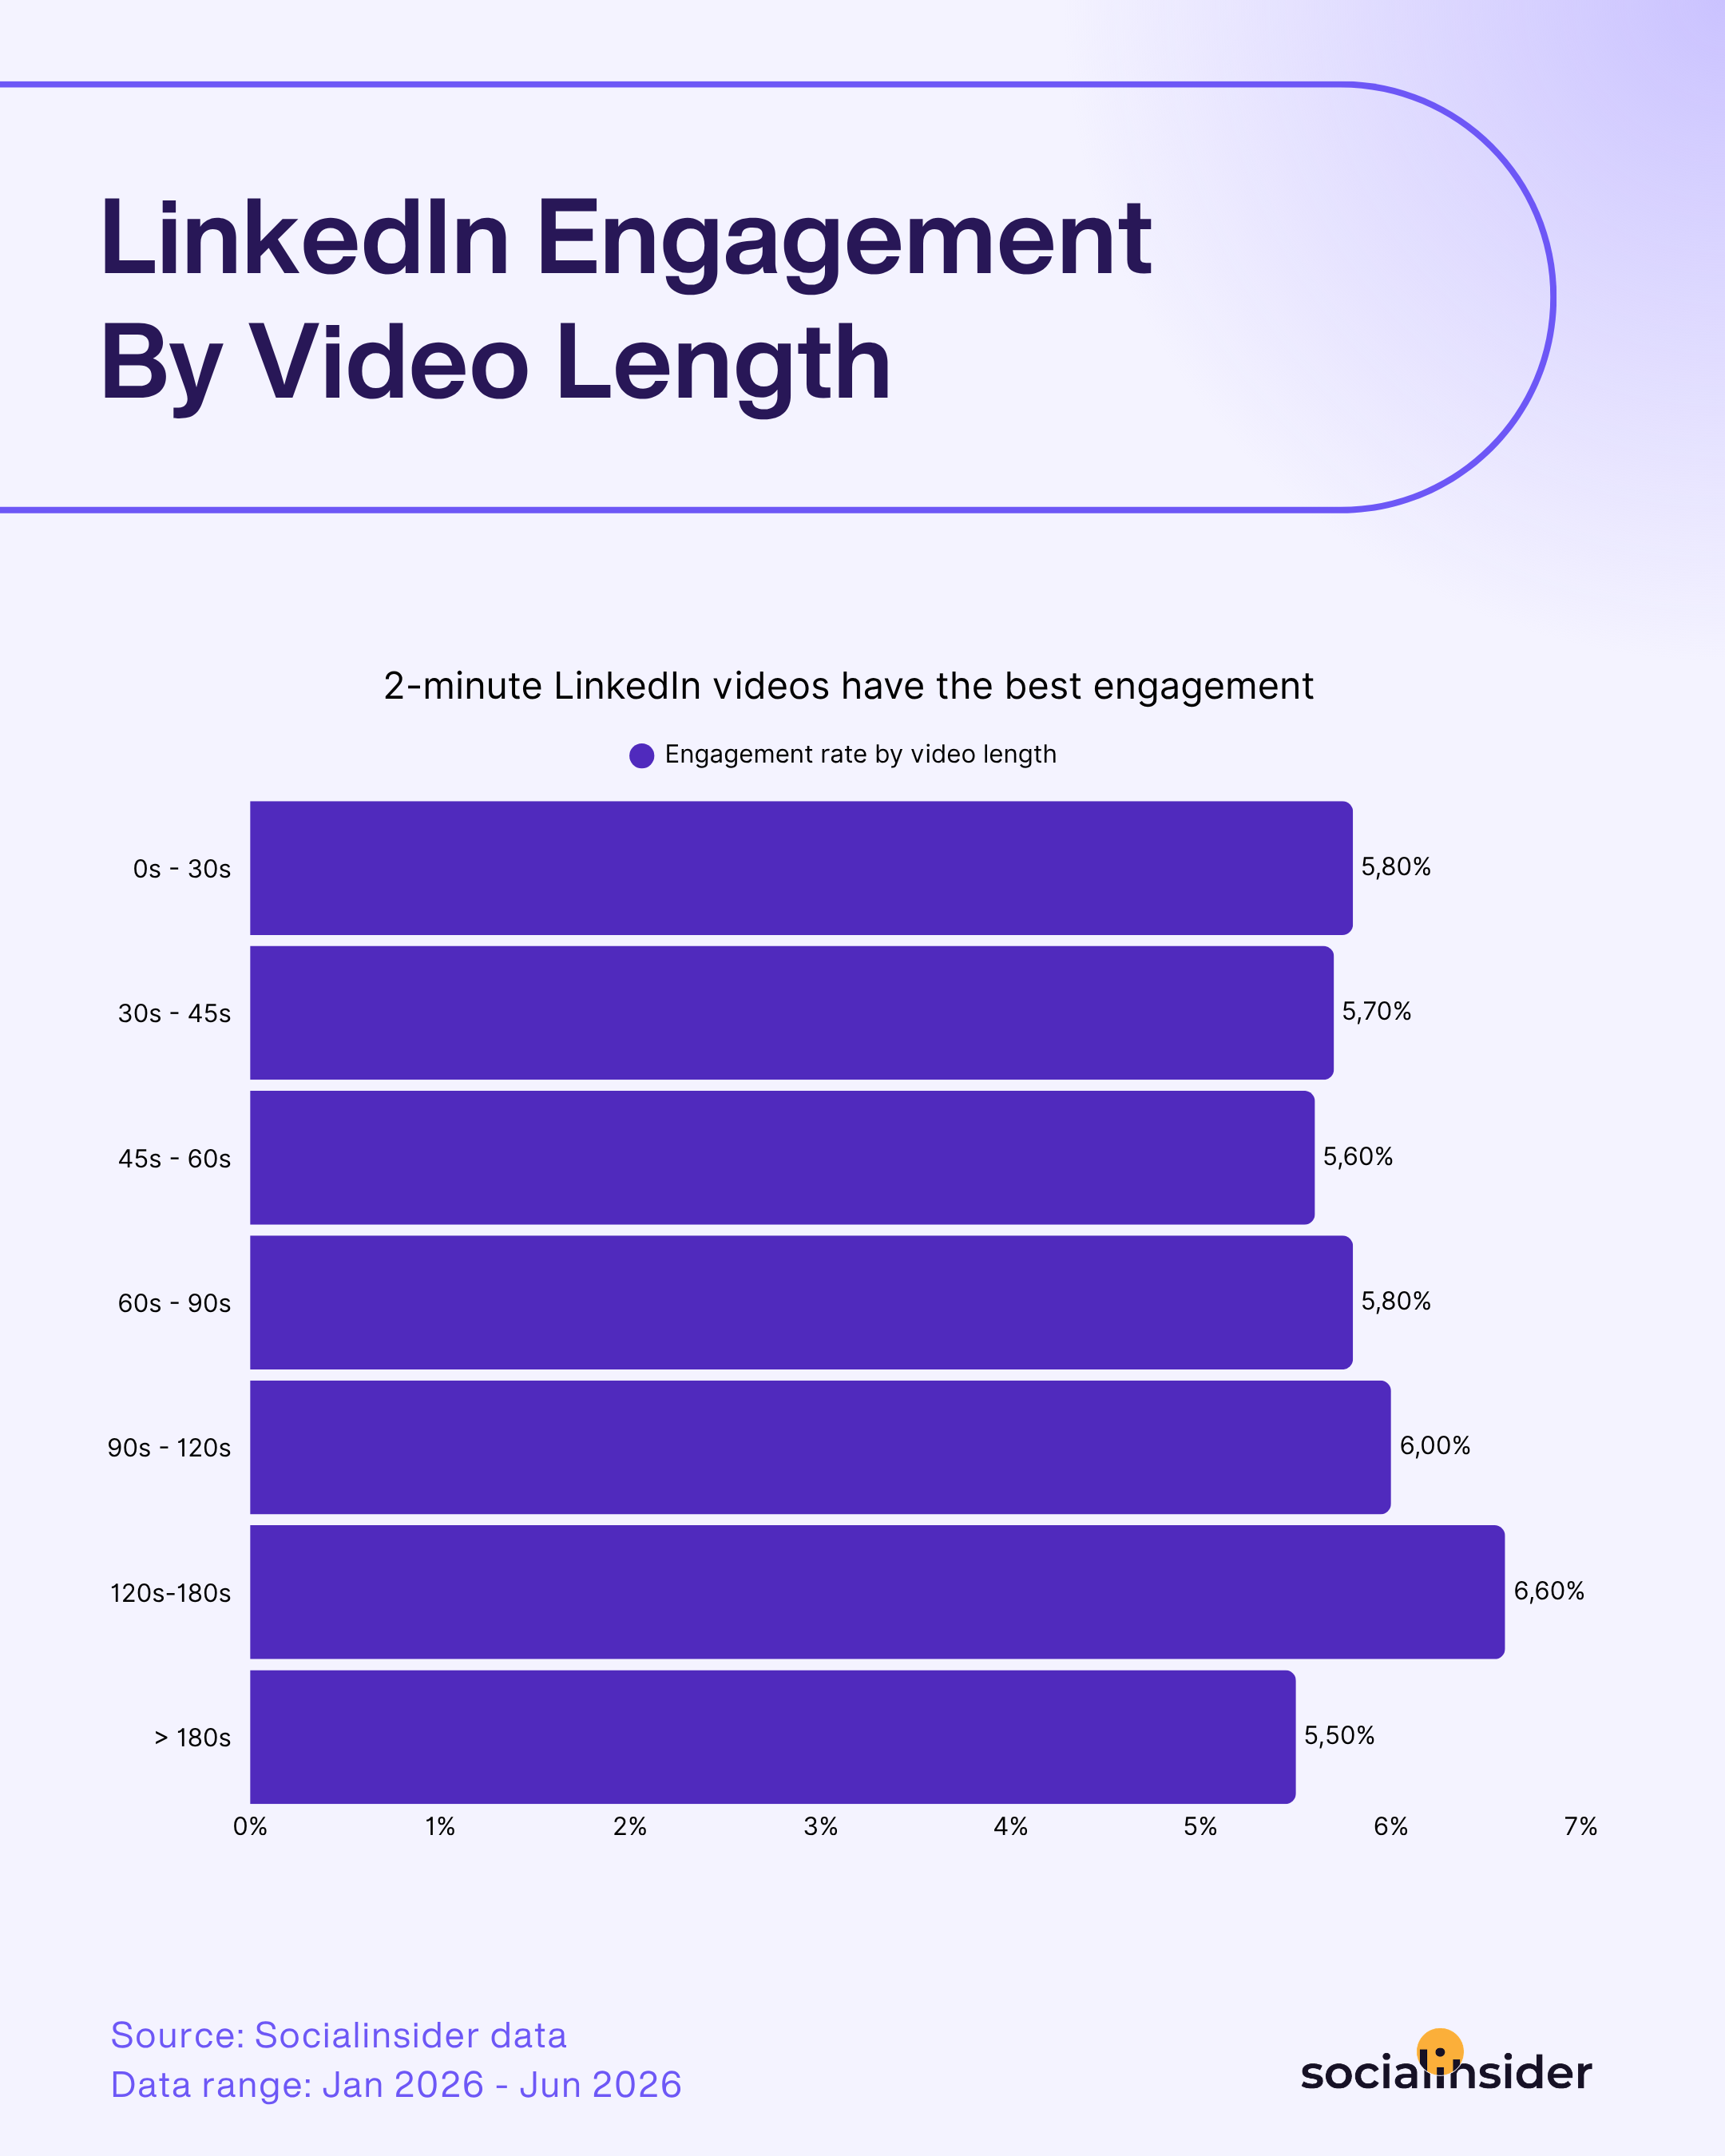
- Aim for the 2 to 3 minute window. On LinkedIn video length best practices specifically, Socialinsider's video benchmarks study shows both engagement and views peaking in the 120-180 second range, with both metrics dropping back down once a video crosses the three-minute mark.
LinkedIn engagement best practices
Engagement on LinkedIn isn't just about what you post, it's about who's posting it and what happens after. Here's where to focus both.
Thought leadership and employee advocacy
Two formats worth building into your calendar even though they're not "formats" in the technical sense:
Thought leadership content, delivered through any of the formats above, builds credibility over time by educating or challenging your audience rather than selling to them.
Employee-generated content tends to outperform branded posts because it reads as less promotional. A designer sharing early product sketches, or a customer success lead spotlighting a win, reinforces your positioning more effectively than a company page post making the same point.
Give your team the tools and autonomy to post in their own voice rather than scripted corporate language, and reshare the strongest examples to build momentum.

Continous engagement
Publishing content is half the job. The other half happens in the comments, and it's the half most company pages skip.
If your team is only pushing out posts without engaging in the conversation around them, LinkedIn becomes a bulletin board instead of the platform it actually is. That means replying to comments, asking follow-up questions, and showing up in the comments on other people's posts too, not just your own.
For a team managing this at scale, that's a workflow question as much as a tone question: who owns comment response, what's the turnaround expectation, and how do you make sure the brand voice stays consistent across whoever's responding that week.
LinkedIn Groups are also worth a second look. They're easy to overlook, but they offer direct access to niche, high-intent communities, and a place where showing up as a contributor rather than a promoter builds credibility that's hard to earn elsewhere.
LinkedIn performance measurement best practices
Posting consistently and engaging well are only useful if you can show they're working. This is where most LinkedIn marketing best practices content stops short, treating measurement as an afterthought instead of the thing that justifies your entire strategy.
Start by matching your metrics to your actual goal, since the same number can mean very different things depending on what you're trying to achieve:
- Brand awareness → reach, impressions, video views

- Engagement → comments, shares, reactions, engagement rate
- Lead generation → clicks, conversions, follower quality over follower count
An important note I have is that context matters more than the raw number.
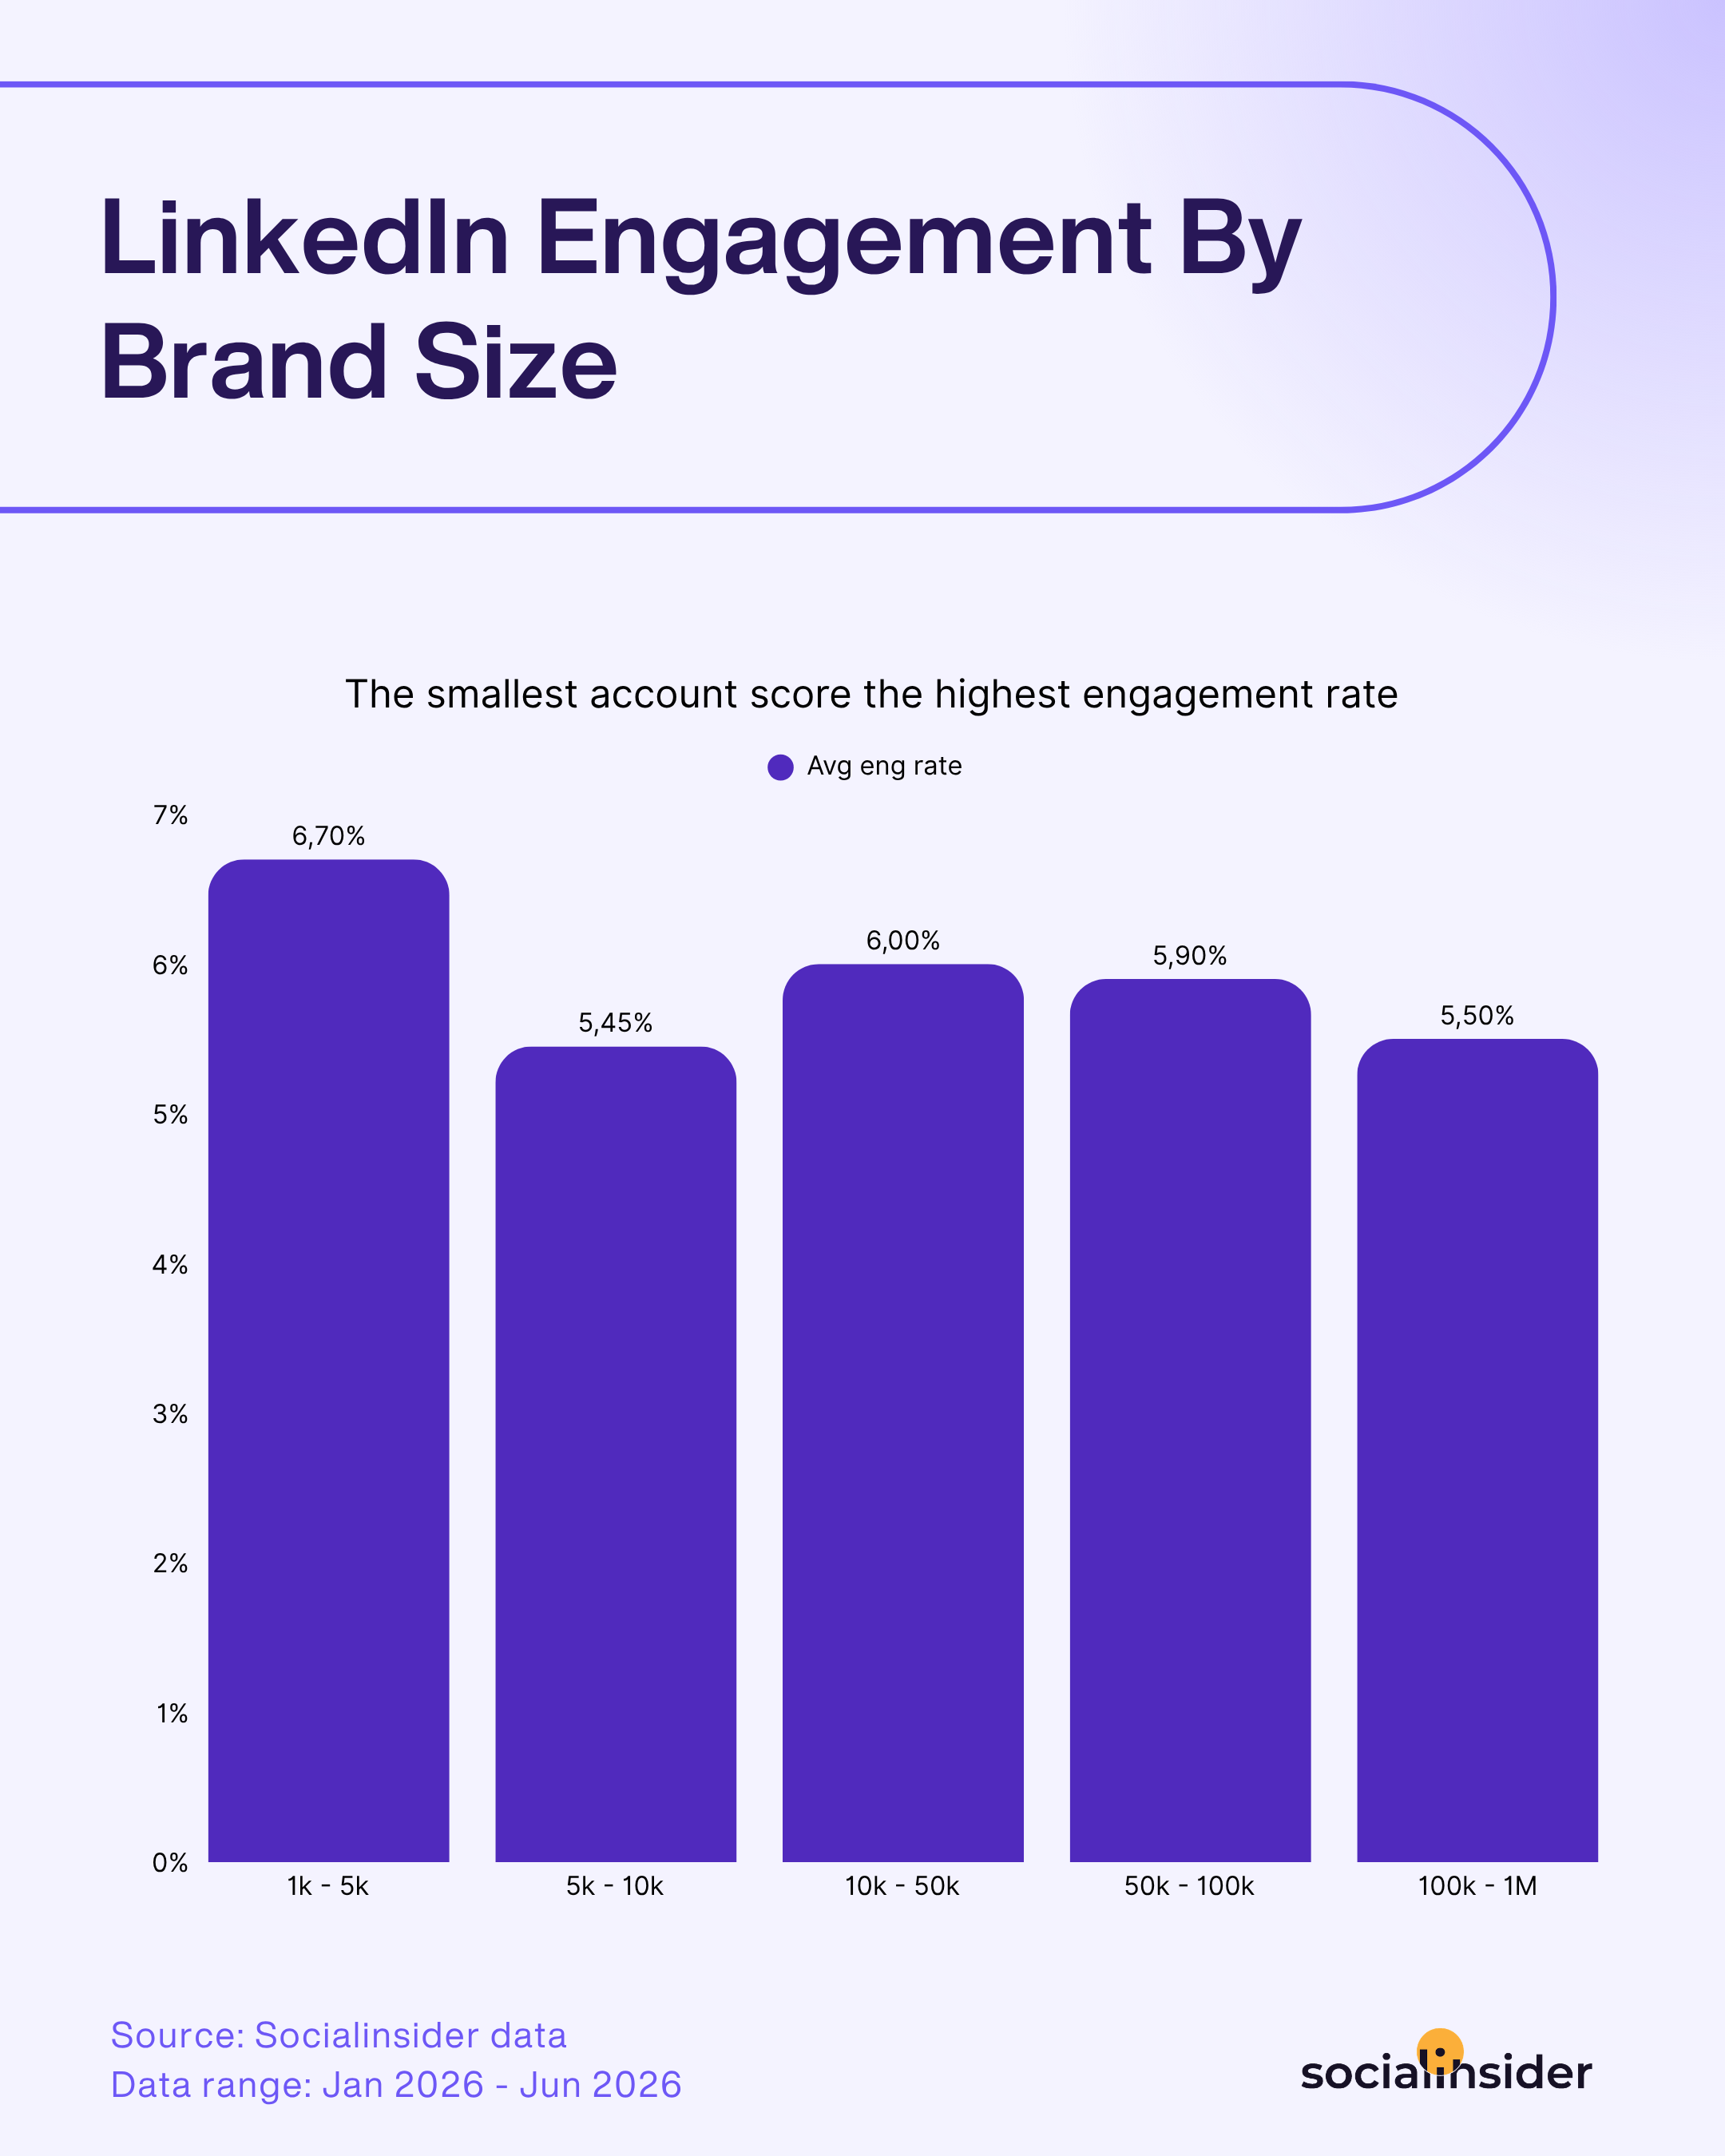
LinkedIn's overall engagement rate currently averages 5.20%, but that benchmark shifts by page size and format, and comparing a 5K-follower page against a 500K-follower page will only mislead you. The chart below shows how engagement fluctuates, going from 6.70% for the smallest pages, to 5.50% for the largest pages.
Once you have the right benchmark, use a content pillars breakdown to see which types of content are actually earning their place in your calendar.

That kind of insight is what turns a reporting deck from "here's what we posted" into "here's what we should post more of, and why," which is the version of the conversation that actually holds up when leadership asks about budget.
Final thoughts
As you've probably gathered by now, LinkedIn best practices for businesses aren't about doing more of everything. They're about knowing which formats, cadence, and metrics actually move the needle for a page your size, and building a strategy your team can sustain long after this quarter's plan is done.
Elena Cucu
Content & SEO Manager @ Socialinsider with 8 years of experience in marketing. I like to describe myself as a social butterfly with a curious mind, passionate about dancing and psychology.

Know what your competitors do — before your manager asks
Get instant social benchmarks & reports without manual work.