2025 Social Media Benchmarks
These social media benchmarks for 2025 will help you empower your strategy. See how your brand stacks up against industry standards.
The social media landscape in 2025 is more competitive than ever. With algorithm changes, the rise of silent viewers, and content saturation, brands can no longer depend on outdated strategies. Instead, they must evaluate their performance against real industry data to gain a better understanding of this evolving ecosystem.
We analyzed 125 million social media posts from 2023 to 2024 to understand the future of social media, audience interactions, and how brands can better prepare their strategies for 2025.
This 2025 Social Media Benchmarks Report analyzes engagement rates, impressions, likes, comments, shares, and posting frequency benchmarks across Facebook, Instagram, TikTok, and X (formerly Twitter).
By understanding these trends, brands can identify opportunities, optimize their content strategies, and enhance their social media return on investment (ROI).
Executive Summary
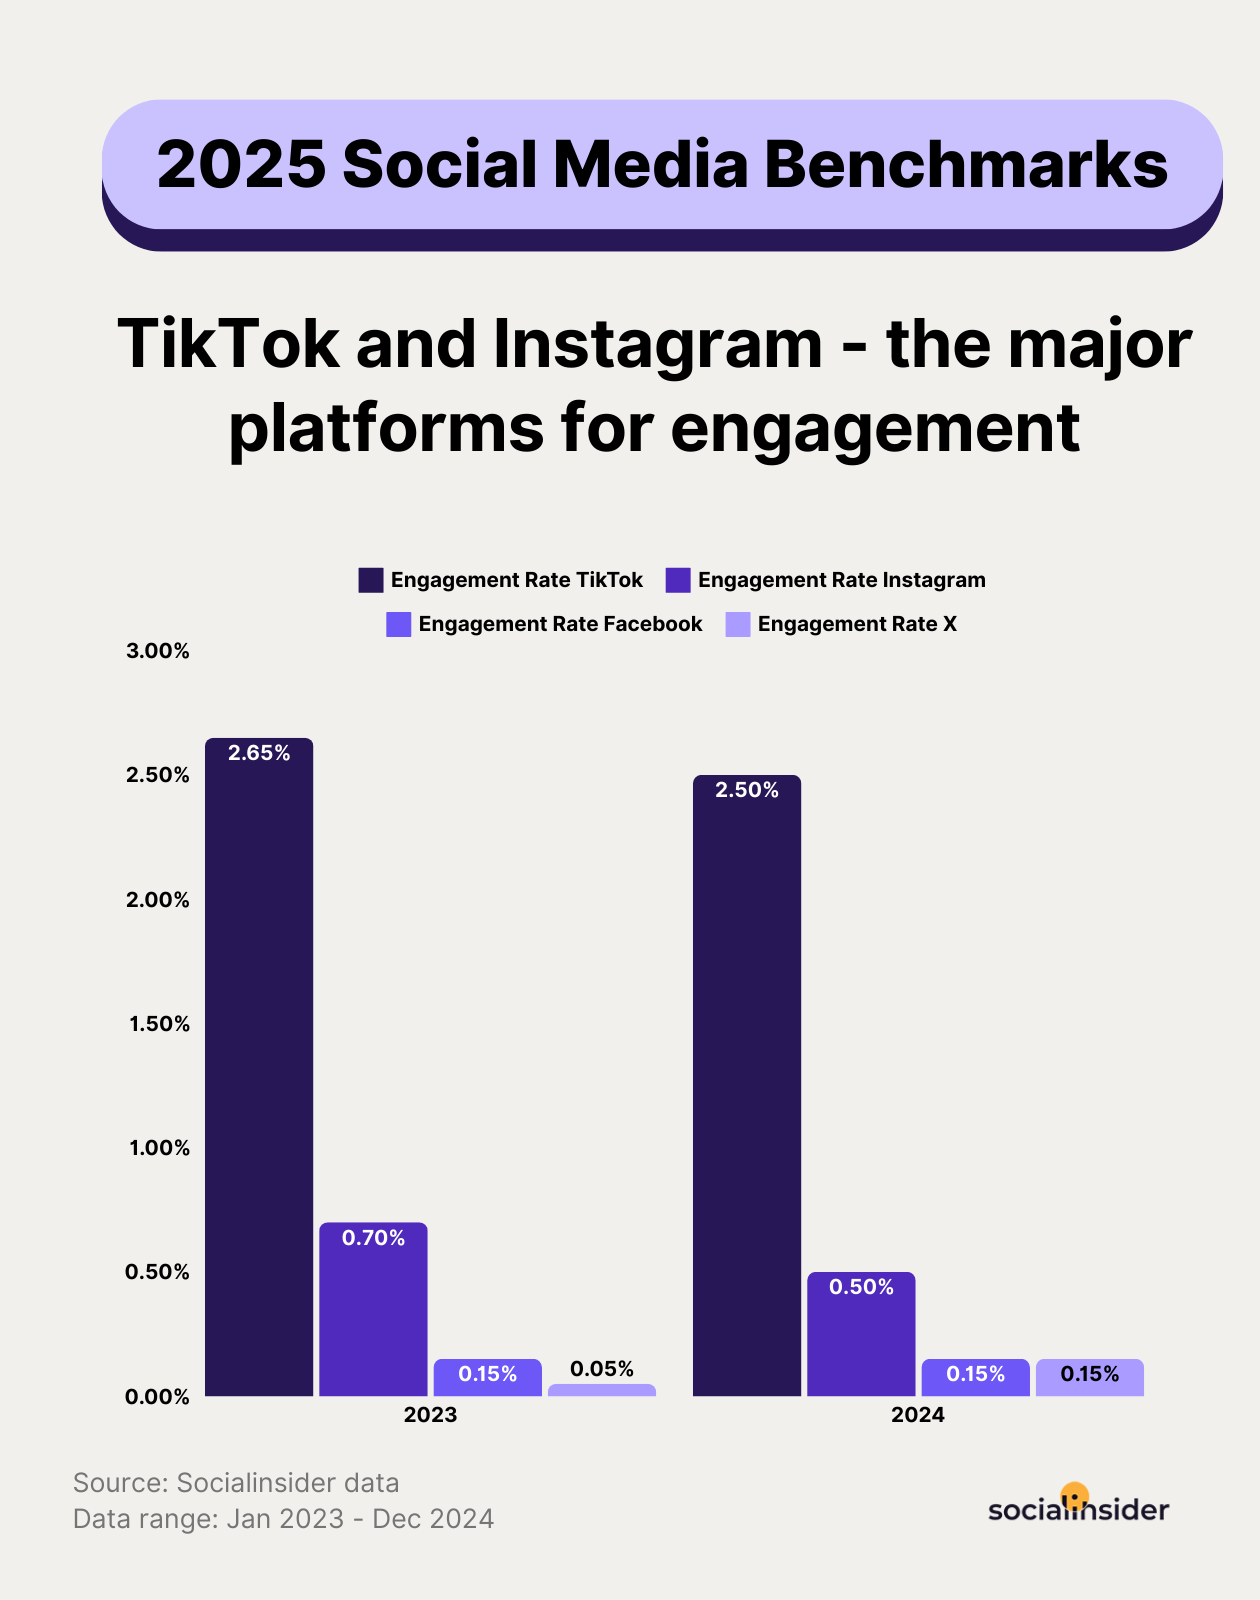
- TikTok and Instagram are the main platforms for engagement.
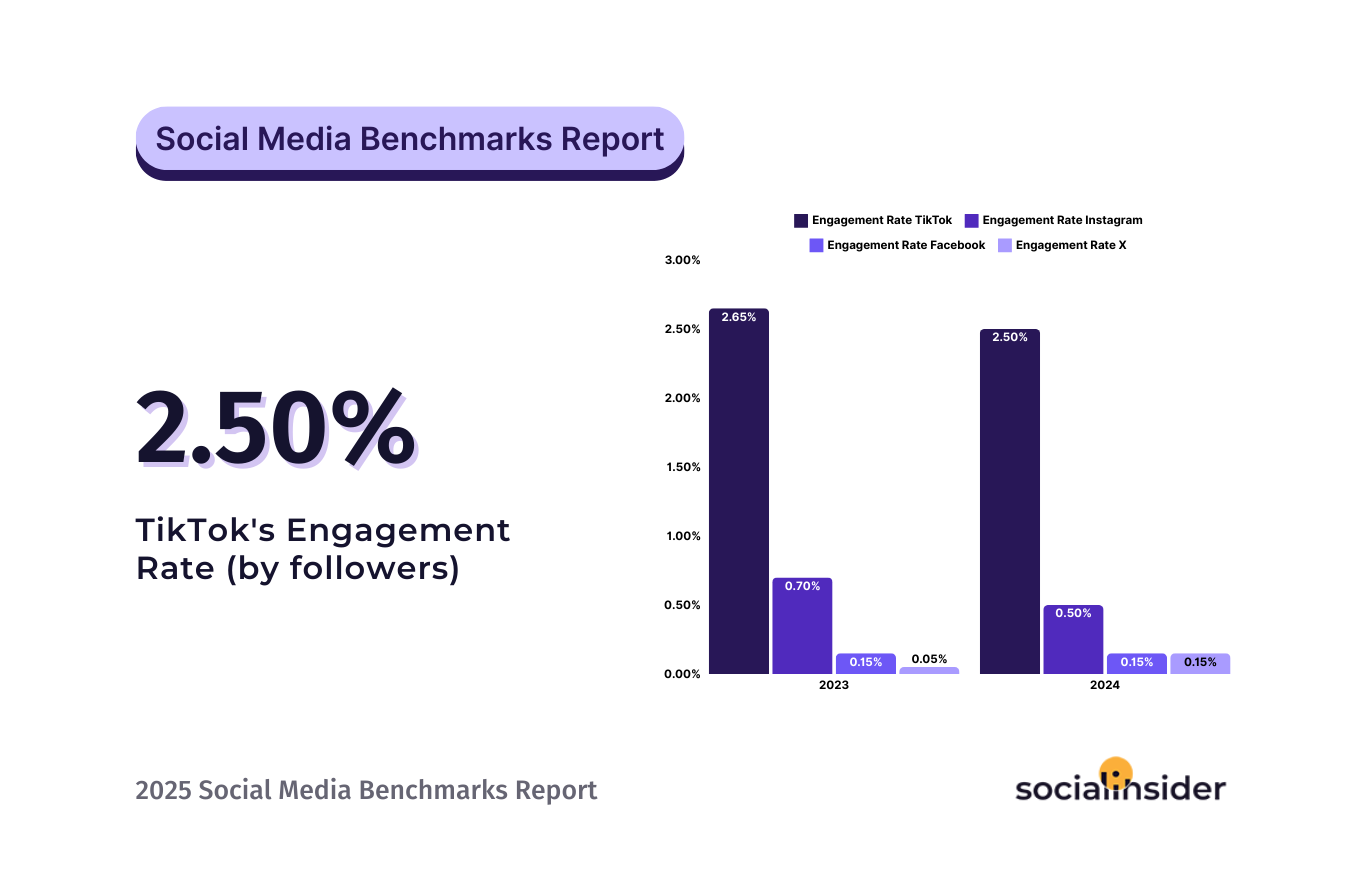
- Engagement on Instagram has dropped by 28% YoY, with a 2025 engagement rate of 0.50%.
- Engagement on TikTok remains consistent, with an engagement rate of 2.50%.
- In 2025, both Facebook and X (formerly Twitter) have an engagement rate of 0.15%.
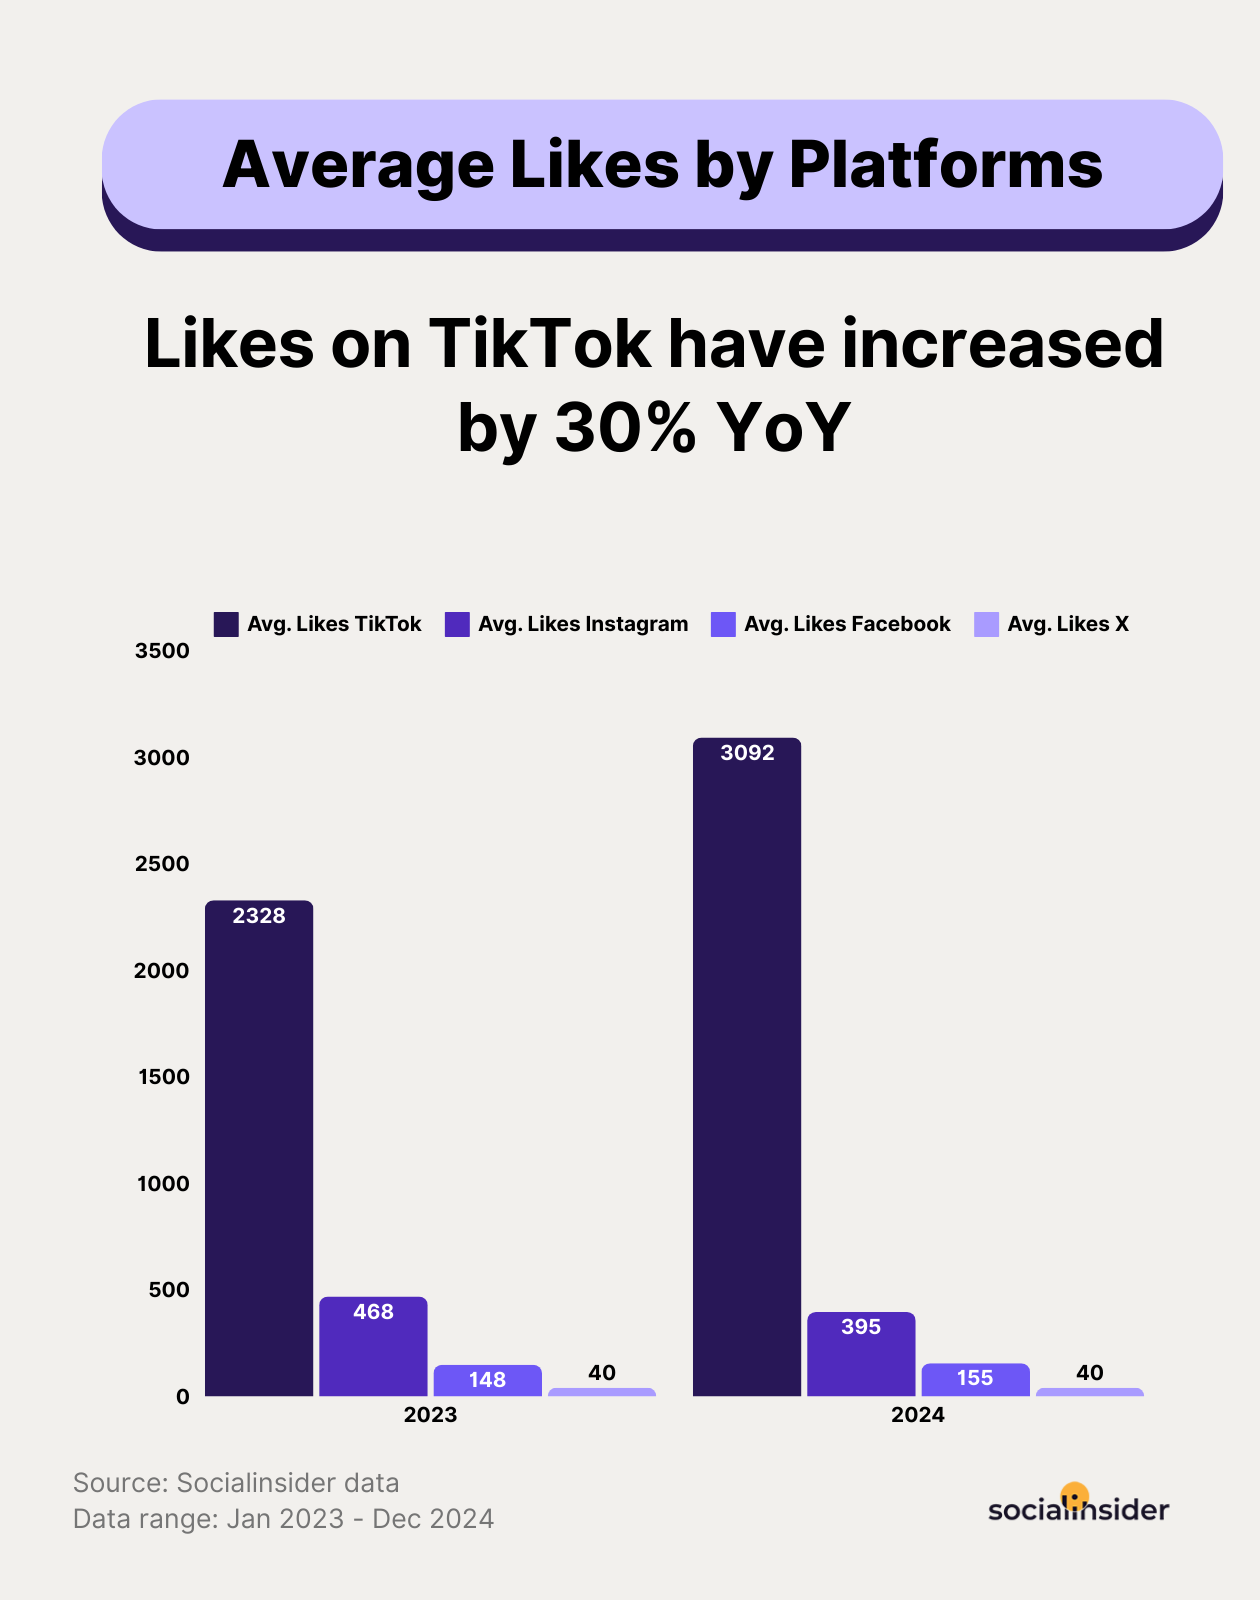
- People tend to prefer liking video content on TikTok more than on platforms like Instagram or Facebook, where the content is more diverse. - The average number of likes per post on TikTok is about 3,092, while Instagram posts receive approximately 395 likes on average.
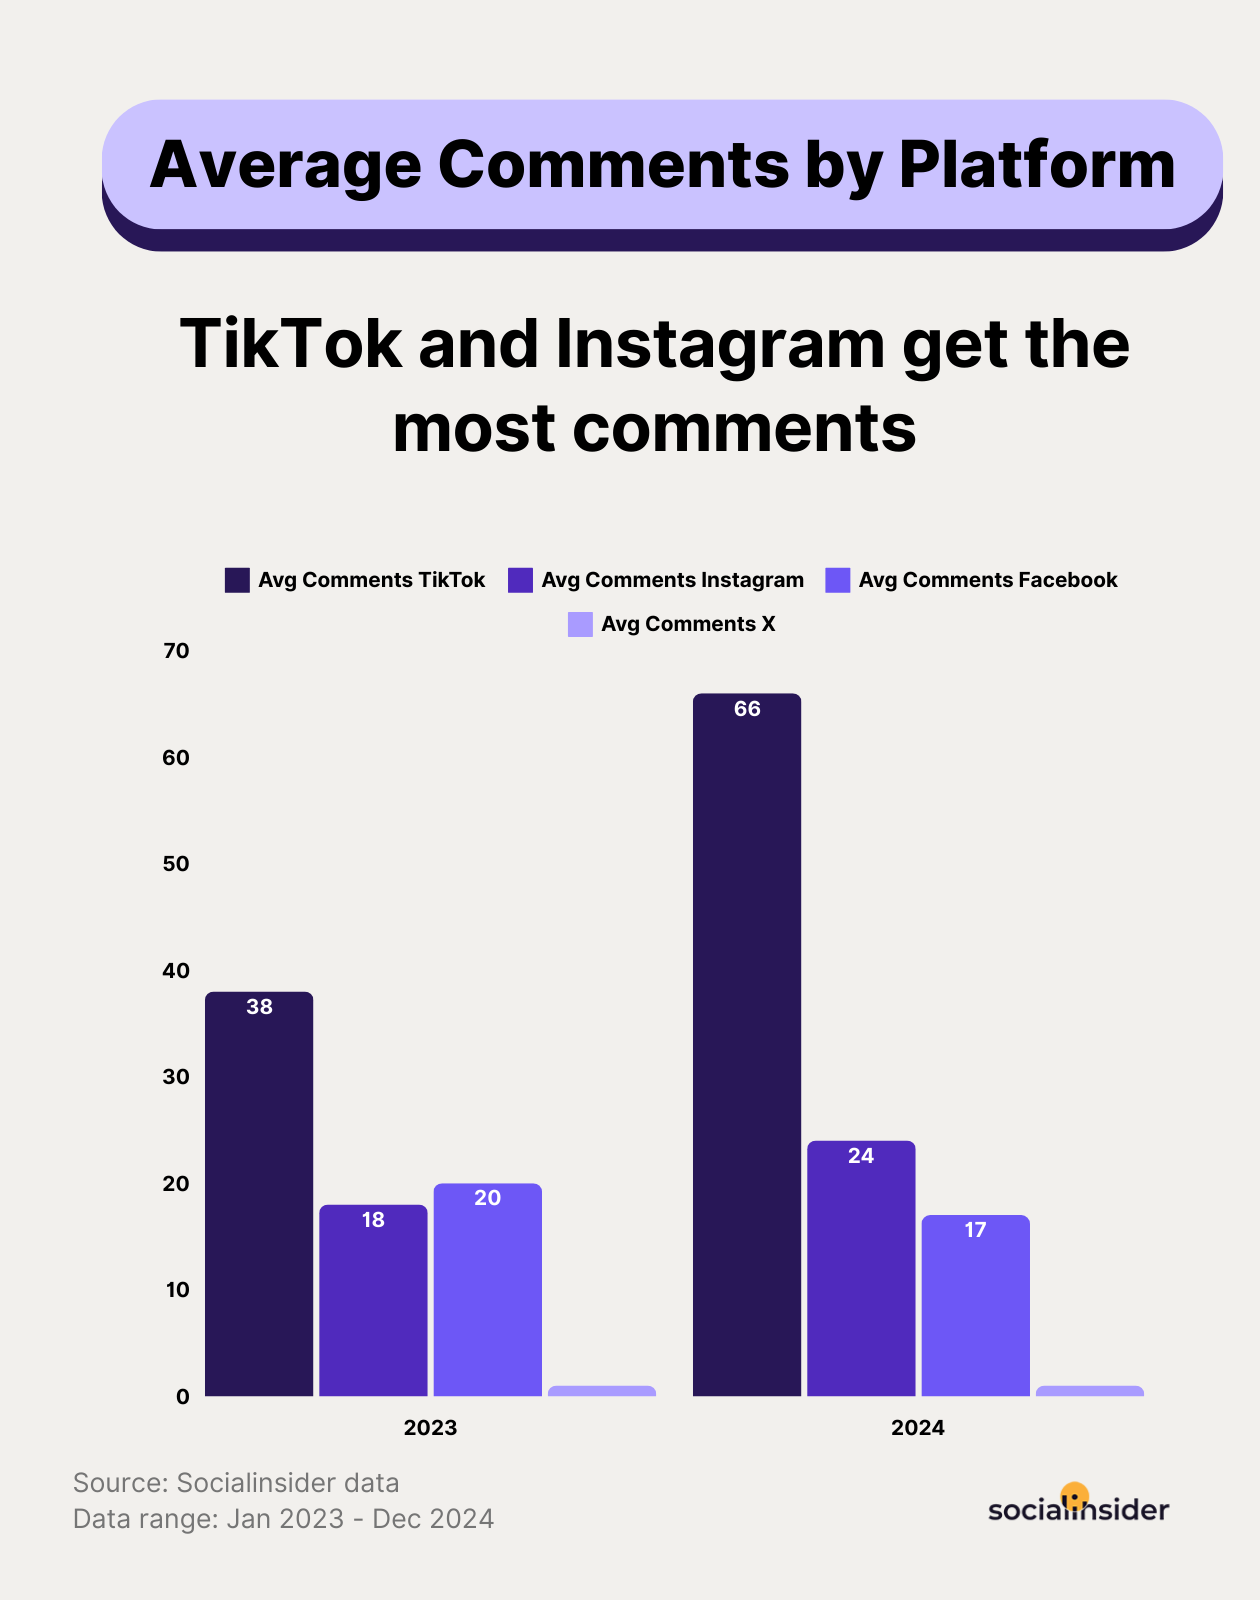
- While TikTok posts average 66 comments each, representing a 73% increase YoY, Instagram posts average 24 comments, showing a 33% increase YoY.
- TikTok has doubled its shares on posts, and Instagram's average for shares per post is 41.
- Impressions on Instagram have increased by 13% YoY, while impressions on TikTok have remained relatively stable.
- Brands typically post an average of 5 times per week on Instagram and 2 times per week on TikTok.
Social media benchmarks 2025 by platform
Engagement rate is the gold standard for measuring content effectiveness. It reflects how much users interact with posts, whether through likes, comments, shares, or other forms of engagement.
In 2025, TikTok has solidified itself as the king of organic engagement, with an average engagement rate of 2.50%. The platform’s superior engagement values highlight how TikTok’s algorithm continues to prioritize highly engaging content, rewarding posts that drive conversations and shares.
Meanwhile, Instagram’s engagement rate has dropped by 28% year over year, now at 0.50%. Despite more people seeing content, fewer are interacting with it, signaling that Instagram’s algorithm is prioritizing reach over deep engagement.
Facebook and X continue to struggle with low engagement rates, each sitting at 0.15% in 2025. While both platforms saw a slight increase from last year, their engagement remains far lower than TikTok or Instagram, making organic success increasingly difficult.
Why this matters
The numbers make it clear: TikTok is the best platform for organic engagement, while Instagram is becoming more of a reach-focused platform. If engagement is your goal, Instagram alone won’t be enough—you need to integrate TikTok, depending on how the platform evolves.
Instagram performs well with organic reach, even slightly outpacing TikTok. Reels and Stories are major drivers of growth, and engagement remains strong, though not quite at TikTok’s level. While Instagram doesn’t have the same level of creation features TikTok offers, that could change as the platform evolves. Malene Priebe Hold, Social Media Manager @ MCOBeauty
Facebook and X, while still valuable for certain audiences, now require paid strategies to achieve meaningful engagement. Organic performance on these platforms is no longer a viable strategy on its own.
Strategic tactics to boost engagement on social media
- Diversify your content strategies, considering newsletters as a top priority for a brand.
- Depending on the TikTok evolution, embrace multi-platform engagement through YouTube Shorts and Instagram Reels to share lo-fi content.
- Consider TikTok and Instagram main platforms for driving engagement and brand awareness.
- For Instagram, focus on highly engaging content types. Carousels, Reels, and interactive Stories (polls, quizzes, Q&As) drive more engagement than single images.
- On Facebook and X, shift towards a hybrid strategy. Combining organic content with strategic paid campaigns is now essential.
- Focus your social media marketing on communities, IRL experiences, instead of choosing one social media platform.
- Outbound engagement plays a crucial role in driving meaningful connection.
As we look to the future of social media, adaptability will be key for brands. With platforms like TikTok facing potential bans, it's crucial for brands to diversify their content strategies. Embracing multi-platform engagement through YouTube Shorts and Instagram Reels can ensure continuity and reach. The focus should be on creating authentic, engaging content that sparks a response from your target audience across various channels. - Brooke Sellas, Leading Digital & Social Care Consultant
Average likes per post across platforms
Likes are a quick, low-effort engagement metric, but they indicate content relevance and audience sentiment.
TikTok gets 9x more likes than Instagram, with an average of 3,092 likes per post, while Instagram posts receive 395 likes. Moreover, likes on TikTok have increased by 30% YoY.
The massive gap shows how TikTok users are more likely to engage with content passively. Instagram’s engagement drop suggests a shift in user behavior toward Stories and DMs rather than traditional likes.
We're moving more into the era of the silent viewers, the doom scrollers and attention will be even harder to have than before.We'll see more movement towards dark social as generations value their privacy more and more. But in the DMs and the closed groups, sharing of content will thrive. Making content that talks to real people, about real problems they face will be even more important than ever before. Beth Thomas, Director of Social @ Frankly
Meanwhile, Facebook remains stagnant at 155 likes per post, reinforcing the idea that its users engage differently, favoring long-form discussion over quick interactions.
X (Twitter) remains the weakest in this category, with an average of 40 likes per post—indicating that the platform is more about real-time conversations than traditional engagement.
Why this matters
A drop in likes doesn’t necessarily mean content is failing—it could mean users are engaging in different ways, such as saves or DMs.
For TikTok, likes remain a key metric, but comments and shares have grown even faster, meaning brands should focus on fostering deeper interactions rather than just chasing vanity metrics.
Instagram’s decline suggests that users prefer ephemeral engagement, meaning Stories with interactive content, and DMs may be the new focus.
Instagram is all about DMs these days and they represent a personal relationship which means people who you connect with in DMs (conversation back and forth) will see your content higher in their feed. So use CTAs on posts and Stories that encourage people to send you a DM - whether for a link, more information, to share a personal experience. - Jenn Herman, Instagram Expert
Strategic tactics to get more likes on social media
- Create content that your audience desires. Discover their pain points and go where they engage.
- Prioritize engagement over vanity metrics. Likes are strong, but comments and shares matter even more.
- On Instagram, experiment with interactive content. Stickers, polls, and engagement-driven Stories may perform better than static posts.
- On Facebook, shift focus to community engagement. Discussions, live streams, and group-focused content will yield better results than likes alone.
- For X, leverage conversational content. Instead of chasing likes, engage in trending discussions and create content that invites replies.
TikTok's absolutely crushing it and we're seeing way better engagement and lower CPMs than Instagram for our clients. Yes, there's a lot of noise in the ether about platforms like X and Meta, and whether TikTok's gonna' stay or go. Some of the content moderation changes are very scary, and politics is driving a lot of this chat. But here's the thing: it's not about chasing platforms. If your audience is somewhere, that's where you need to be, creating content that actually makes sense for that space. - Kineta Kelsall, Founder & Director of School of Social
Average comments across platforms
Comments are one of the strongest indicators of deep engagement because they require more effort than simply liking a post. A high comment rate suggests that content is sparking conversation, debate, or emotional connection—all of which signal a highly engaged audience.
In 2025, TikTok leads in comment activity across all social platforms. The average TikTok post receives 66 comments, a 73% increase year over year. This surge shows that TikTok users aren’t just passively consuming content—they’re actively engaging in discussions.
Instagram, while still strong, lags behind with an average of 24 comments per post. This is a 33% increase from last year, signaling that brands are finding better ways to encourage conversation, but the platform still isn’t as interactive as TikTok.
Stay flexible as new platforms and features are sure to keep popping up. The winners will be those who show their human side while being tech-savvy, finding that sweet spot between being genuine and innovative. Remember, it's about creating connections, not likes, that matter. Roll with the changes and keep it real! - Dorien Morin, Social Media Strategist @ More in Media
Facebook has seen a decline in comment activity, dropping from 20 comments per post last year to 17 in 2024. This indicates a shift in user behavior toward private interactions—Facebook users are still active, but they’re engaging more in closed communities (like groups) rather than on public posts.
X (formerly Twitter) remains the weakest in this area, with near-zero comments per post on average. The platform’s fast-paced nature means most engagement happens through retweets and quote tweets rather than direct replies.
Why this matters
TikTok’s high comment rate proves that it fosters genuine conversations. The platform’s interactive culture, comment-based trends, and creator responses are making it the most conversational social media platform in 2025.
Instagram is improving but remains more passive. While comment rates have grown, the platform still prioritizes DMs and private discussions.
Facebook’s declining comments signal a shift toward private discussions. Users are engaging more in groups and private messages rather than leaving public comments.
X remains an engagement challenge for brands. Comments are rare because users prefer quick interactions like retweets and reactions over lengthy discussions.
Strategic tactics to get more comments on social media
- On TikTok, create content that invites discussion. Encourage users to respond to prompts, share opinions, or tag friends in the comments. Creators who reply to comments boost engagement even further since TikTok promotes videos with active discussions.
- On Instagram, use captions as conversation starters. Instead of just describing the post, ask a question, spark debate, or invite storytelling.
- On Facebook, shift focus to group discussions. Since public post comments are declining, brands should engage with audiences in Facebook Groups where discussions are more active.
- On X, use polls and interactive threads. Direct comments are rare, engagement should come from polls, Q&A threads, and discussions around trending topics.
How are you keeping your audience engaged beyond short-form video? Email, communities, and even direct-to-consumer content strategies will set brands up for long-term success. Platforms change, but strong audience connections will always be the real currency. - Stephanie Carls, In-House Content Creator & Retail Insights Expert @ RetailMeNot
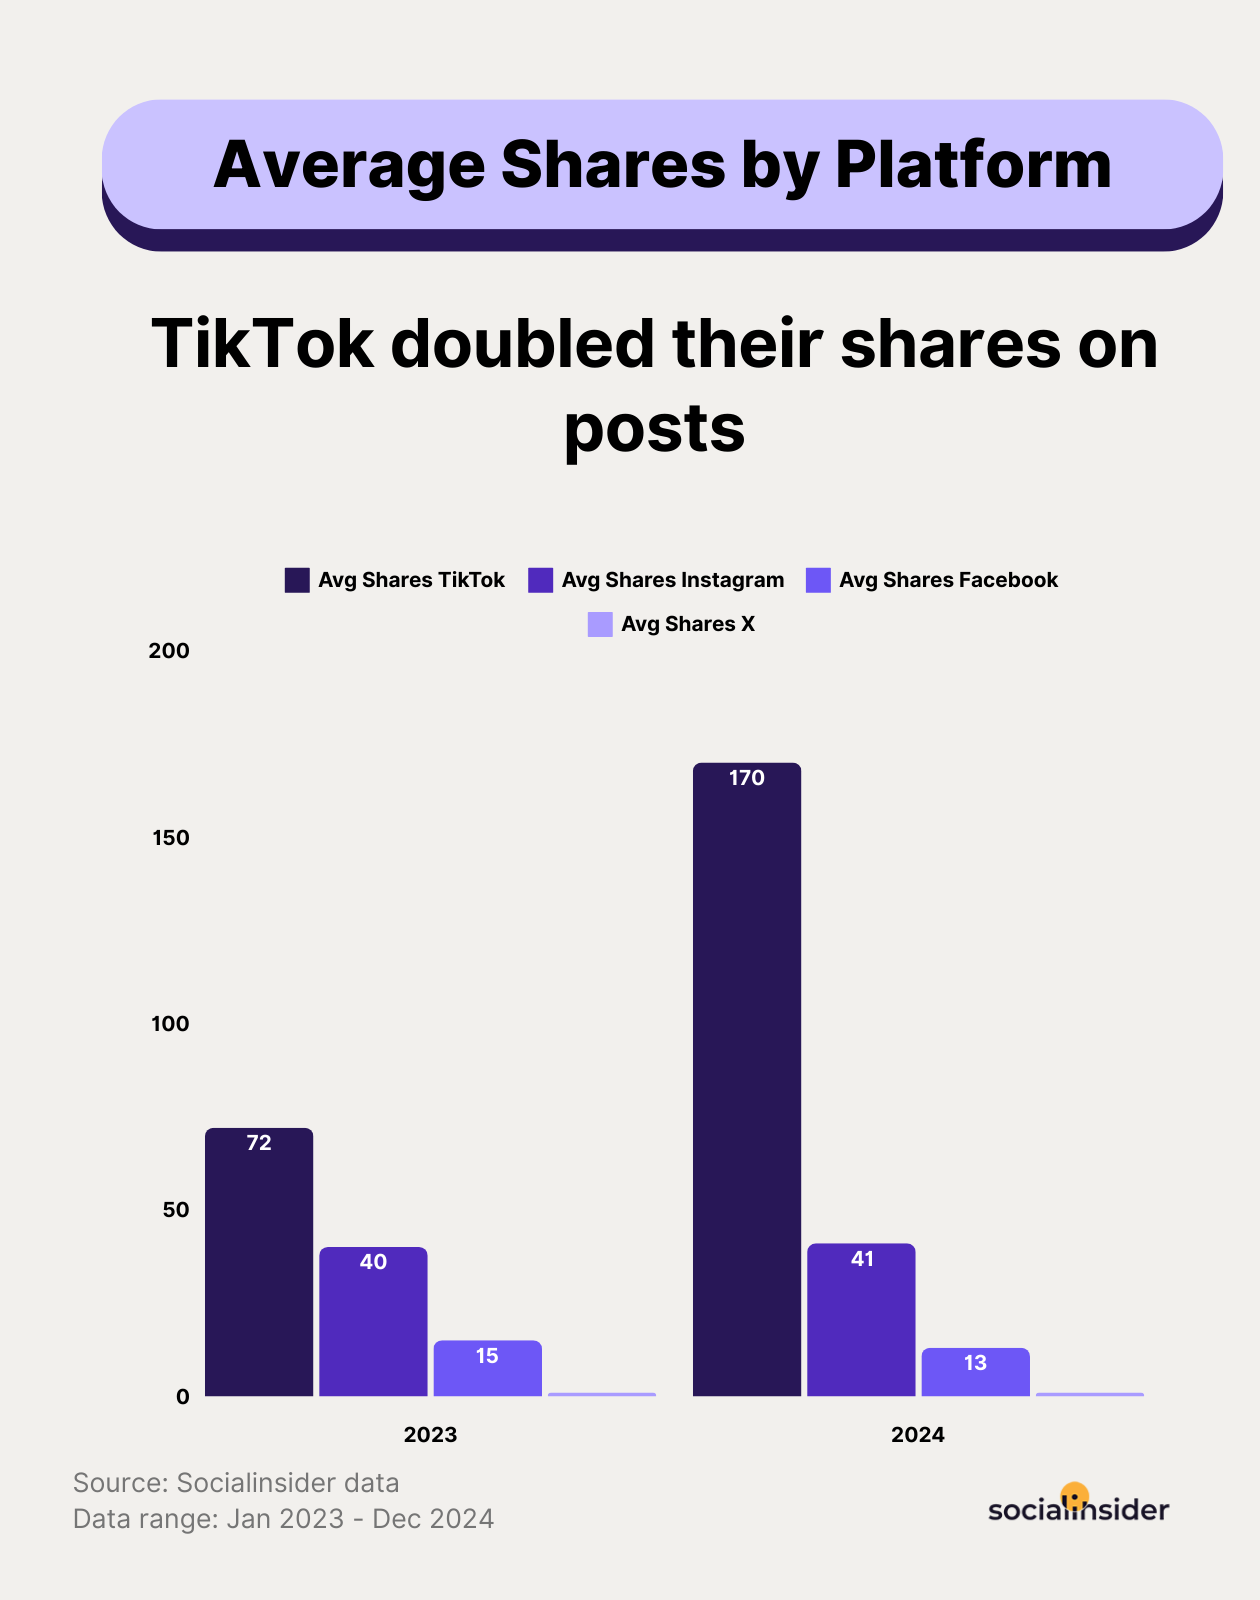
Average shares across platforms
Shares are the strongest indicator of brand awareness because they show that users aren’t just engaging with a post—they’re actively endorsing and distributing it to their own networks. Unlike likes or comments, which reflect personal interaction, shares extend a post’s reach far beyond its original audience.
Shares on TikTok have doubled year over year, reinforcing the platform’s viral nature. The combination of algorithm-driven discovery and a culture of remixing and trends makes TikTok content highly shareable. The average number of shares per post on TikTok is around 170.
On Instagram, shares remain relatively stable at 41 shares per post on average. While Instagram still allows content to spread, it lacks the same virality mechanics as TikTok—meaning that most shared posts come from Reels, carousels, and informative content.
As search on social continues to grow, we’ll see even more value put on the insights we can gather to generate content which gives our community a reason to engage. - Kymberley Thomson, Senior Global Social Media & Community Manager at Primark
Facebook is seeing a decline in shares, dropping from 15 shares per post in 2023 to 13 in 2024. This suggests that Facebook’s algorithm no longer prioritizes shareability as much as before, and users are less likely to share content on their personal timelines. Instead, most sharing happens within Facebook Groups rather than on public posts.
X (formerly Twitter) continues to struggle with low shareability, as most engagement happens through replies and quote tweets rather than direct shares. The platform’s rapid-fire nature makes it less suited for long-term content distribution.
Why this matters
TikTok’s shareability means it’s still the best platform for viral reach. Content that performs well doesn’t just get likes—it gets massively distributed to new audiences, fueling more organic growth.
Instagram’s share rate suggests that content still spreads, but less organically. The platform favors engagement within existing networks, meaning brands must incentivize sharing through calls to action.
Facebook’s declining shares show that users are shifting to private communities. Instead of sharing posts publicly, users are posting links and discussing content in Facebook Groups and DMs.
X struggles with traditional shares, but conversations drive distribution. Instead of focusing on post shares, brands should leverage trending discussions and quote tweets to boost visibility.
Change is part of social media, but the potential TikTok ban in the U.S. is next level. TikTok has been a game-changer for brands, creators, and advertising, and if it’s gone, brands need to pivot quickly. - Dayna Sara, Social Media Manager @ Dublin Airport
Strategic tactics to increase shares on social media
- Collaborate with micro-influencers to co-create content for Instagram and TikTok.
- On TikTok, create highly shareable content. Memes, trends, and emotionally resonant videos drive the most shares. Use hooks like “Send this to a friend who needs to hear this” or duet-friendly content to maximize distribution.
- On Instagram, encourage direct shares through captions. Phrases like “Tag someone who needs this!” or “Share this with a friend” can boost share rates. Carousels with educational or relatable content also perform well for shares.
- On X, leverage trending topics and viral threads. Instead of relying on traditional shares, focus on crafting tweets that get quoted and included in trending conversations.
- Track share-to-engagement ratio. A high number of shares with low likes or comments suggests that content is being distributed widely but not deeply engaging audiences.
- Likes per reach and DMs per reach are becoming the main drivers for getting more reach on Instagram, according to Mosseri.
Brands need to stop chasing virality and think of episodic, binge-worthy posts that build anticipation and keep audiences coming back. Combine that with storytelling, value-driven carousels, and creators who actually connect. - Madison Schidlowski, Freelance SaaS & Lifestyle Marketer
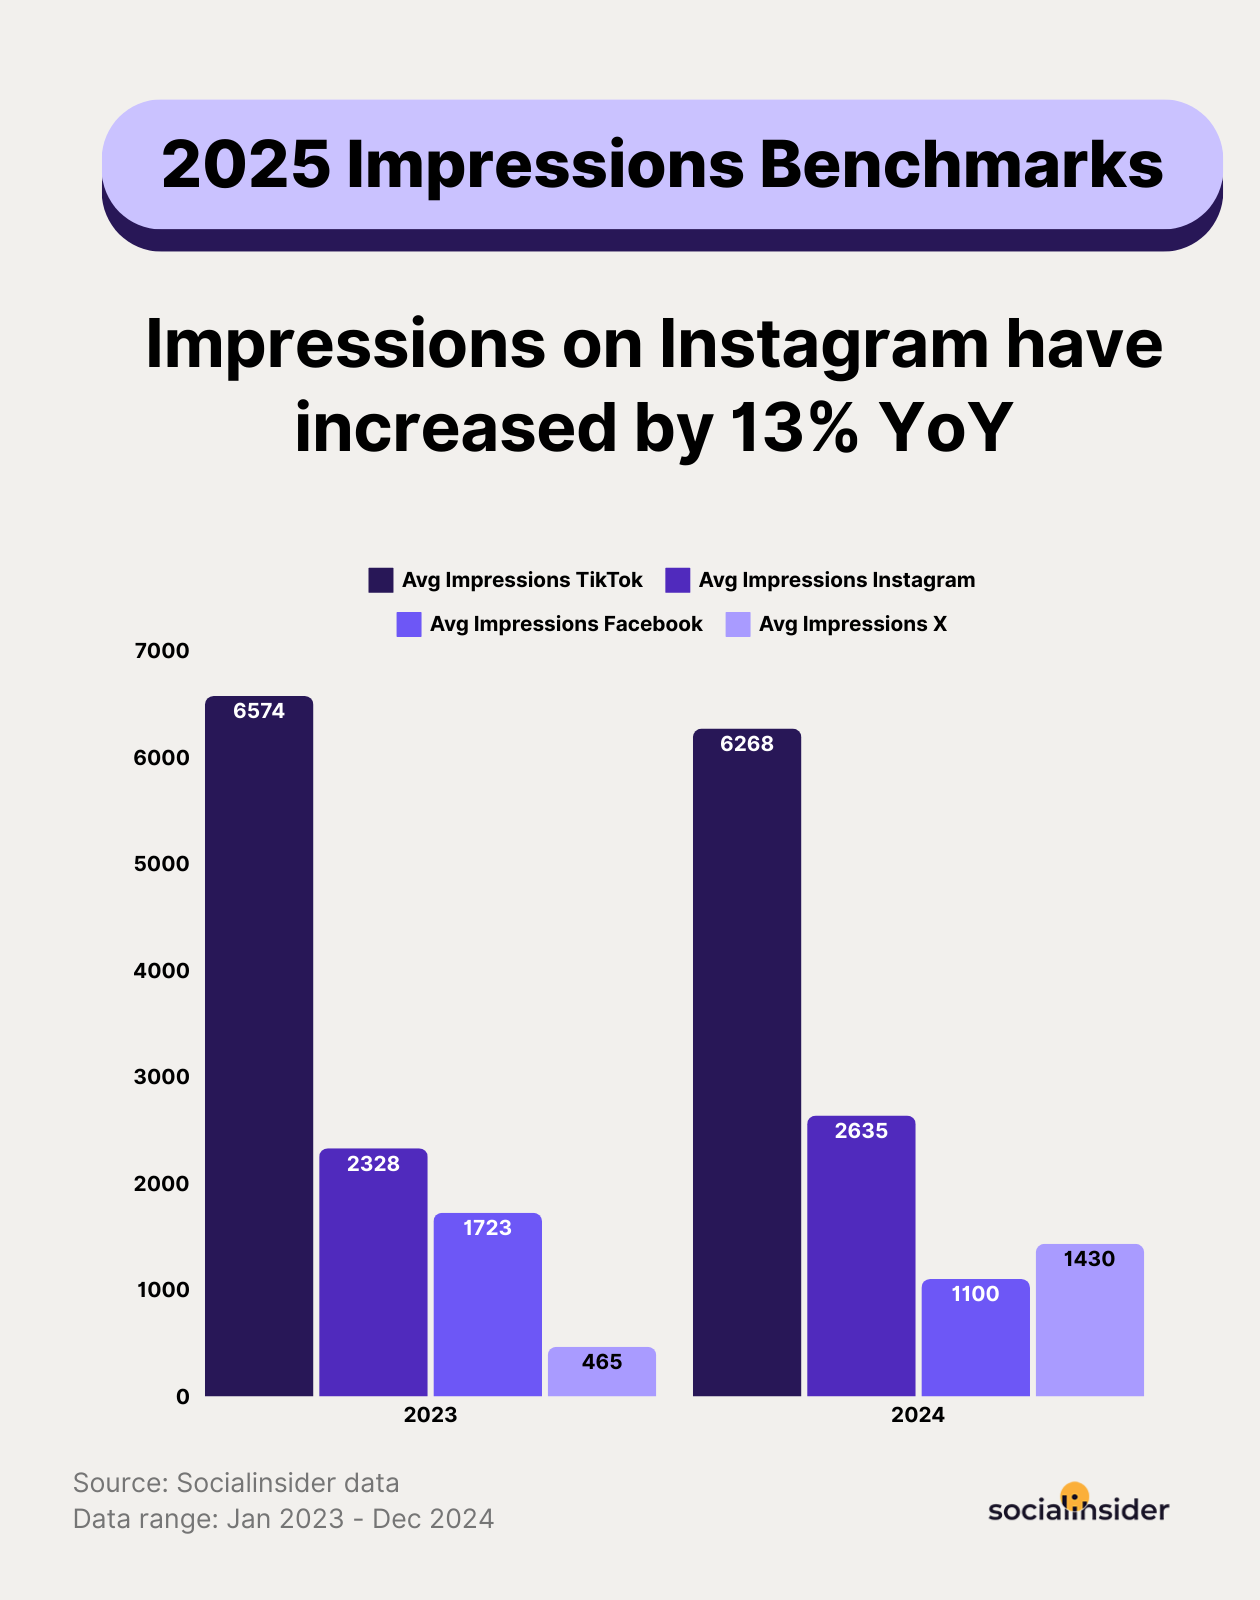
Average impressions benchmarks across platforms
Impressions measure how often a post appears on users’ screens, whether they engage with it or not. High impressions indicate that content is being surfaced by the platform's algorithm, but impressions alone don’t guarantee engagement. A post with millions of impressions but little interaction means users are seeing it—but not finding it compelling enough to engage with.
In 2024, Instagram has seen a 13% increase in impressions year over year, averaging 2,635 impressions per post. This suggests that Instagram’s algorithm is prioritizing content distribution, making posts more visible. However, this doesn’t necessarily translate to engagement—Instagram’s engagement rate is declining, which means users are seeing more content but interacting less.
TikTok impressions, on the other hand, have remained pretty steady, scoring an average of 6,268 per post, highlighting the platform’s great potential for extensive brand awareness.
Facebook, however, has experienced a 35% drop in impressions compared to last year, declining from 1,723 impressions per post to 1,116. This reinforces the ongoing trend that Facebook’s organic reach is shrinking and that brands need to rely more on paid advertising to maintain visibility.
X (formerly Twitter) has seen a significant increase in impressions, tripling year over year, now averaging 1,425 per post. Particularly sought for in-the-now content such as news and updates, this increase is understandable in the current social context, where changes are on the horizon for the social media world.
Why this matters
Instagram's increased impressions yet decreased engagement indicate users scroll past content without interacting. This implies brands must refine their content strategy to align with all funnel stages.
TikTok’s stable impressions and steady engagement confirm that its algorithm prioritizes interaction over passive reach. This means that quality engagement is rewarded more than simply getting a post seen.
Facebook’s declining impressions prove that organic visibility is fading. Brands can no longer rely on free reach and must incorporate ads and boosted posts to stay visible.
X’s impression growth is the result of the platform’s transition period.
Strategic tactics to get more impressions on social media
- On Instagram, optimize the first three seconds of your content.Users are seeing more content but interacting less. Use stronger visuals, compelling hooks, and engaging captions to capture attention before they scroll past.
- On TikTok, focus on interactive content. Because TikTok’s impressions remain stable, prioritize content that sparks conversation, encourages duets, and invites user participation.
- On Facebook, expect to invest in paid reach. With organic impressions dropping year over year, brands must use paid campaigns or focus on Facebook Groups to maintain visibility.
- On X, leverage increased impressions for conversation-driven content.More people are seeing posts, so engagement tactics like interactive threads, Q&As, and polls can turn passive viewers into active participants.
- Track your engagement-to-impressions ratio. If your impressions are increasing but engagement remains stagnant, you are focusing on top-of-the-funnel content. It is essential to integrate middle and bottom-of-the-funnel strategies as well.
The future of social media is all about adaptability. TikTok’s potential ban in the U.S. is a wake-up call for brands to prioritize diversification. YouTube Shorts and Instagram Reels are strong alternatives, but the real win is going multi-channel. - Fatima Khan, LinkedIn Coach
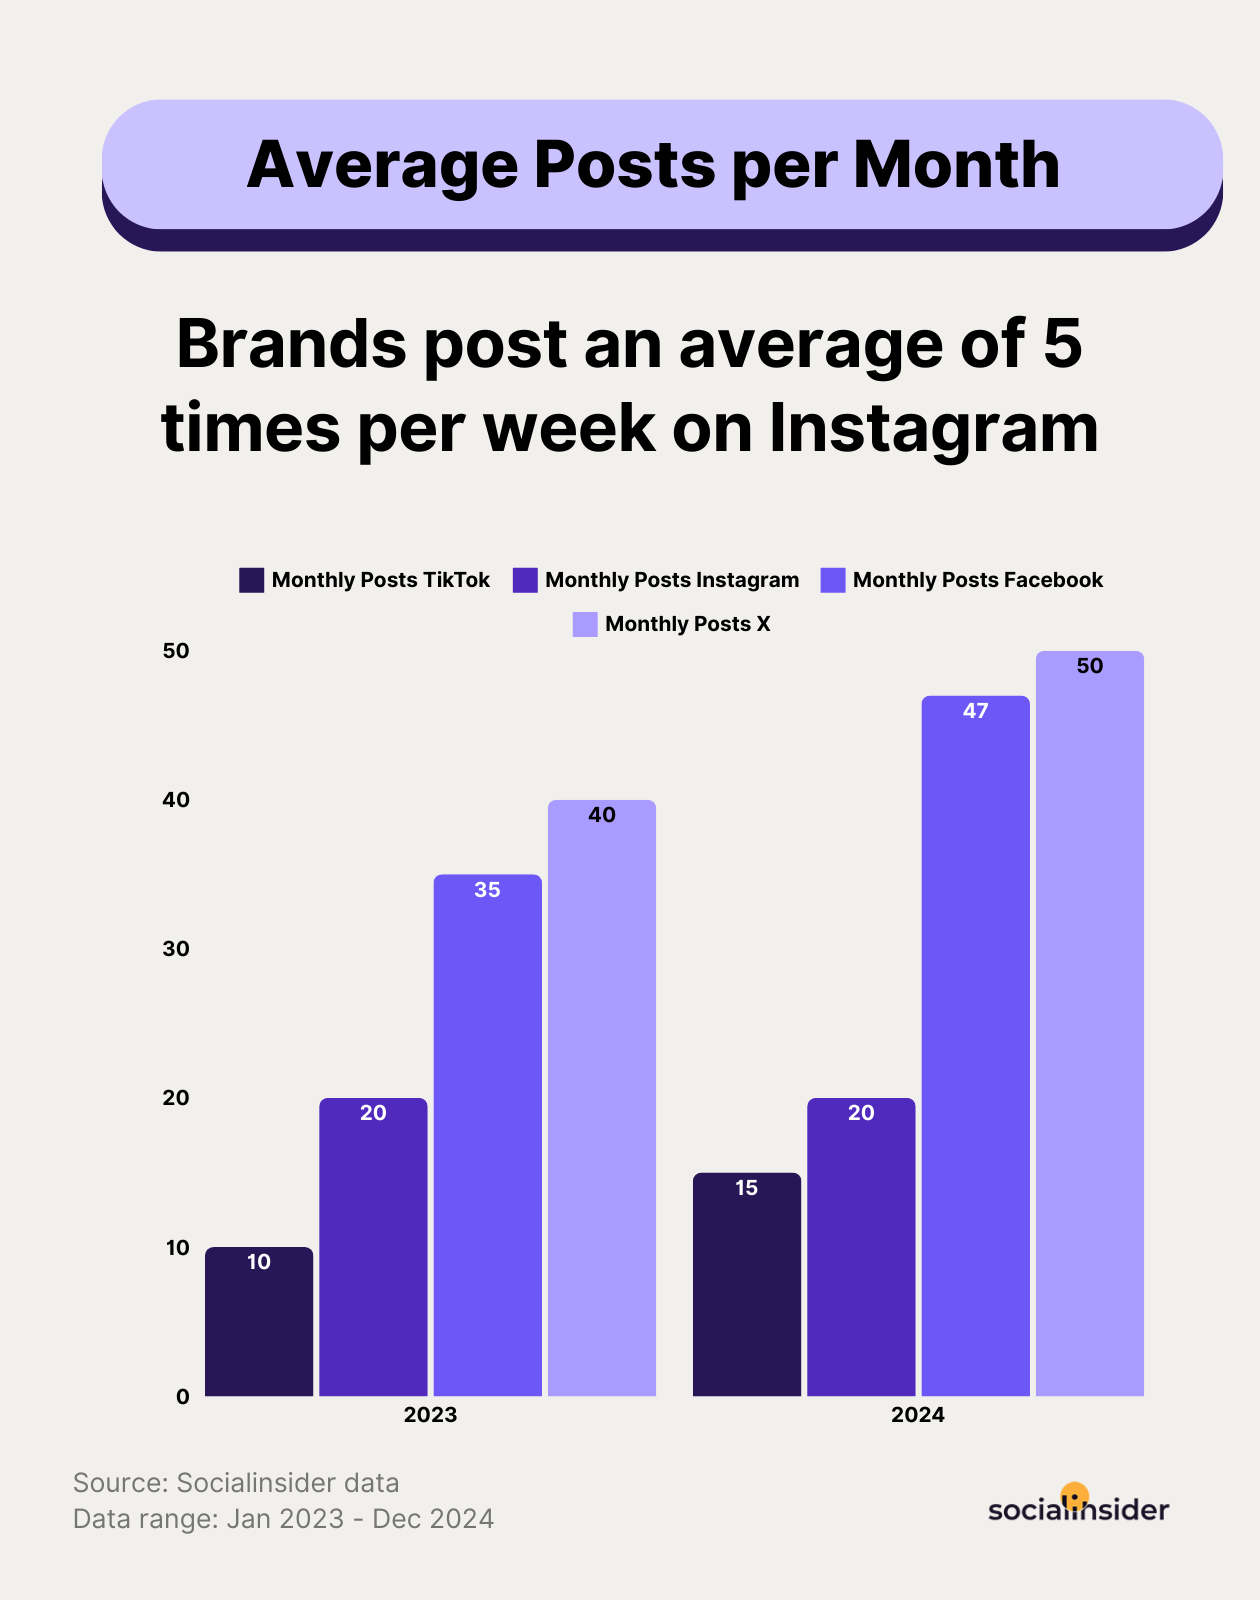
How often brands are posting on social media
Posting frequency is a critical factor in social media success, but more isn’t always better. Posting too frequently can lead to content fatigue, lower engagement per post, and audience disengagement.
Brands are posting on social media:
- Instagram: 5 posts per week
- TikTok: 2 posts per week
- Facebook: 7 posts per week
- X (Twitter): 10+ posts per week
Interestingly, brands are posting less frequently on TikTok than other platforms, yet seeing the highest engagement rates. This reinforces the idea that TikTok rewards quality over quantity.
Instagram’s five posts per week reflect a balance—posting too often can lead to declining engagement, as Instagram’s algorithm limits the reach of multiple posts from the same account in a short time.
Facebook’s higher posting frequency (7 posts per week) suggests that brands must stay highly active to remain visible. However, engagement per post remains low, meaning that brands must experiment with different content types to maintain user interest.
X (Twitter) continues to demand high posting frequency (10+ posts per week) due to its fast-paced, real-time nature. Unlike other platforms, tweets have a short lifespan, so posting frequently is necessary to stay relevant.
Why this matters
- TikTok’s success with a lower posting frequency proves that content quality matters more than quantity. Brands that post fewer, highly engaging videos outperform those posting more frequently with lower-quality content.
- Instagram’s engagement-per-post decline means brands must be strategic about when and what they post. Posting too frequently can reduce visibility, as Instagram’s algorithm prioritizes a diverse mix of content types.
- Facebook’s high posting volume is a response to its declining organic reach. Since impressions are down, brands are posting more often to stay visible—but this doesn’t necessarily improve engagement.
- X’s high posting demand means brands must maintain an active presence to stay relevant. However, brands should avoid spammy, low-value tweets and instead focus on meaningful conversations.
In the world of organic social I’d tell brands to focus on co-creation because your brand’s no longer your own. It’s shaped and created by you + community + creators. Plus, we all need to get comfy with being a little unhinged. Looking to brands who are winning on social right now, from Marc Jacobs to RSPB, they’re doing it through delulu, absurd, chaotic content. - Laura Shephard, Snr Social Planner @ Heinz UK
Strategic tactics to improve content performance
- On TikTok, post fewer but authentic videos. On Instagram, find your brand’s engagement sweet spot. Start with four to five posts per week and analyze engagement trends to see if more or fewer posts drive better performance.
- On Facebook, mix post types to sustain visibility. Since posting frequently is necessary but engagement is low, experiment with Facebook Reels, live videos, user-generated content, and discussion posts rather than just static updates.
- On X, focus on conversation-driven content rather than just volume. Posting often is required, but prioritize engaging in trending topics, polls, and interactive threads over generic posts.
- Track engagement drop-off to determine your ideal posting frequency. If engagement starts declining as you increase posts, scale back and focus on quality.
Continue reading:
Methodology
Within this social media benchmarking report, we provide a representative sample of international brands with an active presence on TikTok, Instagram, Facebook, and Twitter, between January 2023 - December 2024. The findings of this study are based on the analysis of 125M social media posts.
We define social media engagement rate as measurable interactions on Facebook, Instagram, Twitter, and TikTok posts, including comments, reactions, and shares, with the particularities for each platform.
Facebook engagement rate per post (by followers): Facebook engagement rate per post is calculated as the sum of reactions, comments, and shares on the post divided by the total number of fans that page has. The result is then multiplied by 100.
Instagram engagement rate per post (by followers): Instagram engagement rate per post is calculated as the sum of likes and comments on the post divided by the total number of followers that the profile has. The result is then multiplied by 100.
Twitter engagement rate per post (by followers): Twitter engagement rate per post is calculated as the sum of likes and Retweets received on the Tweet divided by the total number of followers that profile has. The result is then multiplied by 100.
TikTok engagement rate per post (by followers): is calculated as the sum of likes, comments, shares, and saves on the post divided by the total number of posts. The result is then divided by the total number of followers and multiplied by 100.
Average likes per post: represents how many likes a post receives on average.
Average comments per post: represents how many comments a post receives on average.
Average shares per post: represents how many shares a post receives on average.
Average impressions per post: represents how many impressions a post receives on average.
Analyze your competitors in seconds
Track & analyze your competitors and get top social media metrics and more!
Ready to improve your social media strategy with real-time insights?
Get strategic insights, analyze the social performance across all channels, compare metrics from different periods and download reports in seconds.