YouTube Performance Metrics: What to Track and How to Use the Data?
Discover what the most important YouTube metrics are, for specific goals tracking and learn how to use the insights to improve your strategy.

We’ve all opened YouTube analytics, looked at a wall of numbers, and wondered which YouTube metrics actually deserve attention. Views go up, engagement drops, retention fluctuates, and suddenly every dashboard starts feeling more confusing than helpful.
After studying how successful brands and creators approach content strategy, I noticed something interesting: high-performing channels rarely obsess over every metric. Instead, they focus on the YouTube metrics that reveal audience behavior and predict future performance.
In this guide, I’ll break down the YouTube analytics that truly matter, how to interpret them without the overwhelm, and how to use them to create content people genuinely want to watch.
Key takeaways
-
How does tracking the right YouTube metrics impact your content strategy? Tracking the right YouTube metrics helps you identify exactly where viewers click, drop off, engage, or return, allowing you to refine topics, hooks, pacing, thumbnails, and publishing strategies based on real audience behavior instead of assumptions.
-
A 4-pillar analytics metrics framework that helps with strategy formulation and optimization: This is a YouTube analytics framework built around reach, engagement, retention, and growth that helps simplify performance analysis and prioritize the optimizations that drive sustainable channel growth.
-
How to benchmark your YouTube metrics analytics against competitors? By using benchmarking tools like Socialinsider to compare your channel’s metrics against competitors, you can see which topics, formats, thumbnails, posting frequencies, and engagement patterns consistently drive higher views, retention, and audience growth, helping you replicate successful strategies, identify content gaps, and prioritize the optimizations most likely to improve performance.
How does tracking the right YouTube metrics impact your content strategy?
A lot of social media growth strategies on YouTube fall apart for one simple reason: teams optimize for numbers that look good in reports instead of numbers that explain audience behavior.
A video hitting 100K views sounds impressive. Until you realize viewers dropped after 20 seconds, barely engaged, and never came back.
That’s the difference between vanity metrics and strategy-driving metrics. One feeds your ego. The other improves your content.
The real value of YouTube analytics metrics is understanding why people watch, stop watching, click, ignore, binge, or subscribe.
Important YouTube metrics like audience retention, watch time, CTR, engagement rate, and returning viewers expose patterns you’d otherwise miss. They show whether your hook worked, whether your pacing lost people, and whether your content is actually building loyalty over time.
This is where social media data collection becomes useful beyond reporting.
You stop relying on instinct alone and start recognizing patterns across titles, formats, posting cadence, thumbnails, and topics.
That shift is what turns random uploads into a real social media content strategy. The strongest brands and creators treat YouTube metrics like continuous audience feedback, refining content decisions based on behavior rather than assumptions.
Over time, those small adjustments compound into stronger engagement, higher retention, and more sustainable channel growth.
A 4-pillar analytics metrics framework that helps with strategy formulation and optimization
Looking at YouTube video performance metrics without a framework can be deceptively chaotic.
One minute your views are climbing, the next your retention graph drops off a cliff. And suddenly… a single dashboard has you rethinking your entire content strategy.
But the issue usually isn’t the lack of data. It’s knowing how to separate useful signals from distracting noise.
To make analytics more actionable, I use a simple 4-pillar framework built around reach, engagement, retention, and growth.
These four categories make it easier to interpret YouTube channel metrics, spot patterns, and make smarter decisions about what to improve next.
The reach-engagement retention growth model
Each pillar in this model answers a different strategic question about content performance.
Are people discovering your videos? Are they engaging with them? Are they staying interested long enough for the content to matter? And are those interactions translating into sustainable audience growth over time?
Looking at these pillars together creates a more balanced view of channel performance. This helps you spot weak points, validate what’s working, and prioritize the optimizations most likely to improve results.
So let’s get started:
Reach metrics to analyze
A lot of YouTube videos fail because nobody clicks on them in the first place.
That’s why reach metrics are the first thing I analyze.
Before you look at engagement or retention, you need to understand whether your content is being discovered. And whether viewers feel compelled to click.
The video metrics below help uncover where visibility, positioning, or distribution friction is actually happening:
- Impressions
Impressions tell you how often YouTube surfaces your video across places like Home, Search, Suggested Videos, or Shorts feeds. I like to think of this metric as YouTube “testing” your content with potential viewers.
In the example below, the channel generated 2.7K impressions over 28 days, meaning YouTube repeatedly surfaced these videos to viewers across its recommendation system.
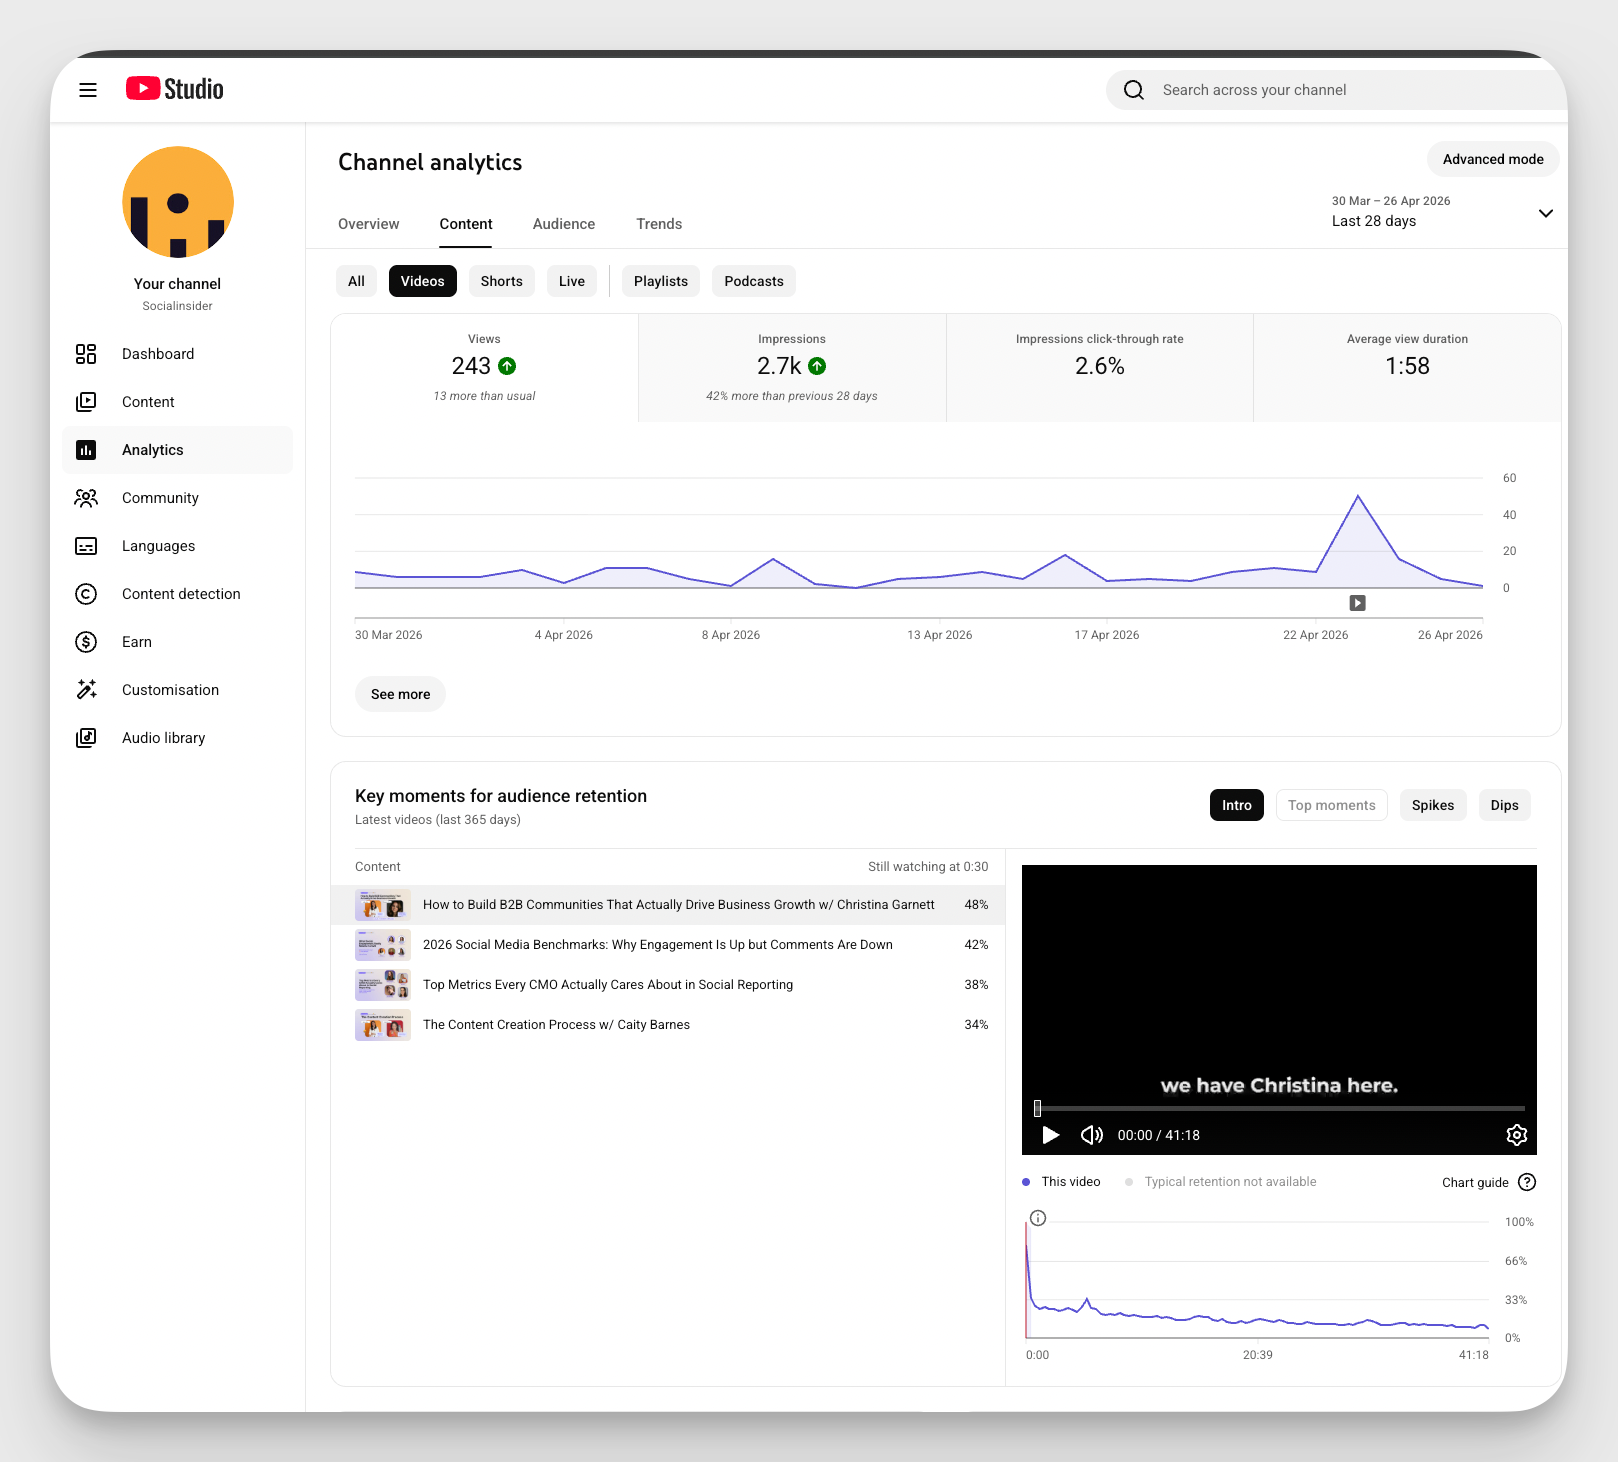
When impressions increase consistently, it usually means the platform is gaining confidence in understanding who your content is relevant to.
But impressions alone can be misleading. I’ve seen videos generate huge distribution numbers while underperforming simply because the packaging didn’t match audience expectations.
That’s why I never analyze impressions in isolation. A spike in visibility only matters if viewers actually click and stay engaged afterward.
- Click-through rate (CTR)
CTR is one of the fastest ways to diagnose whether your packaging strategy is working.
It tells you how many people clicked after seeing your video impression. Which means this metric is heavily influenced by your title, thumbnail, topic framing, and audience targeting.
But here’s the mistake I see constantly: people assume low CTR automatically means the content is weak.
In most cases, it means the positioning is weak. The video itself might be valuable, but the hook surrounding it isn’t persuasive enough to compete for attention.
I also recommend looking at CTR relative to traffic sources.
Search-driven videos usually have different click behavior than Browse or Suggested traffic because user intent changes depending on where discovery happens.
A “good” CTR is never universal. Context matters.
- Traffic sources breakdown
Traffic source reports are one of the most useful YouTube analytics sections for social media content strategy because they reveal how your audience naturally finds your videos.
In the example below, nearly 50% of views come from external traffic, while YouTube Search contributes around 21%. That instantly changes how I’d interpret the channel’s distribution strategy.
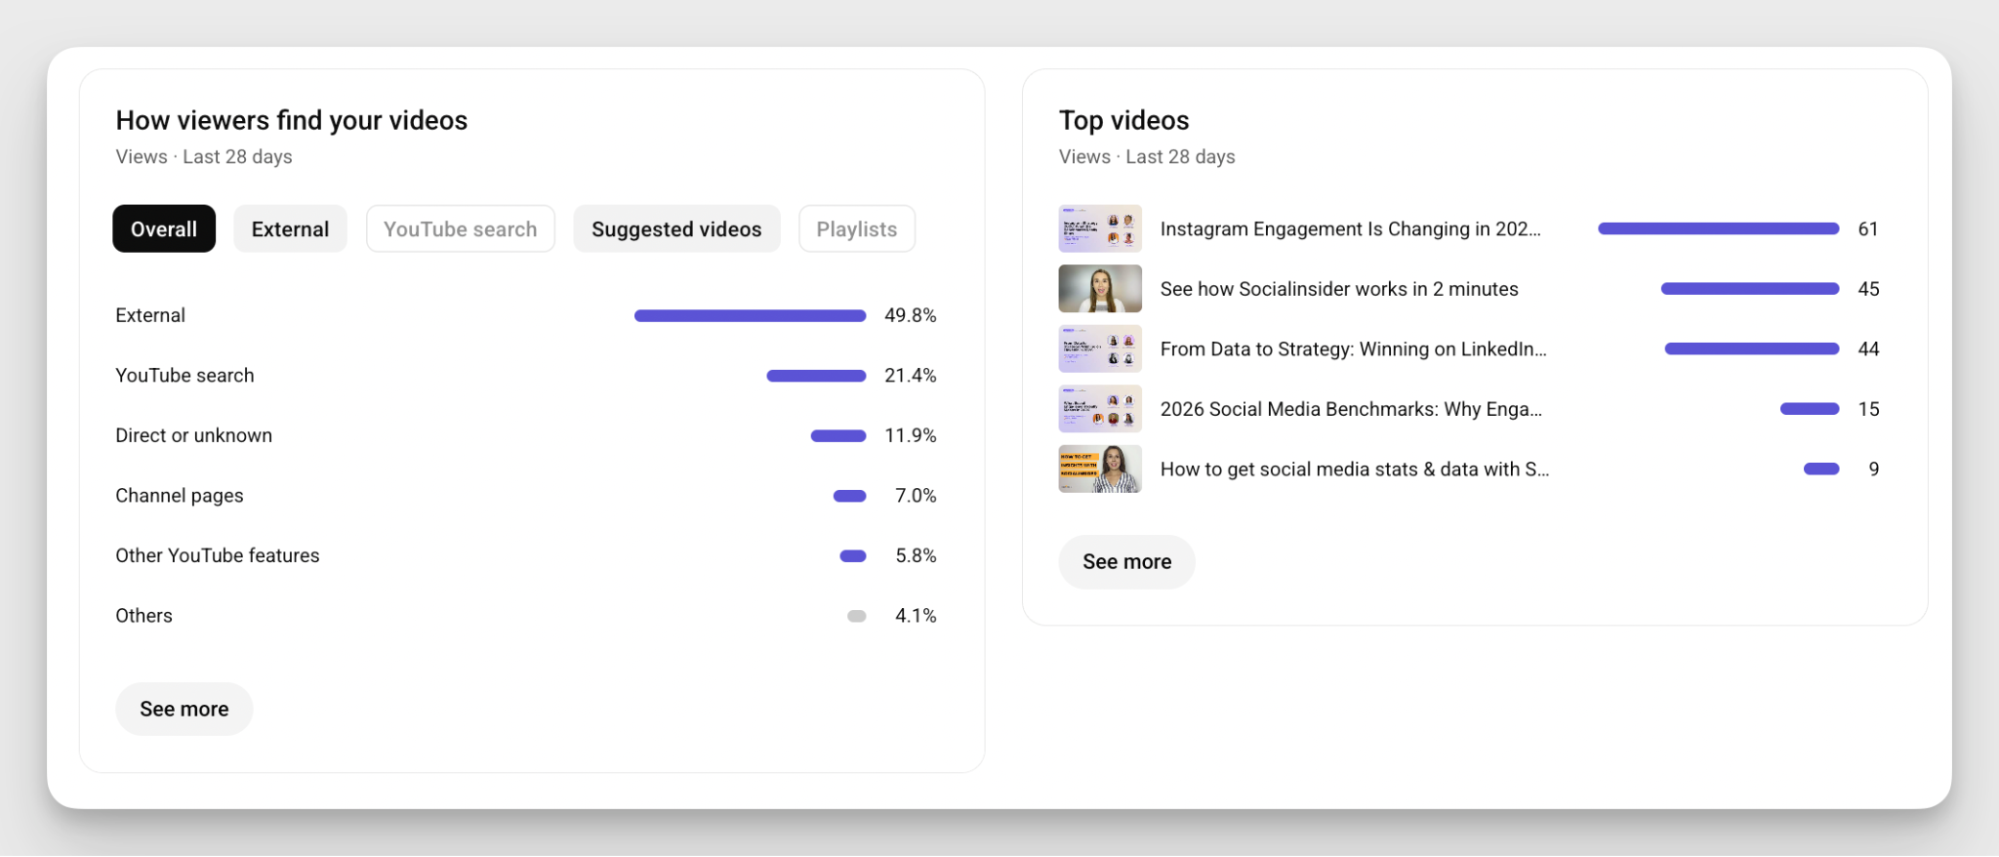
Heavy external traffic often means content is being amplified through newsletters, LinkedIn posts, communities, embeds, or other social platforms.
That can be a strength, especially for brands with strong off-platform audiences, but it can also reveal that YouTube’s recommendation system still isn’t driving enough native discovery yet.
On the other hand, if Search traffic consistently performs well, I’d usually double down on educational, intent-driven, and evergreen topics because the data suggests strong discoverability behavior.
If Suggested Videos or Browse features dominate, the optimization focus shifts toward stronger hooks, tighter topic clustering, and more clickable packaging.
The biggest mistake I see is treating traffic sources like passive reporting data. They’re actually strategic signals. They tell you where your content naturally gains momentum, which is exactly where your distribution and optimization efforts should become more intentional.
Engagement metrics
Reach shows discovery. Engagement shows audience response.
That’s why engagement metrics are among the most valuable social media metrics for understanding which content people actively connect with.
So here’s what you should pay attention to:
- Likes and dislikes
Likes and dislikes are often oversimplified, but I think they become much more useful when analyzed as behavioral patterns instead of emotional feedback.
A high number of likes usually signals immediate viewer satisfaction. The audience felt the content delivered on its promise.
Dislikes, on the other hand, can reveal friction between expectation and experience.
Sometimes the topic attracts the wrong audience. Other times, the title creates expectations the video never fully satisfies.
However, what matters most is identifying patterns. If certain hooks, formats, or topics consistently generate stronger positive reactions, that’s usually a signal worth integrating into your broader content strategy.
- Comments and shares
Comments and shares are obviously some of the most valuable engagement metrics because they signal active audience investment.
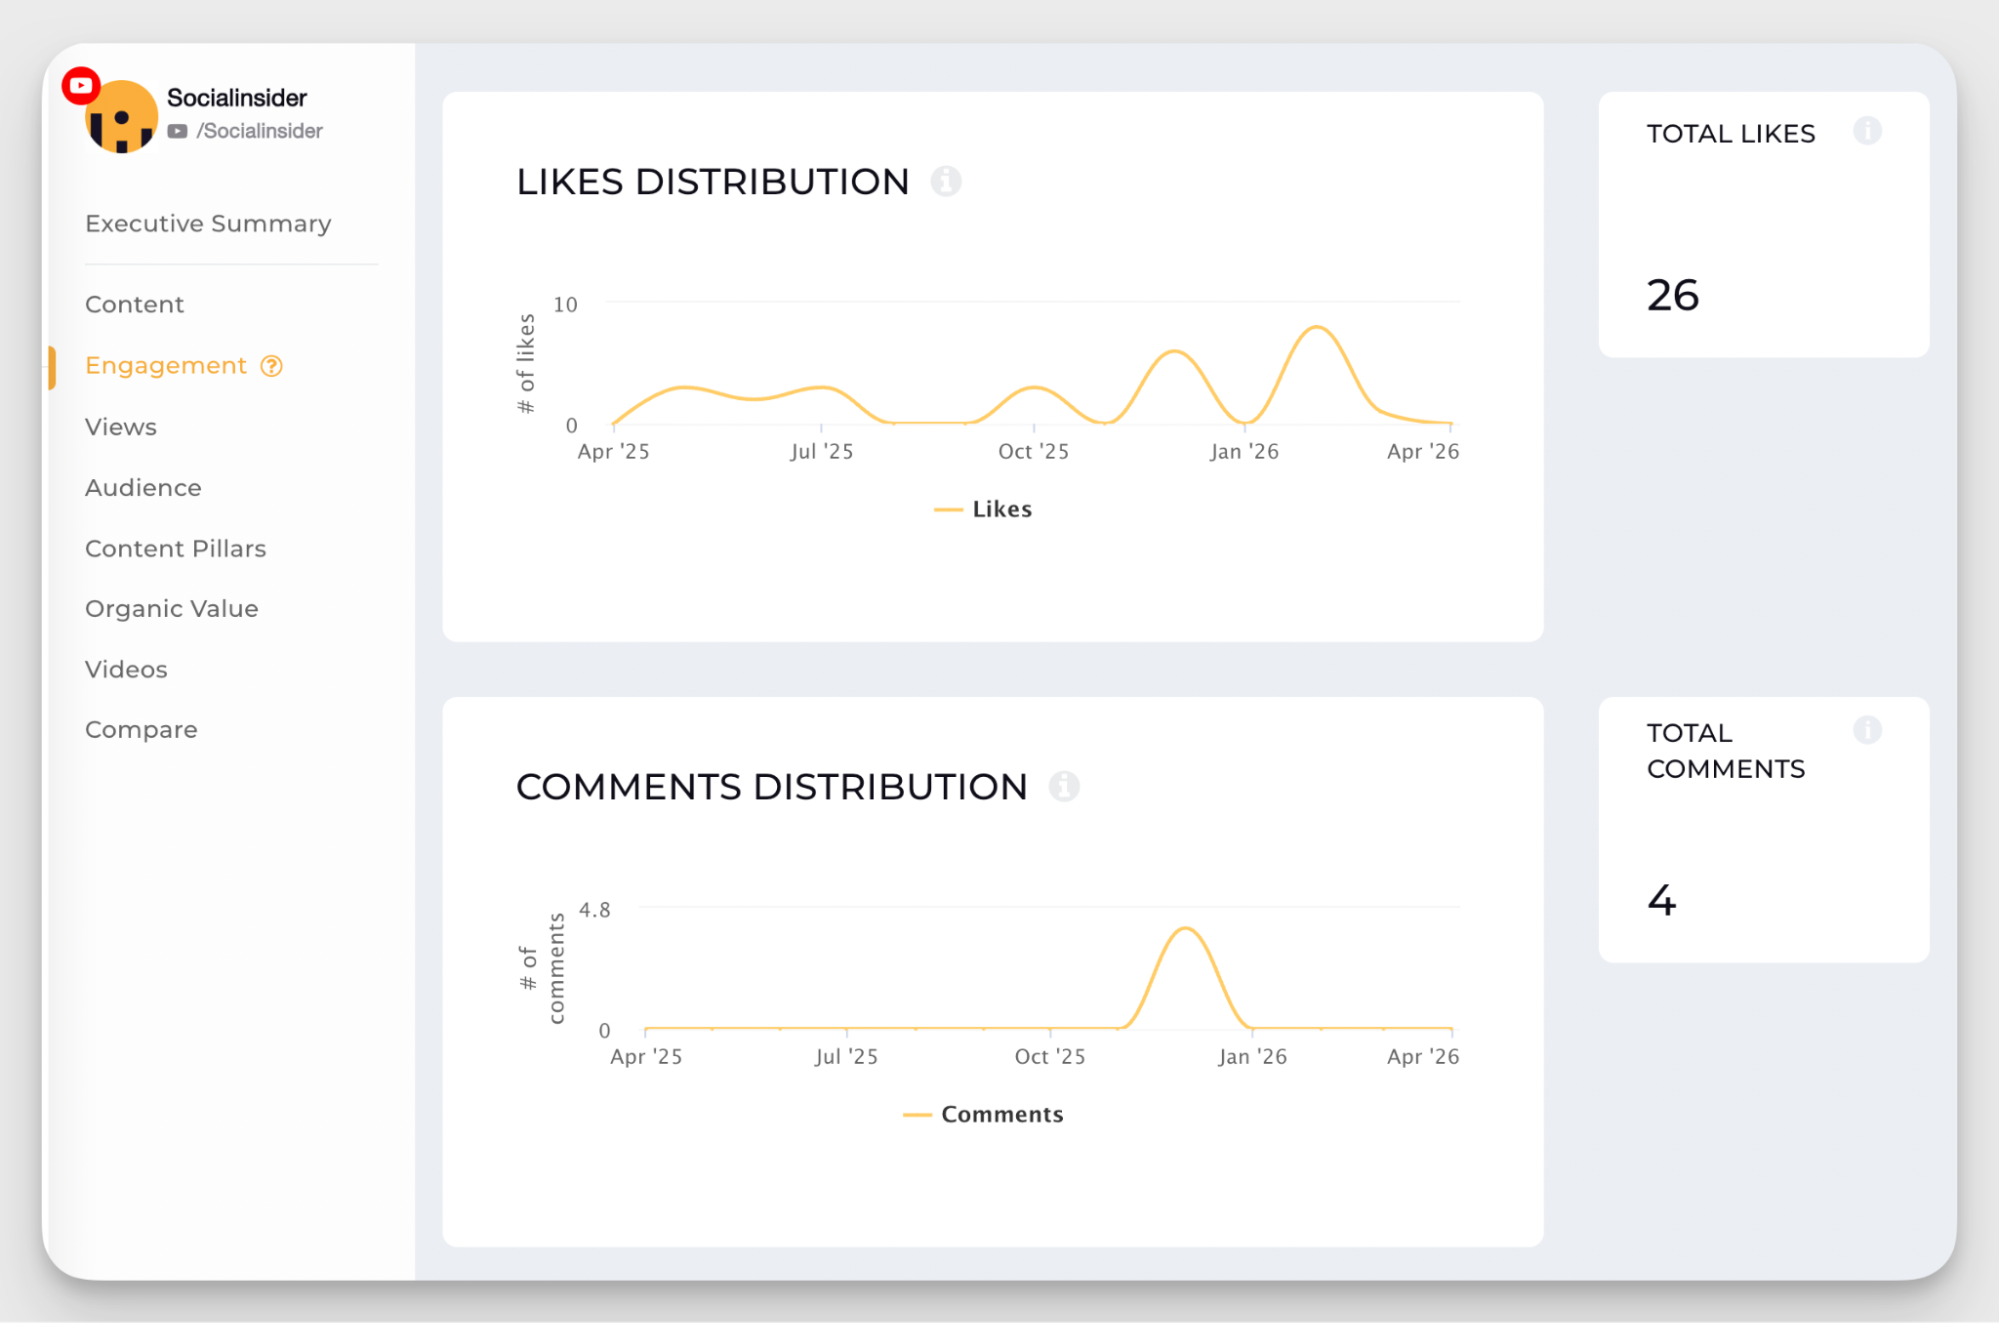
In this example from Socialinsider, we can see that likes remain relatively consistent while comments spike sharply at one point in the timeline. This usually happens when a video triggers a stronger-than-average audience reaction.
Unlike passive interactions, comments require viewers to actively participate in the conversation, which often makes them a stronger indicator of audience investment.
Shares reveal something slightly different.
When viewers send a video to coworkers, communities, or friends, they’re essentially validating the content’s usefulness or relevance.
Over time, tracking comment and share patterns helps you identify which videos naturally generate discussion and organic amplification.
- Top videos and content content pillars
After tracking engagement patterns for a while, you’ll usually notice that certain types of content consistently outperform others. And that’s often the starting point for identifying your strongest content pillars for social media.
Using top YouTube analytics tools like Socialinsider makes this process much easier because you can compare engagement across recurring themes instead of analyzing videos one by one.
In the example below, for our channel “Tech Reviews & Comparisons” generates the highest share of total engagement across the channel. That kind of distribution matters because it reveals a clear audience preference toward comparison-driven and evaluation-style content.
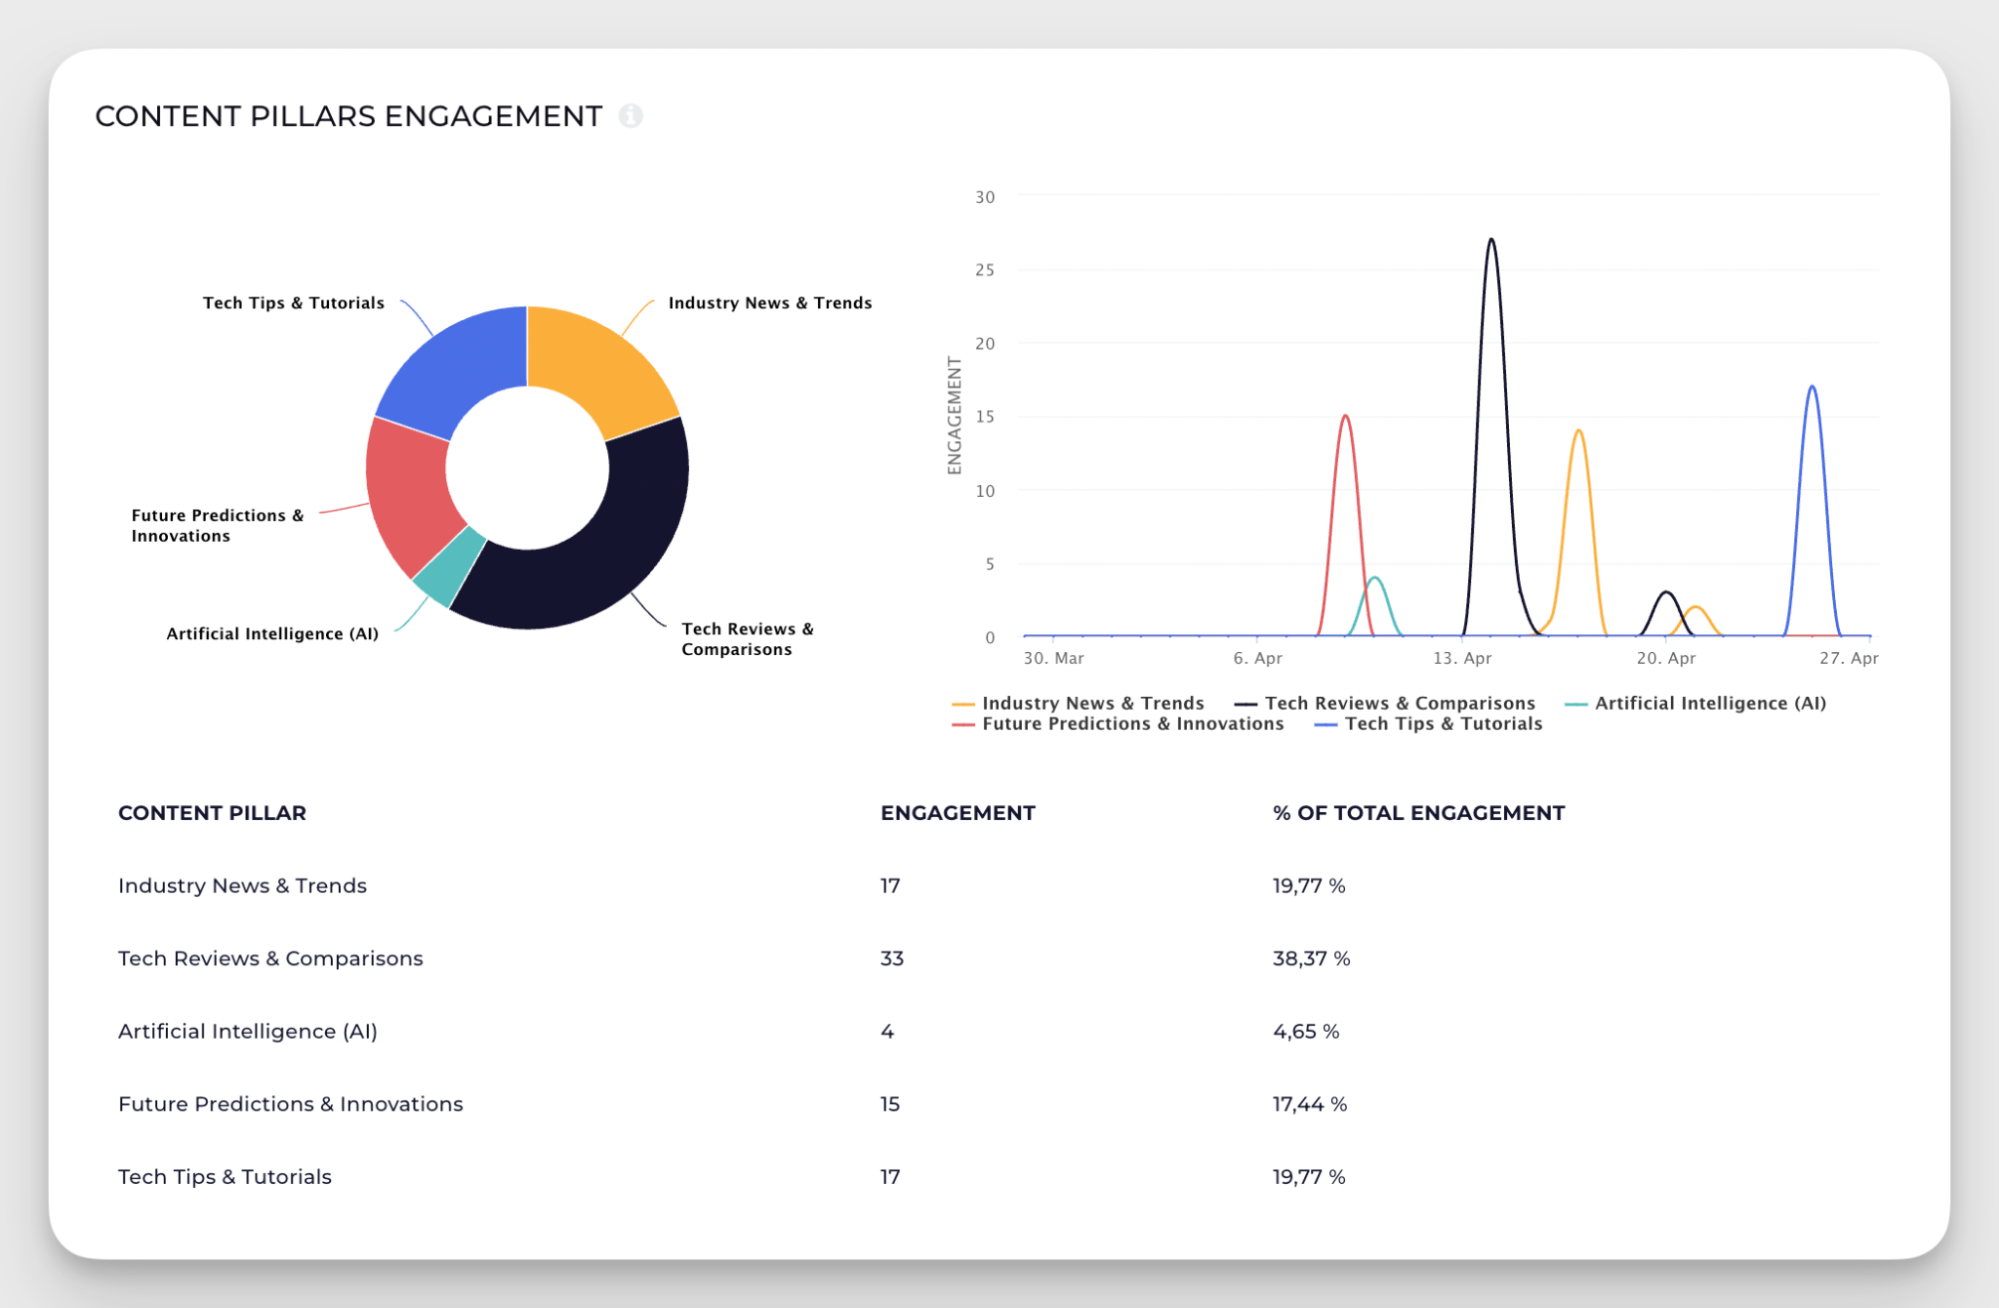
Insights like these help shape smarter content decisions over time.
You can identify which topics deserve more investment, which formats could evolve into recurring series, and which categories may attract visibility without generating meaningful interaction.
Retention metrics
Retention metrics tend to be the most honest part of YouTube analytics.
A video can generate strong reach, solid CTR, and decent engagement, then lose most viewers within the first minute.
Among all YouTube channel performance metrics, retention does the best job revealing whether the content actually sustains attention after the click happens.
- Average view duration vs. average percentage viewed
The two metrics worth analyzing together are average view duration and average percentage viewed.
Average view duration measures how much time viewers spend watching, while average percentage viewed shows how much of the video they completed relative to its length.
The relationship between the two is what makes retention social media analysis useful.
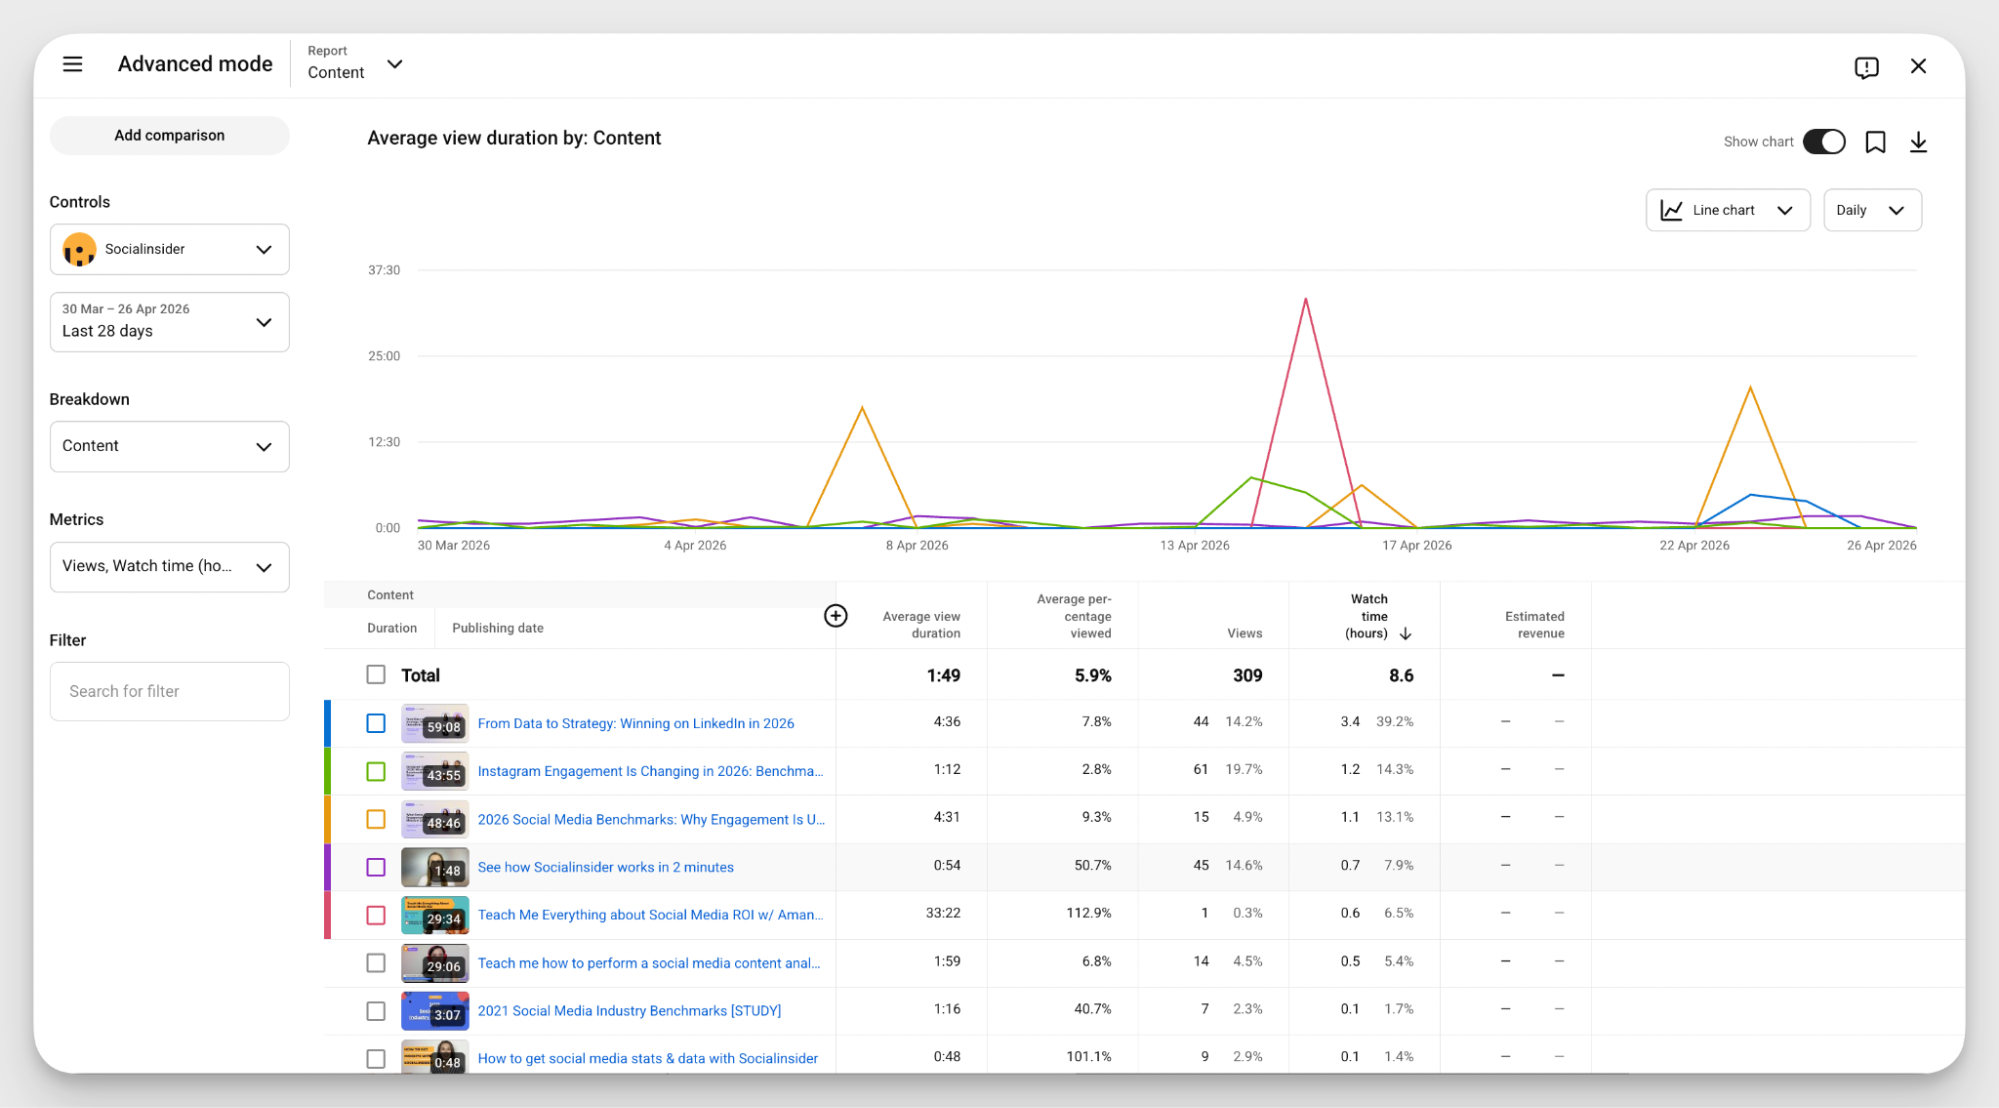
In the example above, we can see that longer videos generate more total watch time but lower completion percentages, while shorter videos retain a much larger portion of viewers.
That pattern usually points to pacing and structural differences rather than topic quality alone.
I like using retention data to pinpoint where the viewing experience starts losing momentum.
- Early drop-offs often suggest weak intros or delayed value delivery.
- Mid-video dips can reveal repetitive sections, slow transitions, or pacing issues.
- Strong retention around certain moments usually highlights hooks, formats, or segments worth repeating in future videos.
Short-form and long-form content also behave differently here.
YouTube Shorts depend heavily on immediate curiosity, fast pacing, and quick payoff because viewers can swipe away instantly. Long-form videos rely more on progression, structure, and maintaining momentum across multiple sections.
But remember. Retention analysis becomes much more valuable once you stop treating it like a completion metric and start using it to evaluate how content structure shapes audience behavior.
Growth metrics
Last but not least, growth metrics.
Strong reach and engagement can make a channel look healthy on the surface while audience loyalty quietly stagnates underneath.
Growth-focused YouTube performance metrics help separate temporary attention from long-term momentum and show whether viewers are actually building an ongoing relationship with the content.
- Subscribers gained/lost: reading the signal behind the trend
I rarely treat subscriber growth as a vanity KPI on its own. The more interesting question is what triggered the movement.
Subscriber spikes usually happen when a video delivers enough relevance, trust, or consistency for viewers to want ongoing access to the content.
Drops tend to reveal friction instead. Maybe the topic attracted the wrong audience, expectations didn’t match the actual video, or the channel drifted too far from what viewers originally subscribed for.
One-off viral moments can create temporary jumps. But consistent subscriber growth usually reflects stronger audience alignment over time.
- Returning vs. new viewers: what the ratio reveals about content strategy health
This is one of the fastest ways to understand whether a channel is driven more by discovery or loyalty.
In the example below, the balance between returning and new viewers immediately adds context to overall performance.
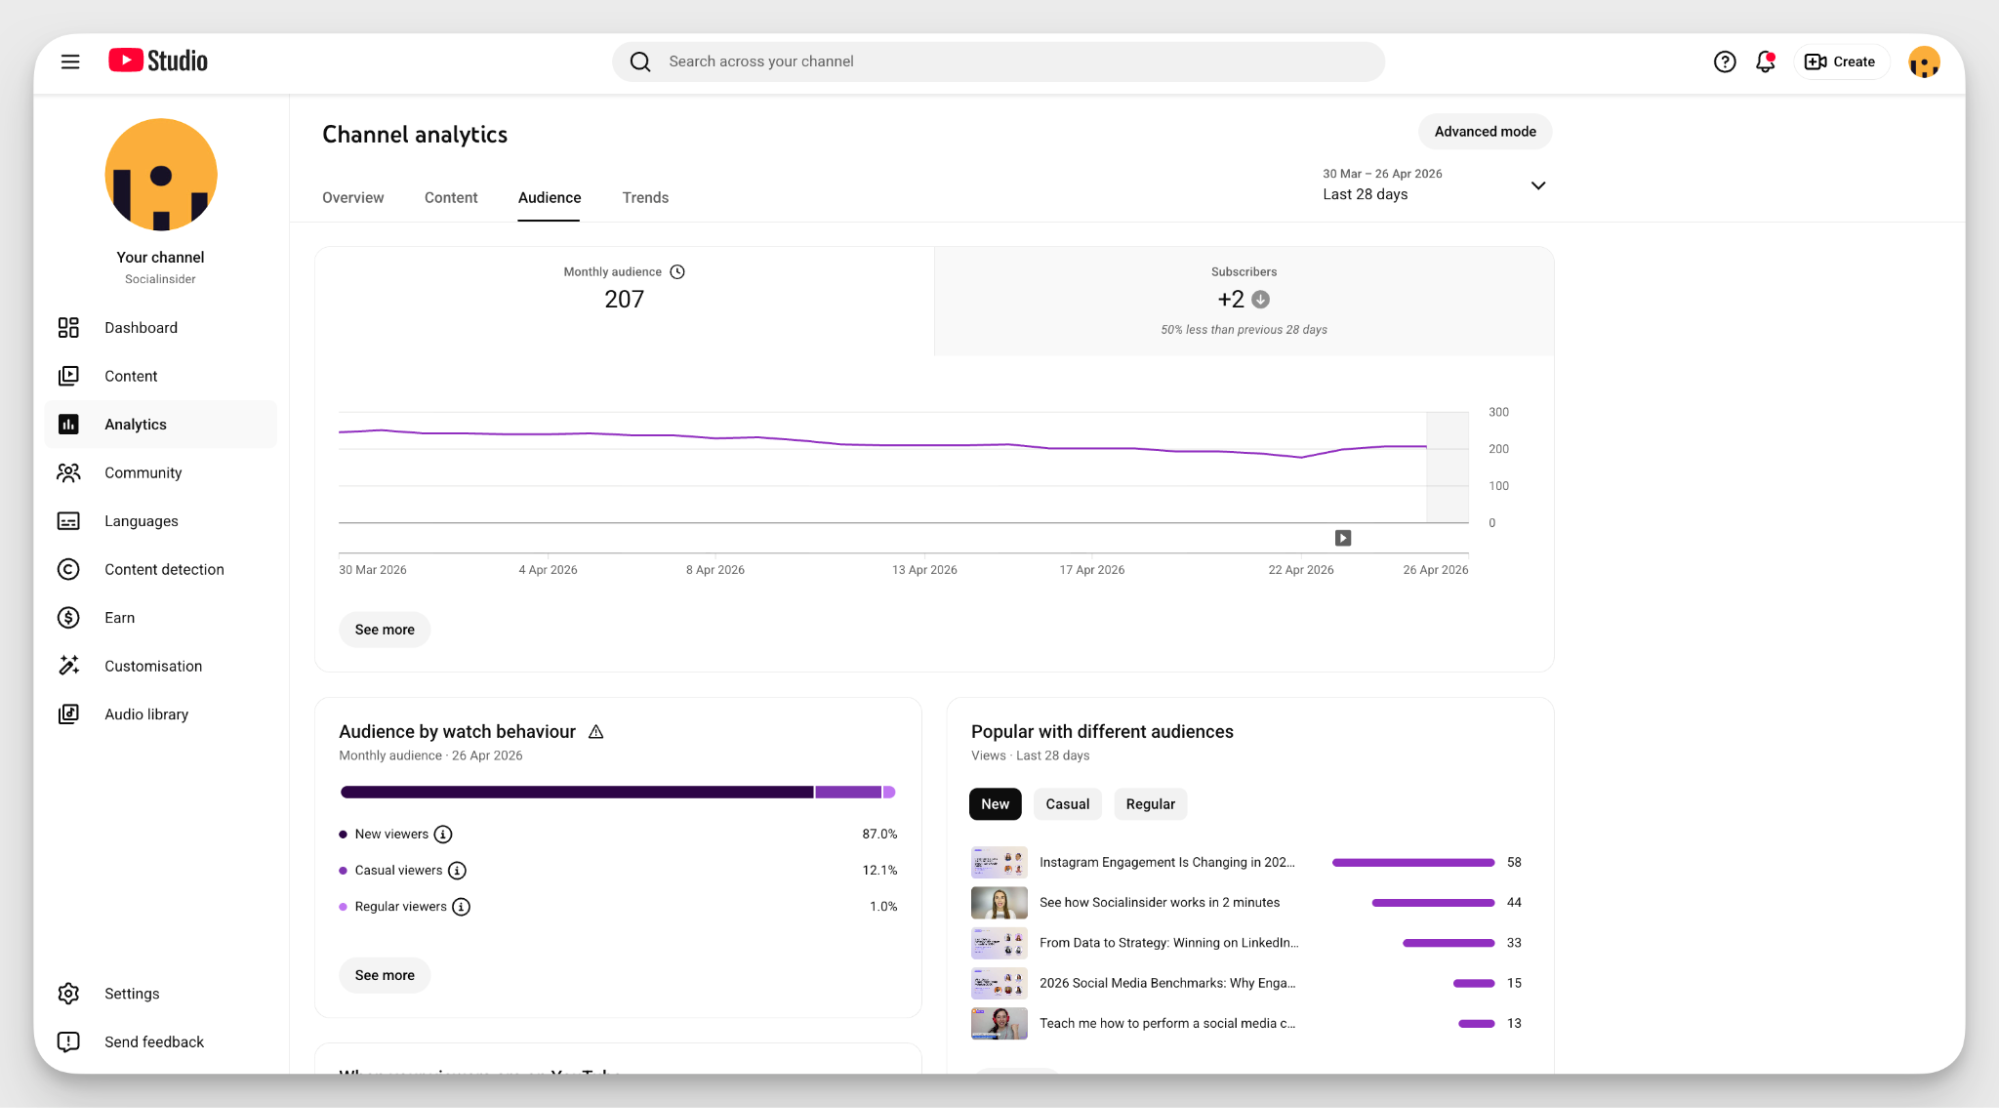
New viewers signal that YouTube is still expanding reach, while returning viewers show that the content experience was strong enough for people to intentionally come back.
Channels dominated by new viewers often grow visibility quickly but struggle to build long-term connection. The opposite can happen too: highly loyal audiences paired with weak new discovery can slow future growth momentum.
- Unique viewers vs. total views: diagnosing virality vs. loyalty
This comparison changes how you interpret performance entirely.
High unique viewers usually point toward broad discovery and reach-heavy distribution. When total views significantly exceed unique viewers, repeat viewing becomes part of the story. Viewers are rewatching, binging, or repeatedly returning to the same videos.
Personally, I find this one of the clearest ways to distinguish visibility from audience attachment. Viral reach attracts attention. Repeat viewing signals stronger viewer connection.
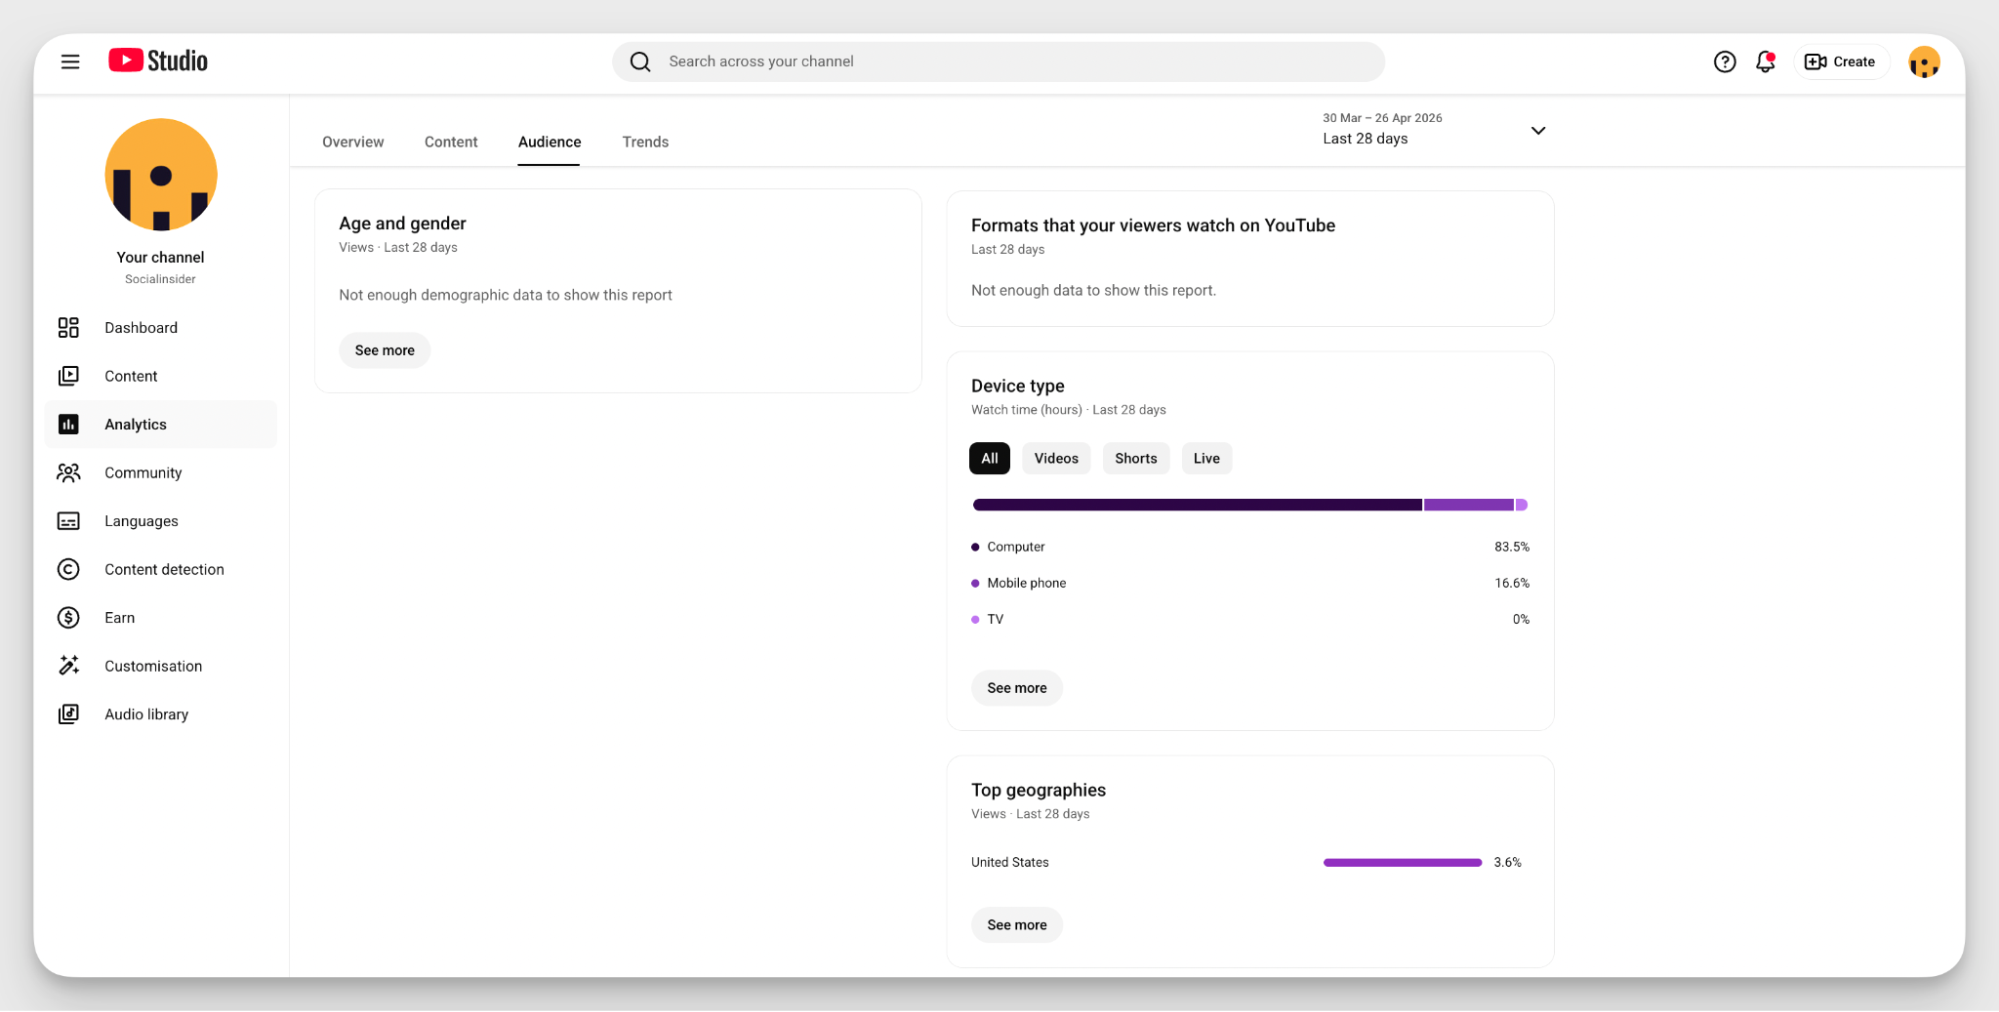
- Demographics (age, gender, geography, devices): tailoring content to your actual audience
Collection demographic data can feel less exciting than reach or engagement metrics.
In practice, though, it heavily influences content decisions.
The example below makes this easier to visualize by connecting audience segments directly to viewing behavior.
And sometimes the audience engaging most with the content isn’t the audience the channel originally intended to target.
Those patterns should influence everything from editing pace and publishing windows to topic framing, thumbnail readability on mobile, cultural references, and even preferred video length.
Good growth analysis is about understanding which audiences are growing. And whether your content strategy is building the type of community you actually want long term.
How to benchmark your YouTube metrics analytics against competitors?
Looking at your own analytics only tells part of the story.
Performance starts making much more sense once you compare it against channels competing for the same audience attention.
For this kind of YouTube competitor analysis, I usually use benchmarking and analytics tools such as Socialinsider. They make it easier to compare channel performance side by side instead of manually tracking dozens of metrics across multiple dashboards.
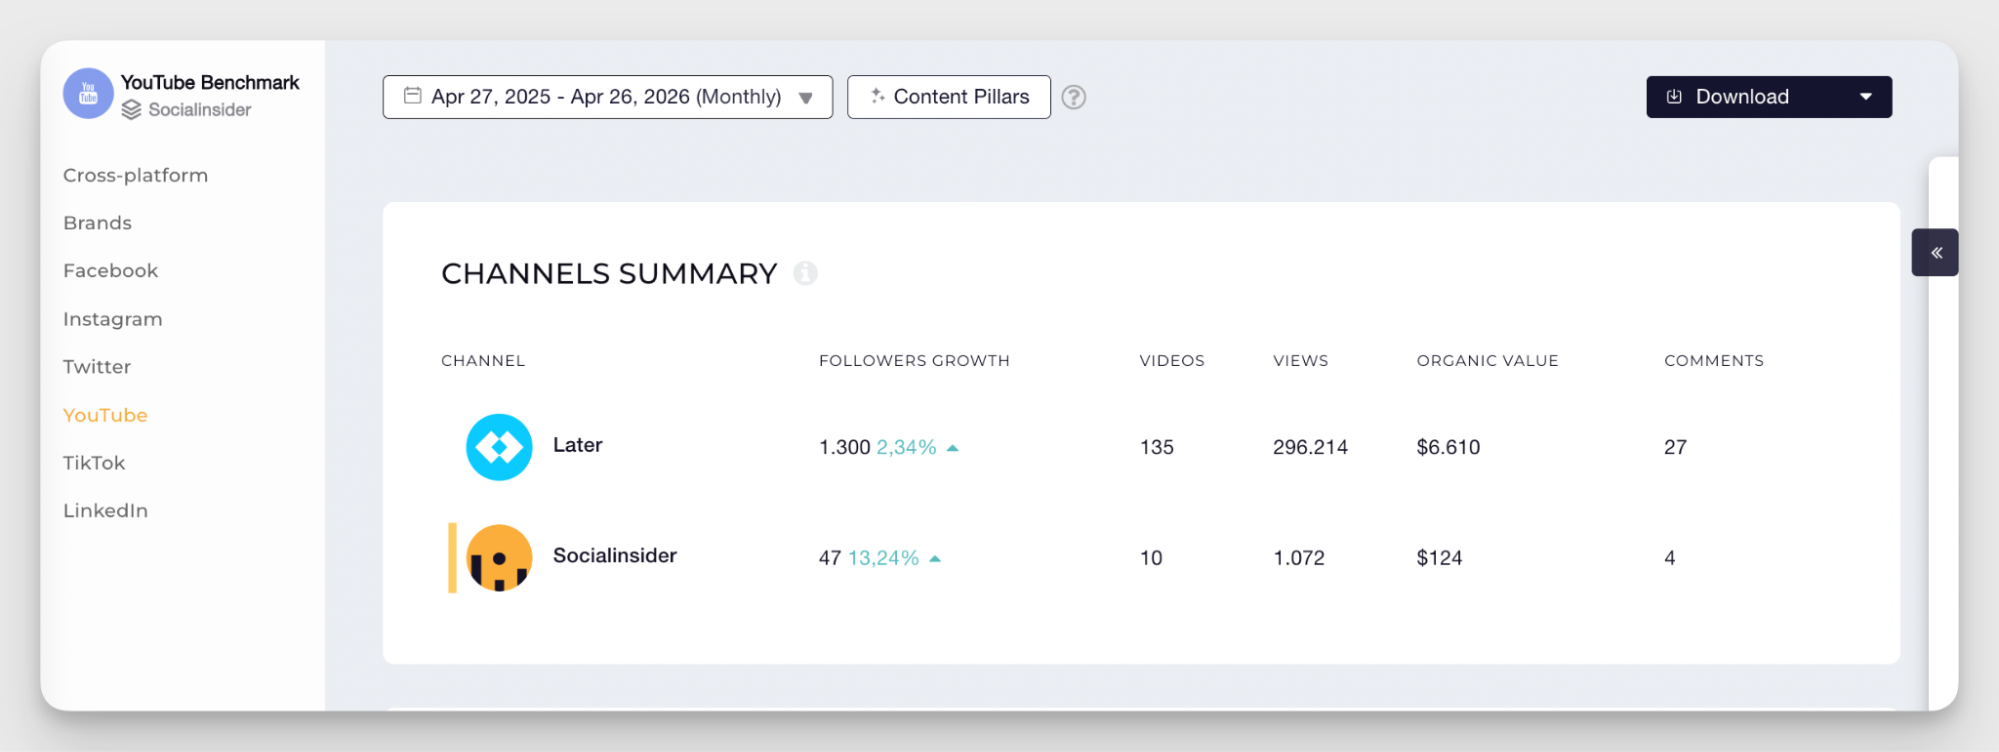
The comparison view below focuses on operational signals like posting cadence, follower growth, engagement, views, and estimated organic value.
Looking at these together helps uncover how competitors generate momentum. Some channels grow through consistency and publishing frequency. Others post less often but create stronger engagement per video.
The content pillar breakdown adds another layer of insight by revealing which topics and formats consistently generate the highest engagement across competing channels.
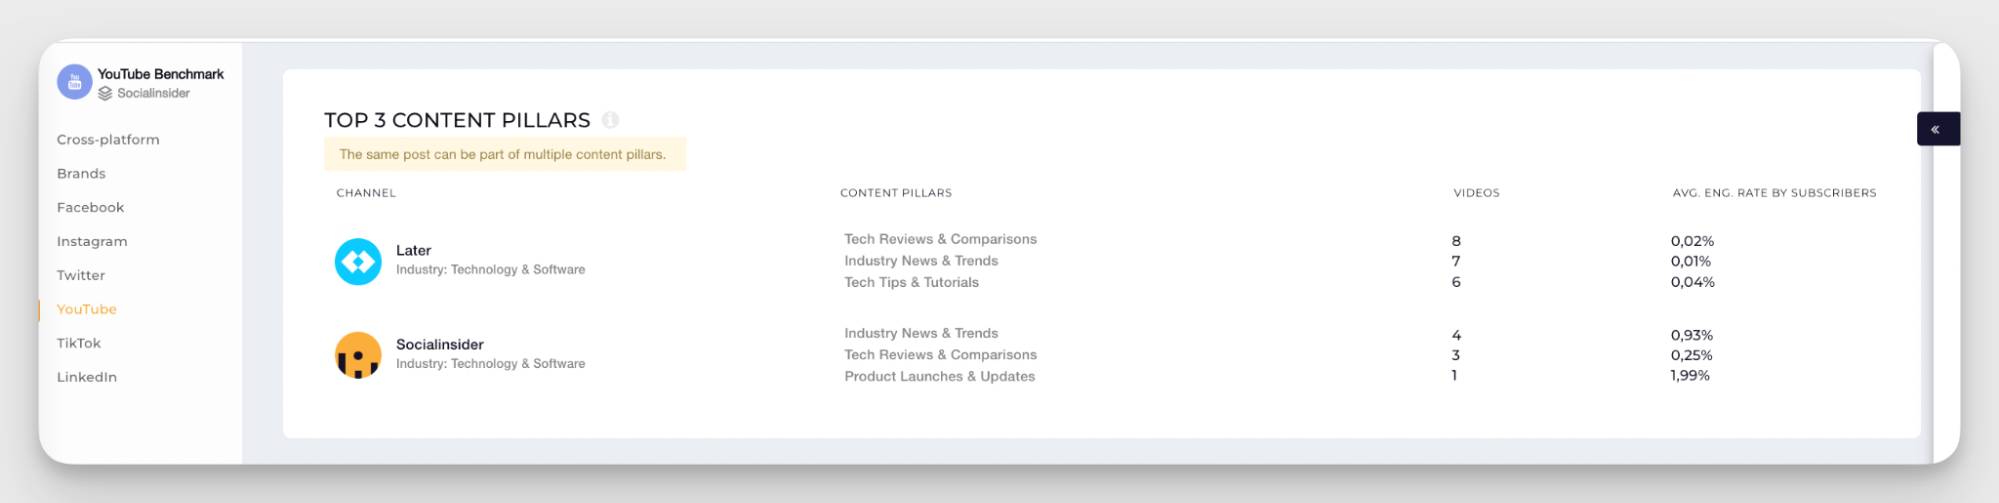
This type of content competitor analysis is especially useful for spotting themes competitors repeatedly invest in, underused topics in the niche, and gaps worth turning into future content opportunities.
Used properly, YouTube analytics for other channels can reveal far more than who gets the most views.
It helps validate audience demand, refine editorial direction, and support smarter social media optimization decisions based on actual market patterns instead of assumptions.
Among the most effective competitive analysis techniques and best practices for benchmarking social media competitors, the most valuable insights usually come from identifying repeatable patterns, not copying individual viral videos.
Final thoughts
The more time I spend inside YouTube analytics, the more I pay attention to patterns.
A single viral video can inflate views for a week. Consistent audience behavior is what actually shapes long-term growth.
So instead of optimizing for every fluctuation, focus on the signals that repeat: the topics viewers return to, the formats that hold attention, and the content patterns that audiences consistently respond to over time.
Anda Radulescu
Content writer & copywriter with a 5-year track record in digital marketing. Equal parts keen observer & committed go-getter. A proud cat mom with a passion for music & exploring the world.

Know what your competitors do — before your manager asks
Get instant social benchmarks & reports without manual work.