Top-tier social media analytics platform that brings clarity to the chaos
Get valuable insights from social media analytics data and turn them into attention-worthy content. Leverage data-driven decisions whenever crafting a social media strategy.
Leader in Social Media Analytics Category
High Performer social media analytics tool for brands and businesses.


Social media data analysis
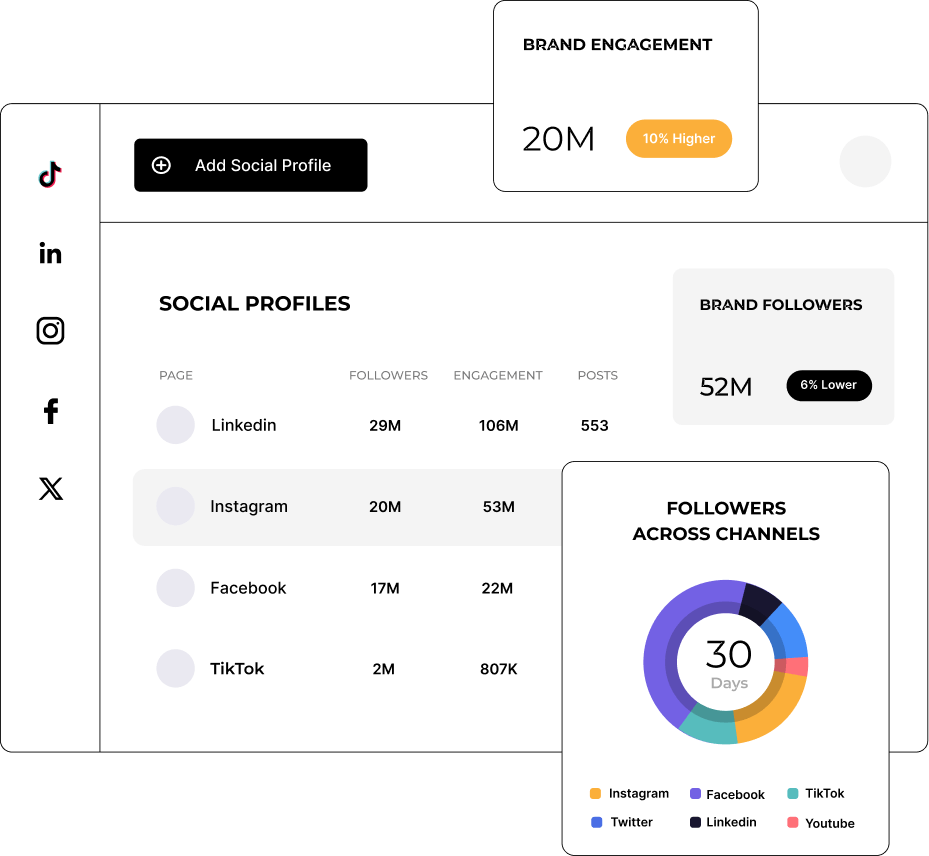
Gain insights into your channels’ performance
Get essential social media analytics reports to understand if your current social strategy is effective in achieving the business goals.
Use Socialinsider’s social media analytics tools to see how your brand’s performance has evolved over time. Monitor metrics such as engagement, reach, impressions, followers' growth, and more to identify your best-performing channels.
Competitive insights
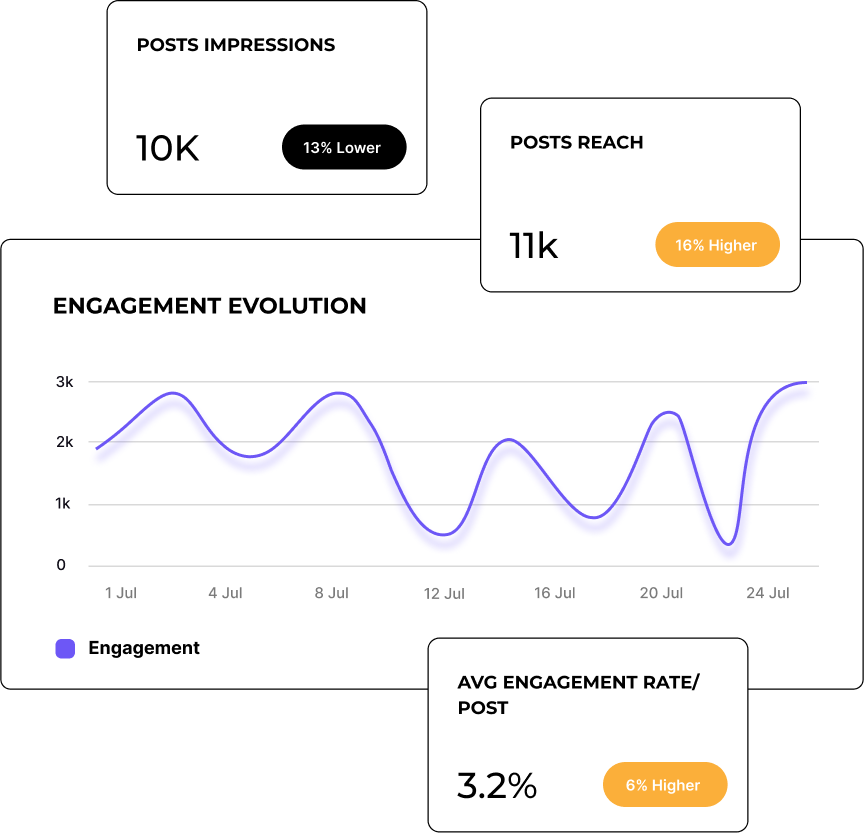
Add competitive context to your analysis
Compare your performance against your competitors on various KPIs such as engagement rate, follower growth, and categorize their content based on keywords or hashtags.
Use the best social media competitor analysis tool to identify gaps in your own strategy.
Posts analytics
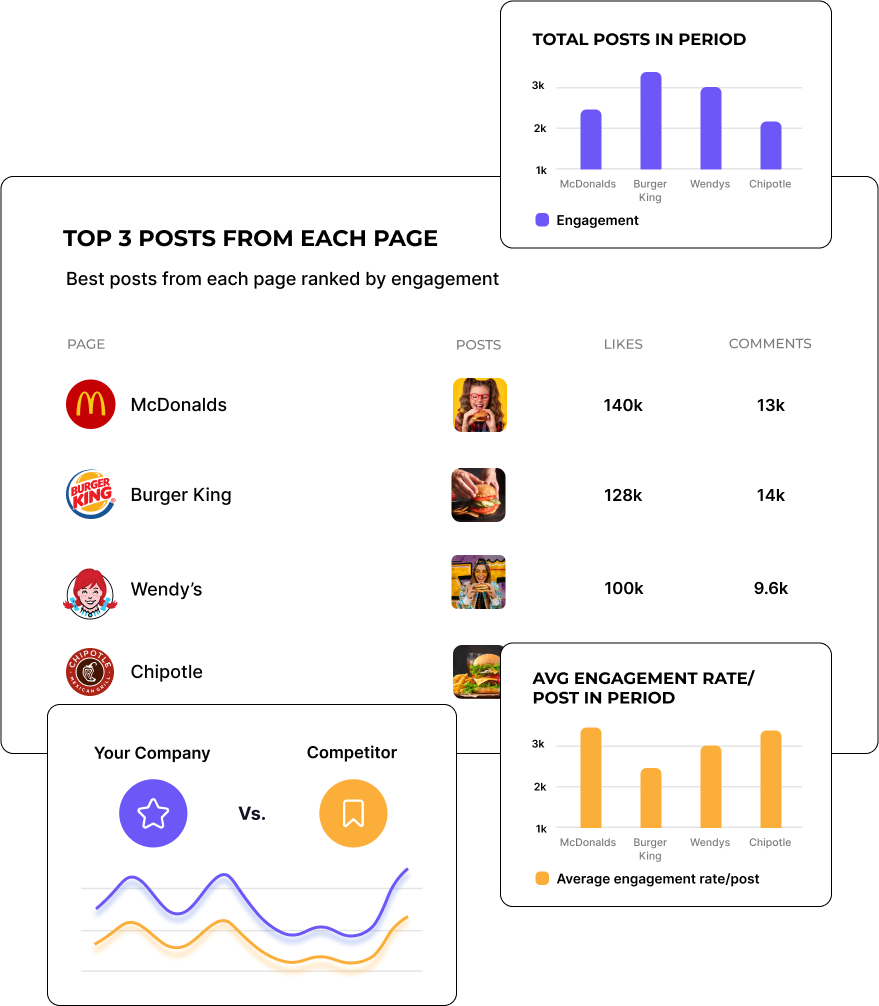
Identify your best-performing social media content
Improve your content strategy by getting detailed post analytics that will show you what the best contet formats for different categories are.
Look at social media post analytics to understand what’s working and what’s not and gain insights into how to improve your social media strategy.

“ Simplified and straightforward social media analytics for busy social media people.“
Declan Seachoy,, Digital Communications Officer at the Trades Union Congress

Social media campaign analysis
Analyze social media content based on keywords or topics
Dive deep into the social media analytics dashboard to find out how your social media content performs on multiple social networks.
Use Socialinsider’s social media analytics tool to categorize social media content based on keywords and see what your most successful creative concepts are.
Cross-channel analysis
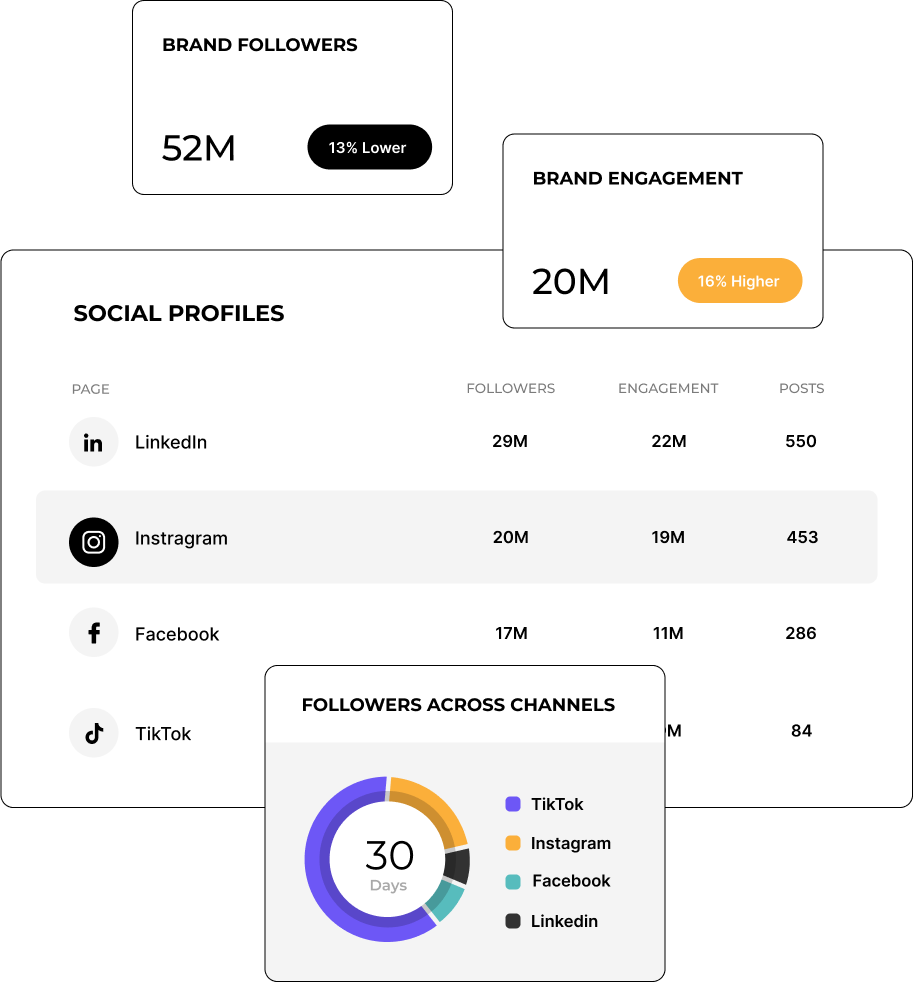
Compare brand’s social media analytics reports
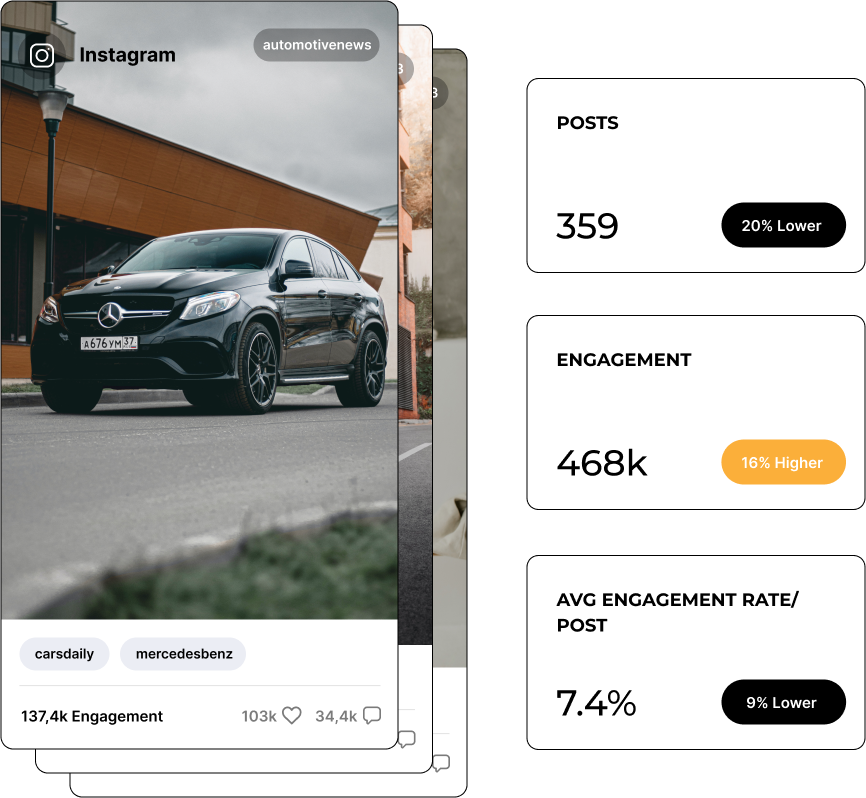
Identify opportunities for strategy improvements. Use cross-channel social media analytics to make data-based optimization decisions to refine your budget and social media results.
Understand which is your best-performing channel by running an in-depth social media analysis across multiple social platforms.
Social media analytics reports
Get analytics reports for social media
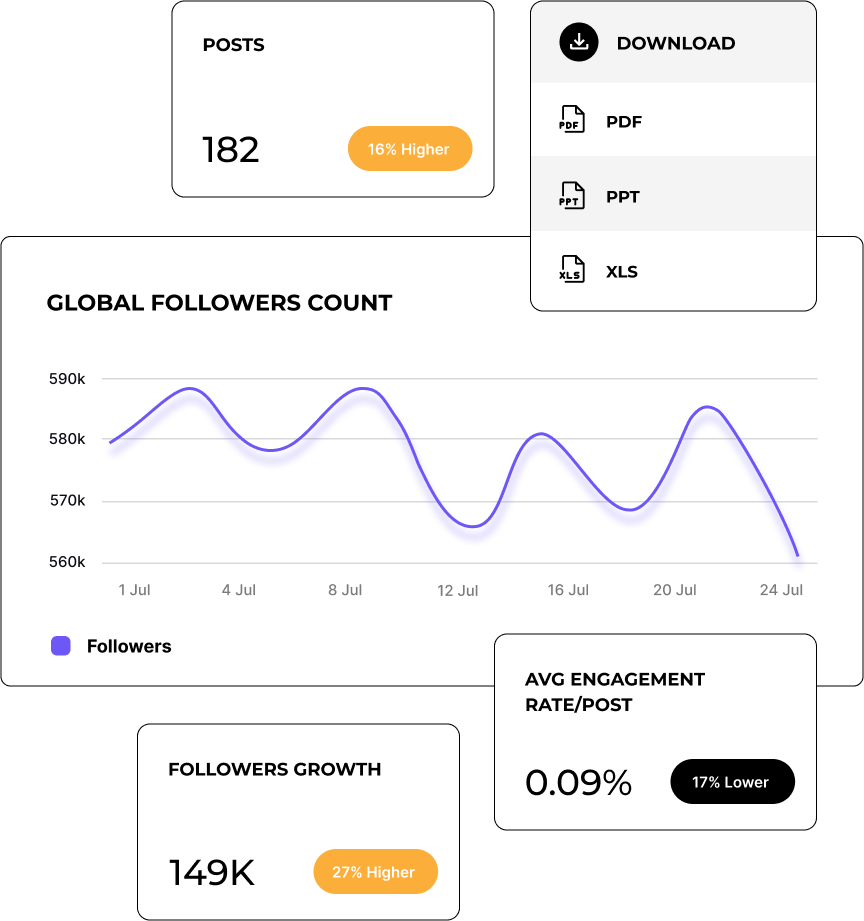
Export social media data and power up your reporting with extended social media analytics tools, including campaign social media analysis and competitive benchmarks.
Get white-label social media reports and show your social media KPIs using the format that works for you.
Analyze social media performance with Socialinsider
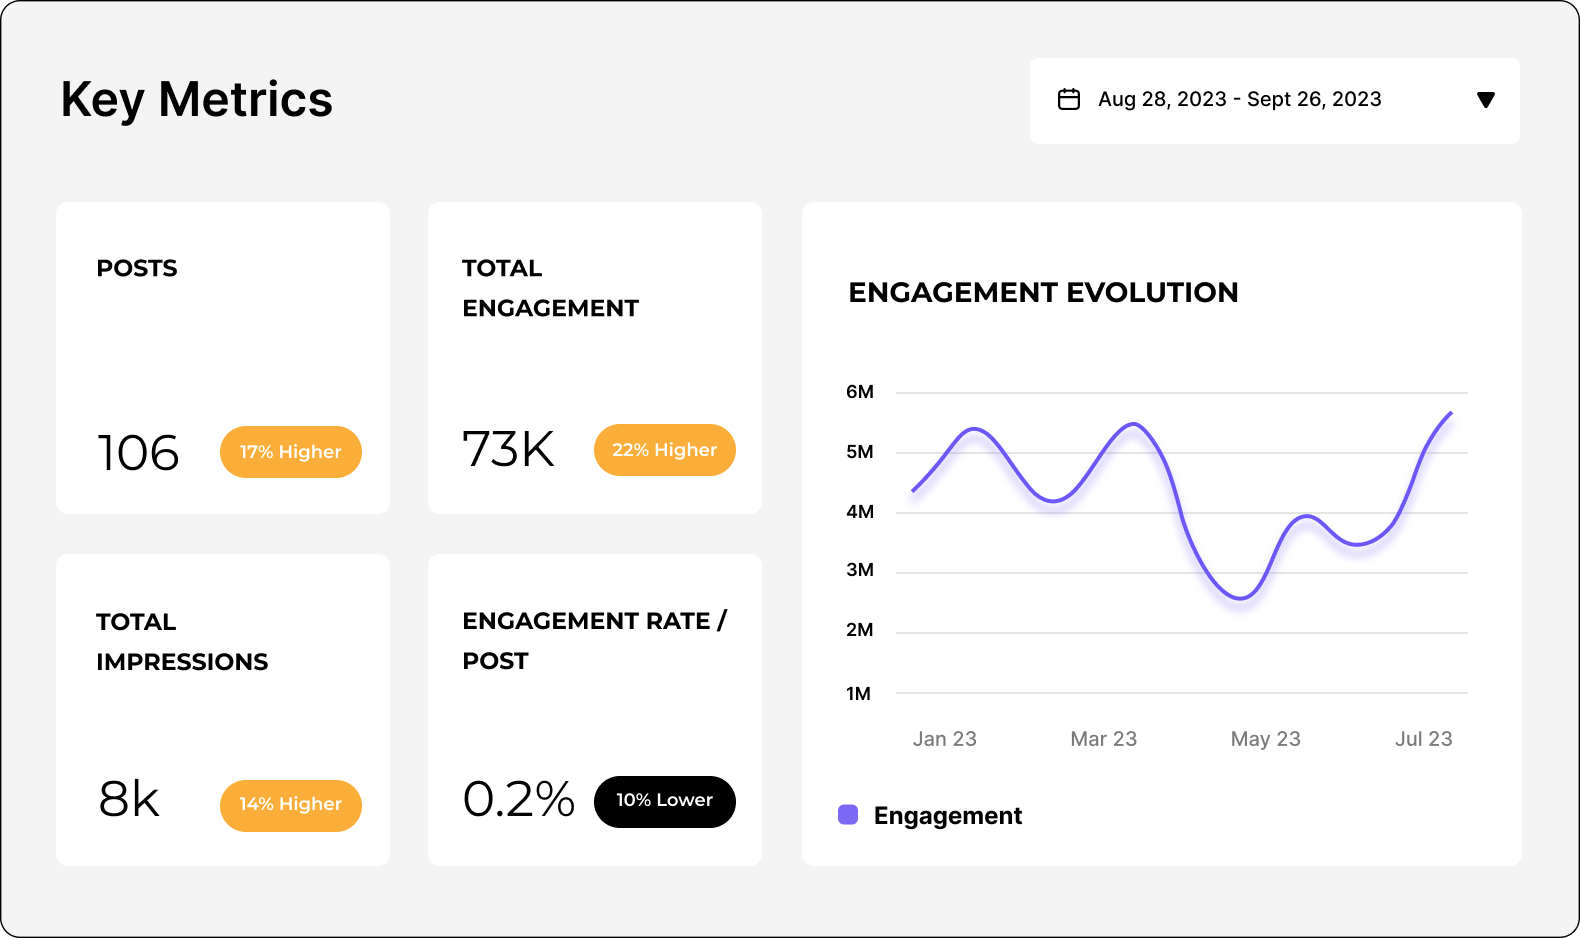
Sociainsider’s social media analytics, competitors analysis tools allow you to measure social media performance, run audits, and compare performance.

Start by creating a trial account to Socialinsider

Add your competitors and connect the profiles you manage

Get all the engagement metrics for any social media business account

Compare your performance against your top competitors

Perform a cross-channel analysis to evaluate your social media performance.
Get competitive insights and explore social media analytics metrics

Competitor analysis and benchmarks
Perform a detailed competitor analysis to gain insights on industry trends and best practices.
View more

Social media analytics and reports
Get the best social media dashboard to analyze your social media performance and gain a competitive advantage
View more

Posts tagging
Automatically tag social media posts based on keywords or topics. Get insights about different content pillars’ performance and optimize your strategy based on the results.
View more

Social media data integration
Leverage large social media data sets to add more value to your products and increase your business.
View more
What they say about us
"Customer service has been one of my favourite features as well. You guys are just phenomenal. Your team is so responsive and very friendly and helpful. Which is not the norm."
Caitlin Duffy Roisin Consulting

"Socialinsider helped us understand whether we're improving or decreasing especially compared to the other accounts that we follow."
Declan Seachoy Trades Union Congress

"Socialinsider allows for a competitor analysis that gives an insight to performance relative to the market."
Victor Mukubvu Mitsubishi Electric

"The sentiment analysis is amazing for Instagram hashtags. This new social media listening dashboard helped me in long-term planning."
Giuseppe Veturi Havas Media Network

"We are using this social media analytics dashboard for all our 40 social media clients. We can have all the performance data in one single place."
Arnold Vieriu Tribal Worldwide

"With Socialinsider, our team became more efficient. We do not need to spend time on social media data gathering. Instead, we can focus on insights and analysis."
Yana Bushmeleva Fashionbi

"We use Socialinsider for day-to-day social media insights if we need to outline any simple strategic changes or review the performance of certain social posts."
Nick Radclyffe CEO at Hype Lab

"On average, a social media report for a brand requires 1 to 2 hours of work with Socialinsider, where it used to require a full day to gather the data."
Dorra Lunet Hanging Gardens Agency

"Socialinsider has saved us more than $16k per year. It has enabled us to save time on monthly reports and complex long-term analyses."
Mohamed El-Daly Create Media

Frequently Asked Questions
Got a question? We've got answers.
What is social media analytics?
Let’s face it, social media marketing can feel like a mess—and a minefield. There are always fresh trends, content types and even whole new platforms bursting onto the scene. Exposure to huge audiences can be a blessing or a curse, with a potential PR crisis just a misguided click away.
That’s where social media marketing analytics come in.
Social media analytics refers to the process of collecting and analyzing data from social media platforms like Facebook, Instagram, Tik Tok, LinkedIn, X (formerly Twitter) and YouTube. Marketers and business owners can use social media analytics and reporting to cut through the noise and reveal insights about their brand and content performance.
The right data can tell you everything you need to know about your audience, the competition, the wider market, platform trends, and the success of your content and tactics. You can understand who you’re speaking to and how they behave, what performs and what doesn’t. Then optimize your strategy accordingly.
By using social media analytics effectively, you’ll be able to take control of the mess, and gain clarity and confidence in your social media marketing efforts and investments.
Why do marketers need to track social media analytics?
The importance of social media analytics is primarily down to the time, money and effort that goes into running a business account. When you’re investing precious resources into a marketing strategy, you want to make sure they’re well spent.
Marketers need to prioritize social media analytics and reporting to get a clear picture of what is and isn’t working for their business. This helps you make smart decisions, refine strategies and ultimately achieve stronger results.
Now, if data isn’t your strong point, you might be wondering how necessary social media analytics really are to your strategy. After all, most viral content depends on sheer creativity. Isn’t the recipe for success simply intuition mixed with a bit of luck?
Well, only to an extent. The reality is that social media platforms are built on algorithms, which are built on data. So to master the algorithm, you need to understand the data.
Getting a handle on social media data tracking will help you:
- Measure brand performance - evaluate successes and failures, track ROI.
- Understand audience behavior - who are they, what content do they engage with, when are they most active?
- Analyze content and trends - identify content that yields results and trends that could move the needle.
- Assess competitors - benchmark your performance against theirs and spot gaps or opportunities.
- Forecast trends - keep abreast of platform updates and trends, monitor relevant topics and conversations.
Simply put, you can see which social media platforms work best for your brand, which campaigns are most or least effective, and which content earns the highest visibility engagement.
These insights will empower you to make data-driven decisions for your strategy: on resource allocation, budget management, fine-tuning campaigns, and prioritizing cost-effective platforms and tactics.
Remember, social media holds huge potential:
- 43% of customers discover new products through social media
- 66% of customers purchase after seeing a social post
So don’t leave it on the table! Marketers who center analytics in their social media reporting are much more likely to invest wisely, keep stakeholders happy, hone skills and build expertise.
What are the types of social media analytics?
There are several different types of social media analytics, which can largely be grouped into: descriptive analytics, diagnostic analytics, predictive analytics, prescriptive analytics, real-time analytics, competitor analytics, sentiment analytics, influencer analytics, content analytics and audience analytics.
Within each category, there are key metrics (remember, analytics is interpreting data to spot patterns, gain insights and make strategic decisions; metrics are the raw data).
If this feels like a lot to digest, don’t worry—it’s really quite straightforward. Here’s a short social media analytics guide to walk you through the different categories:
What are descriptive analytics?
Descriptive analytics are defined by past data. By summarizing metrics such as followers, likes, shares, comments and impressions, you can create a performance analytics report for specific time-frames, so you can track both short-term and long-term growth.
Examples of descriptive analytics:
- Engagement metrics: likes, shares, retweets, comments
- Audience growth: the rate at which you’re gaining/losing followers
- Content performance: high-performing or low-performing posts
What are diagnostic analytics?
Diagnostic analytics dig into the root cause of certain events or results in your social media reporting. You can identify concrete reasons for success or failure, rather than feeling like you’re shooting in the dark.
Examples of diagnostic analytics:
- Engagement rate analysis: determining why certain posts get higher or lower engagement—formats, topics, time of posting?
- Sentiment analysis: identifying causes of particular reactions (positive, neutral, negative).
- Trend analysis: spotting patterns to work out why some content types or themes have taken off.
What are predictive analytics?
Predictive analytics draw from existing data and past performance to forecast future trends or outcomes. They can give you a greater sense of control over the often unpredictable social media landscape, so you can proactively prepare for risks or or capitalize on areas for growth.
Examples of predictive analytics:
- Engagement forecasting: anticipating how future posts might perform based on previous engagement.
- Audience growth projections: estimating future follower growth based on current rates.
- Trend predictions: identifying potential viral content or emerging trends to jump on.
What are prescriptive analytics?
Prescriptive analytics go one step further than predictive analytics by actively suggesting actions to take. These recommendations are based on existing data and designed to enhance your performance.
Examples of prescriptive analytics:
- Content strategy recommendations: content types or best times to post for optimal reach and engagement.
- Targeting adjustments: audience segments to focus on in your campaigns.
- Resource allocation: where to allocate marketing spend across different social media platforms for maximum ROI.
What are real-time analytics?
Real-time analytics track and analyze live data, so you can monitor campaigns or respond to events as they are happening. By keeping an ear to the ground, you can quickly make changes or tap into momentum.
Examples of real-time analytics:
- Live campaign monitoring: track the performance of a campaign or live event to make on-the-fly tweaks.
- Crisis management: watch out for brand mentions and track sentiment to address any PR issues immediately.
- Social listening: observe conversations about your brand, product or industry as they unfold.
What are competitor analytics?
Competitive social media analytics share data on competitors’ social accounts and activities—or simply brands you admire. This helps you benchmark performance, identify opportunities for growth based on rivals’ strengths or weaknesses, get ideas and inspiration for your content, spot industry trends, and anticipate next steps.
Examples of competitor analytics:
- Comparative engagement analysis: see where your engagement metrics rank against the competition.
- Content strategy comparison: analyze what competitors are posting and how it’s performing.
- Market positioning: use a competitor analysis report to understand how you are perceived in your category.
What are sentiment analytics?
Sentiment analytics monitor emotions and opinions in social media interactions to gauge how people feel about your brand. This helps you understand public perception and customer satisfaction, so you can amplify positive feedback, address any concerns, and protect your brand reputation.
Examples of sentiment analytics:
- Sentiment score: a net score of how positively, negatively or neutrally people feel about your brand.
- Sentiment tren analysisd: tracking changes in sentiment over time, especially after significant events or campaigns.
- Customer feedback analysis: assess the sentiment of reviews or comments to feed into your product development.
What are influencer analytics?
Influencer analysis pulls and interprets data from influencer profiles and campaigns. This gives you a steer on which influencers to approach for collaborations, and the impact of campaigns you work on.
Examples of influencer analytics:
- Influencer identification: finding relevant influencers with demonstrated traction for campaigns and collabs.
- Campaign impact: measure reach, engagements and conversions generated by influencer campaigns.
- Influencer ROI: calculate the return on investment for influencer partnerships.
What are content analytics?
Content analytics give you both granular and aggregate insights on your content performance: either individual posts or posts grouped by theme or format. This helps you put your best foot forward with your content creation efforts—focusing on content types that work, and pulling back on those that don’t.
Examples of content analytics:
- Content type performance: a post analytics report tells you which types of content (e.g. videos, image posts, links, polls, text posts, etc.) are most successful.
- Topic analysis: an engagement analytics report determines the most popular topics based on audience interaction.
- Content frequency: judge how often to post for optimal reach and engagement.
What are audience analytics?
An audience analytics report shows you the demographics, behaviors and preferences of your target audience. This helps you to develop content that resonates, listen to and meet your ideal customer’s needs, attract qualified leads and optimize messaging—for greater marketing efficiency and enhanced products or services.
Examples of audience analytics:
- Demographic breakdown: the age, gender, location and interests of your target audience.
- Engagement patterns: segmenting your audience to see how different personas interact with your content.
- Audience overlap: judging whether you share an audience with a competitor or influencer.
How to track social media analytics?
If you’re wondering how to review your social media analytics, you can track data from different platforms using various tools.
How to track social media analytics: step-by-step
- Before you do anything, get clear on your objectives and KPIs. Consider:
- How does social media serve your overall marketing strategy? (brand awareness, customer support, employee advocacy, direct sales, etc.))
- What’s realistic and achievable?
- Choose a professional social media analytics tool. Each social media platform has a native analytics app, or you can get more advanced analytics with a third party tool like Socialinsider.
- Track and analyze data. Pay close attention to your KPIs and identify patterns or trends.
- Report your findings. Create a social media analytics report to communicate key insights and share with stakeholders.
- Adjust and optimize your strategy . Make data-driven decisions to improve your performance.
How to track social media analytics with Socialinsider
Socialinsider is an integrated analytics tool that covers Tik Tok, Instagram, LinkedIn, Facebook, X and YouTube in one easy-to-use dashboard —making life that bit easier for busy marketers. You can compare cross-channel performance, get competitor analysis, access listening insights, see benchmarks and more, on top of in-depth platform analytics.
Which social media metrics to track?
There are so many types of social media marketing metrics you could track—but which ones do you need to? We surveyed professional marketers in some of the most active industries on socials in our State of Social Media Report 2024. Here are the top metrics to track:
- Engagement metrics - 78.51%
How your audience interacts with your content through likes, comments, shares, saves, etc. - Reach and impressions - 68.6%
Visibility metrics that indicate brand exposure.
Reach: the total number of unique users who see your content.
Impressions: the total number of times your content is displayed to users, even if they don’t interact with it. - Follower growth and demographics - 64.46%
Insights on your audience and how it’s growing.
Follower growth: the rate at which you are gaining (or losing) followers.
Demographics: audience characteristics, such as age, gender, location, interests, industry, etc. - Social media traffic to website - 52.07%
How much traffic your social media channels are driving to your website, measured by visitors (typically tracked by referral links in Google Analytics). - Click-through rates - 43.8%
The percentage of people who clicked a link in your social media post or ad, out of the total impressions. - Conversion rates and leads generated - 34.71%
Metrics that help you calculate the ROI of your social media marketing.
Conversion rate: the percentage of users who completed a desired action (e.g. making a purchase) after interacting with your social media content.
Leads generated: the number of potential customers generated through social media activity, who have shown interest in your product or service (e.g. by submitting their details in a contact form).
How to use social media analytics?
Now you know which metrics to track, how do you put them to good use?
Once you’ve decided your goals and KPIs, set up your dashboards and started tracking your data, you might be wondering how to leverage these insights and apply social media analytics to your strategy.
The key lies in regular social media analysis and reporting. Aim for at least monthly, but ideally weekly reports if you want to truly harness the potential of social media analytics. Don’t forget to zoom out and conduct bigger retrospectives—quarterly or annually—too.
Here are some social media analytics best practices to up your marketing game.
How to do a social media analysis
- Identify patterns - rather than looking at numbers in isolation, try to connect the dots between different metrics, time periods and events. This will help you check if your KPIs are on track and realistic, or whether you need to adjust your goals.
- Monitor audience behavior - analyze demographics, times of peak activity and content preferences to tailor content to your audience’s likes and tendencies.
- Measure content performance - investigate patterns in reach and engagement, run experiments with different formats or tactics and test high-performing hashtags to increase the impact of your content.
- Social listening and trendwatching - closely observing conversations and trends can influence your content or even product development, streamline feedback, help you test content types (e.g. video) and guide your choice of influencer partners.
- Monitor brand reputation - keeping track of sentiment analysis and promptly responding to feedback will help you safeguard and enhance brand reputation.
- Competitor analysis - benchmark your KPIs against competitors or brands you admire, and analyze other accounts’ content and activity for ideas.
- Paid ads and campaign optimization - track campaign performance, refine targeting and adjust ad spend with robust paid social media analytics.
- Keep an eye on traffic and conversions using Google Analytics - understand social media’s role in your wider marketing strategy by logging social media referrals, studying who lands on your site and how they interact with page content, and assessing CRO.
How to interpret social media analytics?
Successful social media marketing requires a combination of vastly different skills—from high levels of creativity to deep levels of data analysis. Finding it tricky to work out what your social media analytics mean in real terms? The main thing to focus on is telling a story, rather than regurgitating numbers on the dashboard.
Here are some tips on how to understand social media analytics, so you can turn that raw data into meaningful insights to share with your team.
How to read social media analytics: key metrics
- Reach: high reach means you have strong visibility on the platform and more people are discovering your brand. If your reach is growing, your audience is growing. If your reach is low, you may need to optimize your content strategy for the algorithm (e.g. testing different content types or posting times).
- Impressions: similar to reach, impressions show the exposure of your content. However, while reach counts unique users who have seen your content, impressions count the total number of times your content was displayed—so it accounts for the same user seeing your post multiple times (e.g. if it was shared a lot).
- Engagement: shows how relevant and resonant your content is with your audience. High engagement means your brand is appealing and attractive, low engagement means you may be missing the mark.
- Engagement rate: shows the correlation between visibility and engagement, i.e. the percentage of people who interacted with your content, out of the people who saw it. A low engagement rate means people are seeing your content (perhaps because it’s an algorithm-friendly format), but it’s not landing with them (perhaps because of the topic or style).
- Followers: the rate at which you’re gaining (or losing) followers. Consistent follower growth means your content keeps people coming back for more—they are interested in building a relationship with your brand. Stagnant or decreasing followers means you’re not giving people that reason to follow (or you're actively putting them off).
- Traffic and conversions: monitoring the actions people take (e.g. website visits, form submissions, emails, downloads) after interacting with your brand and content on social media shows you the success of your overall strategy. A high CTR or conversion rate means people find your content compelling and convincing. Low rates mean you may need to emphasize or optimize your CTAs and landing pages, or adjust your content strategy.
- Sentiment: tells you how people feel about your content and brand. If it’s positive, you could capitalize on that feedback by sharing it or turning it into a campaign. If it’s negative or neutral, you’d want to address any issues causing dissatisfaction e.g. product issues or even macro-level, cultural changes.
How to assess performance over time
Success on social media is never built in a day—it takes consistency and determination. That’s why assessing your performance over time, whether it’s months or years, is so important.
- Keep an eye on patterns and trends, like spikes in engagement, dips in reach or stagnant period of follower growth.
- Consider how specific days, times of day or seasonal shifts might influence your performance.
- Compare with previous periods and cross-reference with changes to your strategy or updates to the algorithm.
How to identify high-performing content
It’s fairly straightforward to spot high-performing content from metrics like reach, impressions, clicks, views and engagements. With a sophisticated social media analytics tool like Socialinsider, you can also drill down into content formats and types to understand what lies beneath these metrics. Determining the factors that contribute to high performance means you can replicate them.
How to evaluate audience analytics
Evaluate your audience demographics to see who your current and potential audience is.
- Does your social media audience match your ideal audience?
- Are there any correlations between specific tactics (e.g. posting more Tik Tok-style content) and changes to audience demographics?
- Are there opportunities to tap into a brand new audience, for example by working with an influencer or producing localized content?
How to understand competitor analysis
Look closely at competitors’ posting strategies, content types and other activity. Study their strategies and tactics to see if you can borrow any of them—or do something completely different. For example, if a competitor posts more videos and consistently gets higher reach and engagement, maybe that’s your sign to invest in video too.
How to judge campaign performance
Alongside organic social media analytics, you can measure the impact of paid campaigns through engagement, reach, traffic and conversions. If those are high, try to identify what contributed to success so you can replicate it. If it underperformed, you might need to adjust messaging, targeting or content.
In summary, if you interpret data accurately and effectively, you can:
- Repeat formulas that work
- Improve weaknesses
- Feel confident taking risks to try something new
- Adjust current strategies
How to present social media analytics?
Social media marketing is incredibly resource-intensive, so you need to prove—to management, to stakeholders and to yourself—that all the effort and investment is worth it. In other words, it translates to a tangible return, like qualified leads, conversions and revenue.
Enter: social media reporting. Presenting social media analytics through clear, engaging and actionable reports will demonstrate ROI that gets the rest of your team or company on-side.
The top 3 ways to share social media reports
According to our State of Social Media 2024 report:
- Dashboards (e.g. interactive visualizations in Tableau or other tools) - 29.41%
- In-person presentations and meetings - 26.05%
- Formal static reports (PDFs); or scheduled stand-ups - 21.01%
Best practice for social media reporting
- Focus on the right metrics and insights for your target audience.
What you report on will depend on who you are reporting to. Is it content producers who need to understand how their copy or videography drives results? Here, you’d need to focus on more granular content analytics. On the other hand, if you are presenting to executives, you’d need broader brush strokes i.e. high-level metrics and proven ROI. - Connect the dots and tell a story.
Don’t just show raw data or isolated metrics. Link everything together to show how different actions contribute to overall results. Highlight patterns and trends over time, tracing them back to key factors or drivers. - Use visuals.
Charts, graphs and screenshots can bring data to life, making it easy for your audience to see progress over time and how all those metrics add up in real terms.
Social media analytics report template
If you’re wondering how to structure your social media analytics reports, here’s a template to follow.
- Kick off with a short introduction or executive summary: a succinct overview of the report’s main purpose, findings and takeaways.
- Reiterate objectives and KPIs so everyone understands what your social media strategy is trying to achieve.
- Share an overview of key metrics —the need-to-know about follower count and growth, overall impressions or reach, total engagements and average engagement rates, etc.
- Showcase best performing posts via screenshots, accompanied by their KPIs (you could do the same for worst performing posts too).
- Provide some audience insights and behavior, demonstrating demographic breakdowns, peak activity periods, content preferences—and any changes to these from the last report.
- Look into competitor analysis —where are you ranking for metrics like followers, impressions or engagement?
- Action points and next steps —don’t forget this part! It’s crucial that you translate these insights into practical ideas.
How to calculate ROI
Most social media analytics tools can’t calculate the ROI of your social media efforts because they don’t have access to data from the rest of the funnel (e.g. your website visitors).
However, it’s relatively straightforward to calculate social media ROI by yourself.
ROI = (gain from social media) / (cost of social media) x 100
You can show ROI through KPIs and metrics like:
- Sales / revenue
- Leads / content submissions
- Traffic / visitors
- Brand awareness / visibility metrics
- Sentiment / conversations, interactions
What does advanced analytics for social media do?
Advanced analytics for social media use more sophisticated data analysis and artificial intelligence to provide businesses and marketers with deeper insights on their brand performance. This goes beyond simple metrics such as likes, reach, comments and shares to extract more meaningful patterns and trends, which can guide data-driven decision-making.
Integrated analytics tools like Socialinsider can help you:
- Compare performance across channels.
Multi-platform analytics consolidate data from several social media platforms (for example, Facebook, Instagram and LinkedIn) to give you perspective on how your social media marketing is performing across the board. These cross-channel insights will show you which social media platforms are most effective, so you can allocate resources and adjust strategies. - Get competitor analysis and benchmarks.
Advanced analytics can track activity, follower growth, engagement rates and content performance from other accounts, not just yours. This gives you KPI benchmarks and competitive intelligence to inform your strategy—for example, by replicating successful tactics used by other brands, or by seizing an opportunity your rivals haven’t spotted yet. - Run sentiment analysis.
Powerful analytics software can use natural language processing to gauge sentiment analysis. By analyzing the emotional tone of comments, mentions and conversations about your business, you can assess how your audience feels towards your brand (positive, negative or neutral). This helps you manage your brand reputation, keep potential PR crises under control, and leverage customer feedback for product development, content and campaigns. - Carry out social listening and trend analysis.
Real-time social listening is a crucial part of predictive analysis: by monitoring emerging trends, popular hashtags or growing conversations, you can stay in tune with your audience and one step ahead of the competition. This could inform anything from putting your brand’s stamp on a viral Tik Tok trend, to quickly responding to demand for a brand new product. - Optimize posts and campaigns with detailed content analysis.
Smart social media analytics will give you both a granular and macro-level view of your content performance, so you can optimize your posting and campaigns strategies. You can look at variables like post format, time of day, visuals and messaging, or zoom out to see which content pillars or topics are performing best.
This is just the tip of the iceberg in what advanced analytics can do, so investing in the right software is essential for effective, data-driven and ROI-generating social media marketing.
Start leveraging next-level social media analytics and skyrocket your brand on social!
Look at in-depth social media analytics data and get strategic insights that will help you optimize your social media strategy and gain a competitive advantage.


