Twitter analytics beyond what the platform shows you
One dashboard, a full competitive view. Socialinsider pulls engagement, growth, and content data for any public Twitter profile and puts it next to yours.


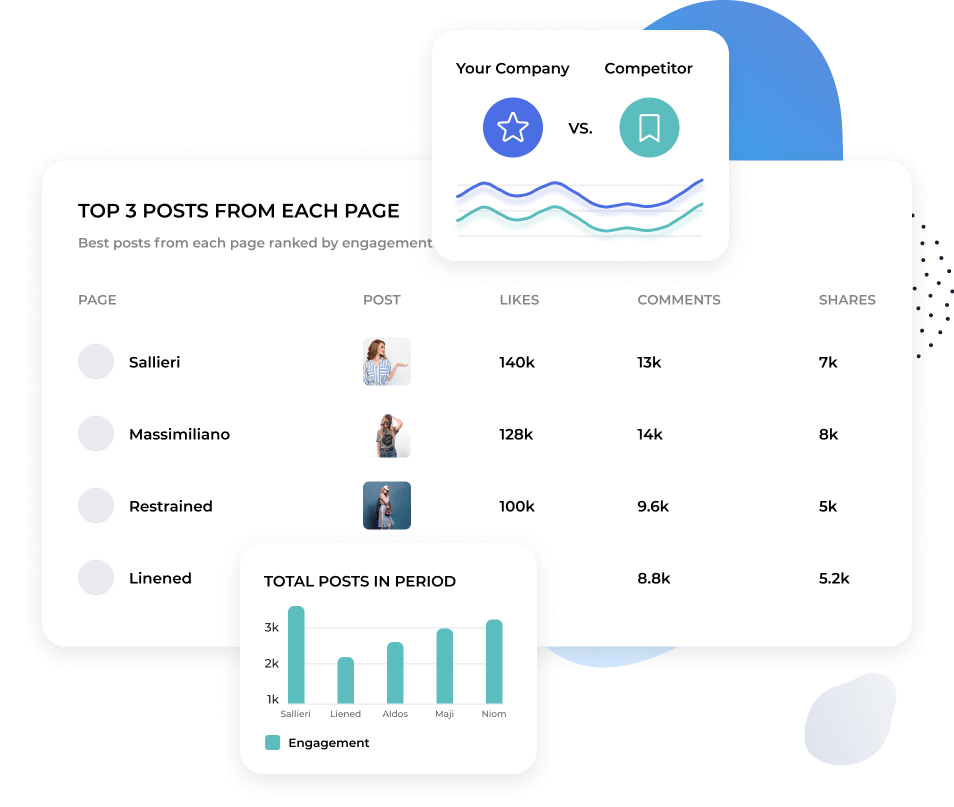
Benchmark your Twitter profile against any competitor
Add any public Twitter profile and see engagement, impressions, replies, retweets, and follower growth side by side with your own.
No need to go back and forth between profiles or take 100 screenshots. It’s all in one view for immediate analysis & insights.
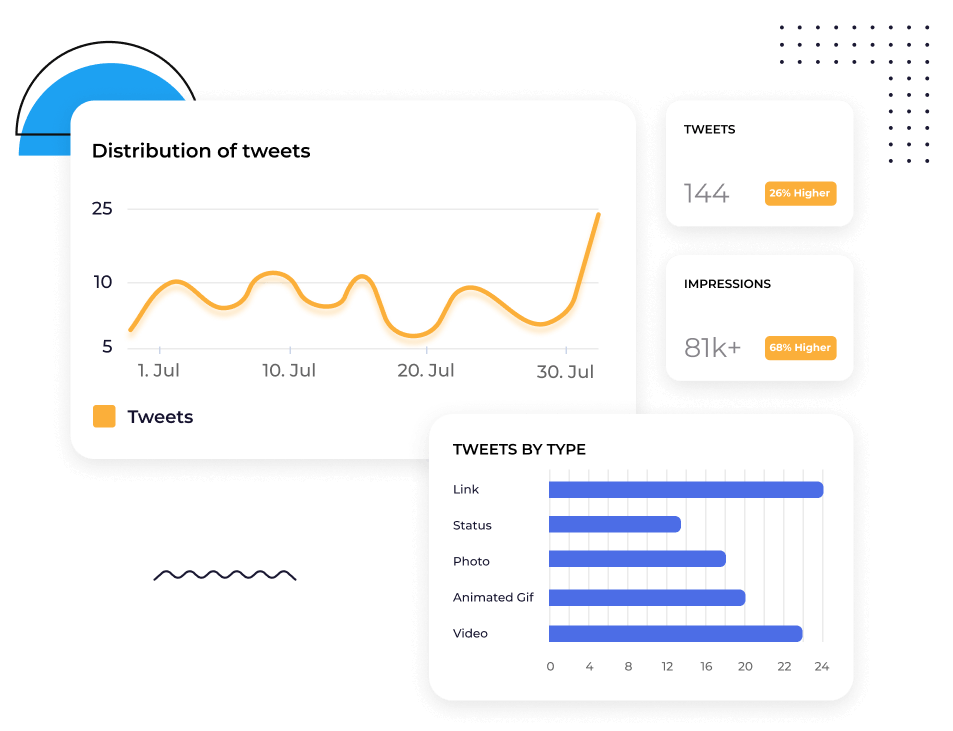
Understand what content is landing on Twitter
Twitter moves fast. What gets traction today might not tomorrow.
Socialinsider breaks down content performance at the post level and groups it by theme, so you can see which topics and formats consistently earn engagement — not just which individual posts went viral.

"We`ve started using Socialinsider to create comprehensive competitor analysis."

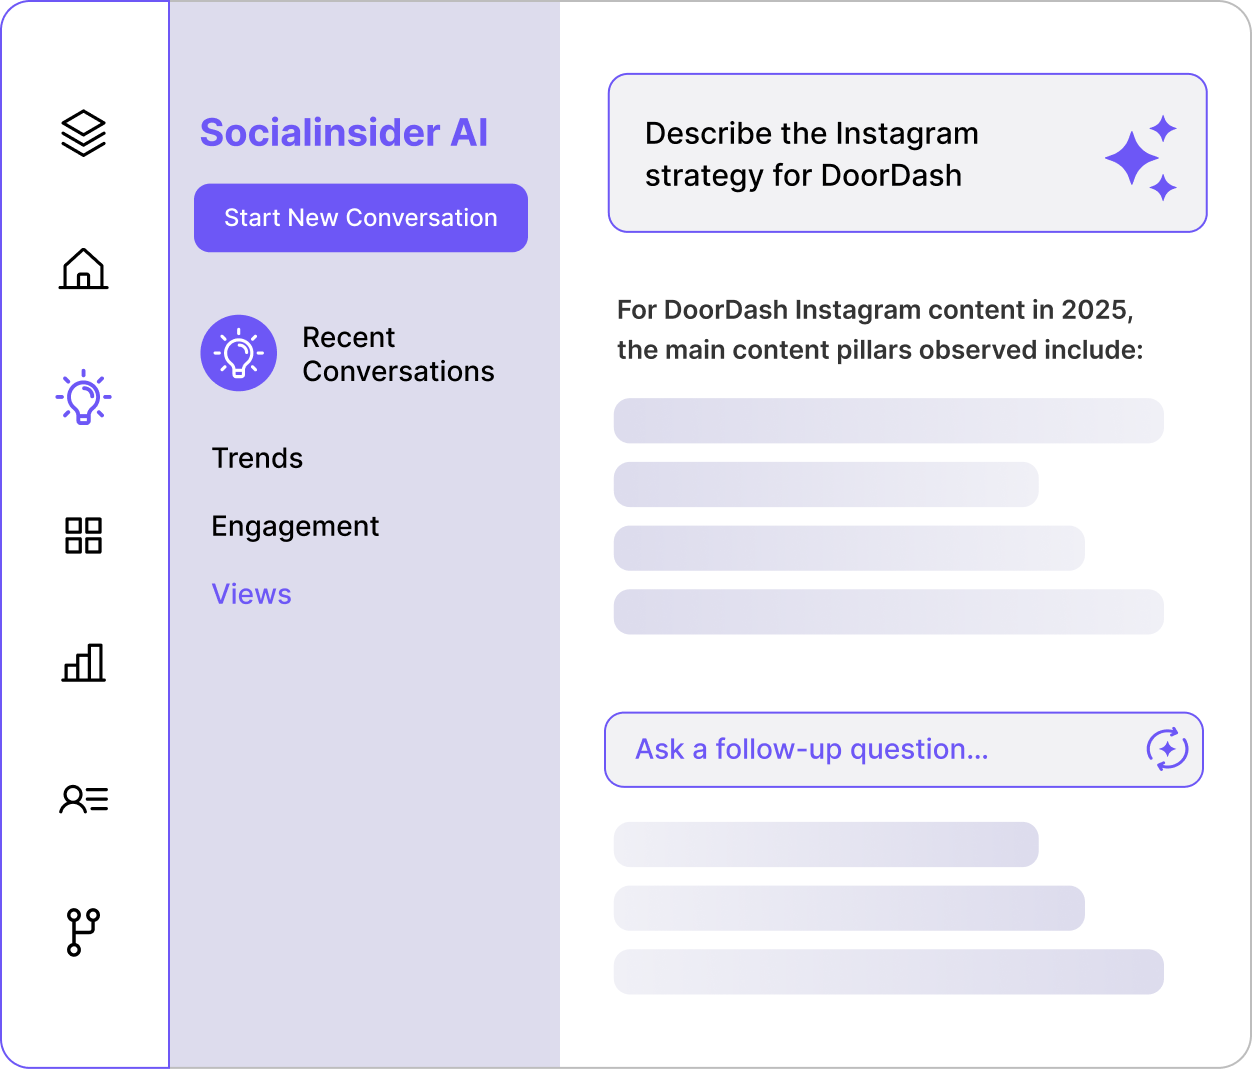
Ask Socialinsider AI what's happening on your Twitter profile
Ask a question like: Why did replies spike last week? or How does our posting frequency compare to [competitor]?
Socialinsider AI pulls from your Twitter data, your competitors' data, and industry benchmarks to give you a written answer you can act on.
Automate Twitter reporting with ready-to-present reports
Pull your Twitter analytics into CSV, Excel, PDF, or PPT. Connect to Looker Studio if your team runs dashboards there.
Reports come out formatted and branded so you're not spending an afternoon rebuilding a deck every month.
What they say about us
"Customer service has been one of my favourite features as well. You guys are just phenomenal. Your team is so responsive and very friendly and helpful. Which is not the norm."

"Socialinsider helped us understand whether we're improving or decreasing especially compared to the other accounts that we follow."

"Socialinsider allows for a competitor analysis that gives an insight to performance relative to the market."

"The sentiment analysis is amazing for Instagram hashtags. This new social media listening dashboard helped me in long-term planning."

"We are using this social media analytics dashboard for all our 40 social media clients. We can have all the performance data in one single place."

"With Socialinsider, our team became more efficient. We do not need to spend time on social media data gathering. Instead, we can focus on insights and analysis."

"We use Socialinsider for day-to-day social media insights if we need to outline any simple strategic changes or review the performance of certain social posts."

"On average, a social media report for a brand requires 1 to 2 hours of work with Socialinsider, where it used to require a full day to gather the data."

"Socialinsider has saved us more than $16k per year. It has enabled us to save time on monthly reports and complex long-term analyses."

How to track Twitter engagement rate in Socialinsider
Sociainsider’s social media analytics, competitors analysis tools allow you to measure social media performance, run audits, and compare performance.
Start by creating a trial account to Socialinsider
Add your competitors and connect the profiles you manage
Get all the engagement metrics for any Twitter business account
Compare your performance against your top competitors
Perform a cross-channel analysis to evaluate your Twitter performance.

Get competitive insights and explore
social media analytics metrics
Frequently Asked Questions
Got a question? We've got answers.
What is Twitter analytics?
X (Twitter) analytics involves collecting and analyzing data from your X account to assess and optimize your strategy and presence on the platform.
You can pull various metrics from your Twitter data, but they broadly fall into three categories:
- Audience: e.g. follower growth, demographics and active times.
- Content: e.g. Tweet impressions, video views, engagements, engagement rates and link clicks.
- Campaign performance: e.g. cost per engagement, conversion rates, and return on ad spend (ROAS).
You can either monitor your Twitter activity using native Twitter analytics (but be warned: this is only available with a paid X premium plan) or with a third-party tool, like Socialinsider.
Effectively tracking and interpreting your analytics data is crucial to any successful Twitter marketing strategy. Twitter insights will help you:
- Run a Twitter audit: with a comprehensive overview of all your Twitter activity, you can quickly identify what is and isn’t working—without wasting time or budget on tactics that aren’t serving your business objectives.
- Measure content performance: by understanding which content gets the most views, impressions, likes, replies or retweets, you can tailor future posts to boost performance.
- Analyze profile growth: tracking your profile visits and followers will reveal whether your content is driving tangible page growth.
- Identify trends: across your audience, industry and the platform at large—so you can keep up with the fast-paced conversations Twitter is famous for.
- Export data for reporting and measuring ROI: keep a close eye on how spend and resource is translating to ROI. Export data from Twitter analytics to create clear, actionable reports for you and company stakeholders.
Why tracking X (Twitter) analytics is important
If you’re using social media in your marketing strategy, you need to get very familiar with social media analytics.This is especially true for Twitter.
Firstly, the very nature of Twitter is…well, kind of overwhelming. With over 300 million users, a high volume of Tweets, and conversations that move at lightning speed, you might wonder if cutting through the noise is even possible.
Secondly, Twitter has undergone huge changes since it was acquired by Elon Musk in 2022—and not just changing its name to X:
- Features and functionality - Musk has shared that he imagines X as an “everything app”. This means new functions and features are being added to the platform all the time—from shopping, to X Premium accounts, to ad revenue sharing.
- More diverse content - Previously known for its snappy, 140-character Tweets, X has increased the character limit so its paying users can post longer text updates, as well as introducing more multimedia content.
- Audience growth - Overall, X has lost an estimated 32.7 million users since the acquisition. But if we drill down into the demographics, we can see a rise in Gen Z users (45% of Gen Z use X).
How brands can use Twitter analytics
Brands have historically used Twitter to have fun and communicate in real-time with their audience (think fast food brands like KFC or Wendy’s). However, all this change might leave you questioning whether X is still worth investing in.
That’s why Twitter analytics are more important than ever—they’ll help you answer that question. You’ll be able to:
- Gather competitive intel - monitor other Twitter profiles and Twitter activity in your industry to find your competitive edge: are other brands in your niche having success? What are the most important topics of conversation? Is your category saturated, or are there gaps you can fill? All of this will tell you whether it’s worth maintaining a presence on X in the first place.
- Deliver a better customer experience - every good marketing strategy starts with understanding your audience. Your Twitter follower analytics will show you the demographics you’re attracting (or want to attract), so you can weave their needs and preferences into every Tweet and campaign. And it’s not just about content—remember that X is a key channel for real-time customer support, too.
- Understand trends and patterns - Twitter is not only extremely trend-driven, but also extremely fast. With discussions around news or events happening in real-time, analytics help you monitor emerging conversations, track seasonal patterns and delve into audience behavior, so you can stay relevant, adapt and capitalize on important moments for your brand.
- Identify the best content - Tweets remain capped at 280 characters for non-paying users, but paying users can post up to 4,000 characters. Still, old habits die hard: the average Tweet is between 240 and 259 characters, and it’s recommended to post 5-10 times a day. Given the limited space and high posting frequency, you’ll need resource, sharp messaging and a distinctive brand voice to succeed. Tracking your Twitter efforts will help you identify top-performing posts and formats (e.g. video vs. text), optimize your content production, and improve performance.
- Get X (Twitter) influencers and advocates - on the subject of boosting visibility, increasing engagement, and building trust with your audience, partnering with X influencers and advocates can be a game-changer. Twitter analytics will help you pick out followers who engage frequently with your brand, and spot popular thought leaders and creators in your niche. Whether you run giveaways, host AMAs or collaborate on promoted tweets, you can then use analytics to report on the success of the partnership.
How to check Twitter analytics
Now you understand why it’s so important to have robust Twitter analytics, you might be wondering how to see your Twitter analytics.
First things first, native Twitter analytics are only available with a paid subscription to X Premium. So if you have an unpaid membership or Basic X subscription, you won’t be able to access your in-app analytics dashboard.
The good news is that you can use a third-party tool, like Socialinsider, to conduct advanced analytics without paying for an X subscription.
Here’s a quick guide to how to access Twitter analytics on X mobile and desktop, and via Socialinsider.
How to check X (Twitter) analytics on mobile
- Open the X (Twitter) app and log in to your account.
- Tap your profile picture to navigate to your page.
- Find a specific tweet you wish to analyze.
- Tap the "•••" (More) icon under the tweet, then select "View Tweet Analytics" to see detailed engagement data like impressions, likes, and retweets.
The mobile version of X (Twitter) analytics is pretty useful for checking Tweet performance on-the-fly. However, you’ll need to use the desktop version for full account analytics.
How to check X (Twitter) analytics on desktop
- Go to X.com or twitter.com and log in to your account.
- Click on “More and Creator Studio” in the left-hand menu, where you’ll find your X Analytics dashboard.
- You’ll be able to see an overview of your account performance, including:
- A 28-day summary of impressions, profile visits, mentions and followers
- Highlights like top tweets, top mentions and top followers
- Tweet and video activity: more granular content metrics like impressions, views and engagements
- Conversion tracking for ad campaigns
You can also explore audience demographics (age, location, active times, etc.) and content trends over time.
How to check X (Twitter) analytics with Socialinsider
Beyond the native analytics dashboard, Twitter analytics tools like Socialinsider can give you more powerful insights to really up your game on X.
If you want to understand long-term analytics, track relevant KPIs in an easy-to-read Twitter analytics dashboard, access competitive data and industry benchmarks, and automate your reporting—all without paying for an X subscription—it’s worth looking into.
Here’s how to view Twitter analytics with Socialinsider:
- Create or log in to your Socialinsider account.
- Create a new project or navigate to an existing project. Click “Connect social accounts”.
- Connect to your X (Twitter) account, then select the page(s) you would like to add.
- From your dashboard, you can select the platform and page you wish to analyze.
- Here, you can access a wide range of advanced analytics—from Socialinsider’s Twitter competitor analysis tools, to historical analytics data for your tweets.
All the X (Twitter) metrics you need to know
Not only is X a very unique social media platform, but it’s also been through some pretty big changes. So you can’t simply copy and paste your reporting strategy from Instagram or Tik Tok—you need to have a solid understanding of which Twitter analytics metrics to track.
But before you start tracking, get clear on your goals first. Your KPIs will depend on your business objectives, but X tends to be best for:
- Growing your audience and increasing brand awareness
- Boosting engagement and nurturing a community
- Driving website traffic
- Direct sales
- Thought leadership
- Customer research and social listening
Broadly speaking, the most important metrics to track are overview metrics, audience metrics and content metrics. Let’s break down each area and understand how each metric feeds into the bigger picture.
Overview metrics
X’s fast pace means you do need to track performance in real-time. This is where overview metrics come in, as they allow you to check all your KPIs at-a-glance.
From this high-level summary of your Twitter account analytics, you can determine the overaleffectiveness of your strategy and quickly spot patterns in performance.
Overview metrics include:
Impressions (track with Socialinsider) - the total number of times your tweet has been seen, which includes multiple views from the same user. Tracking impressions helps you gauge your content reach and brand visibility on X.
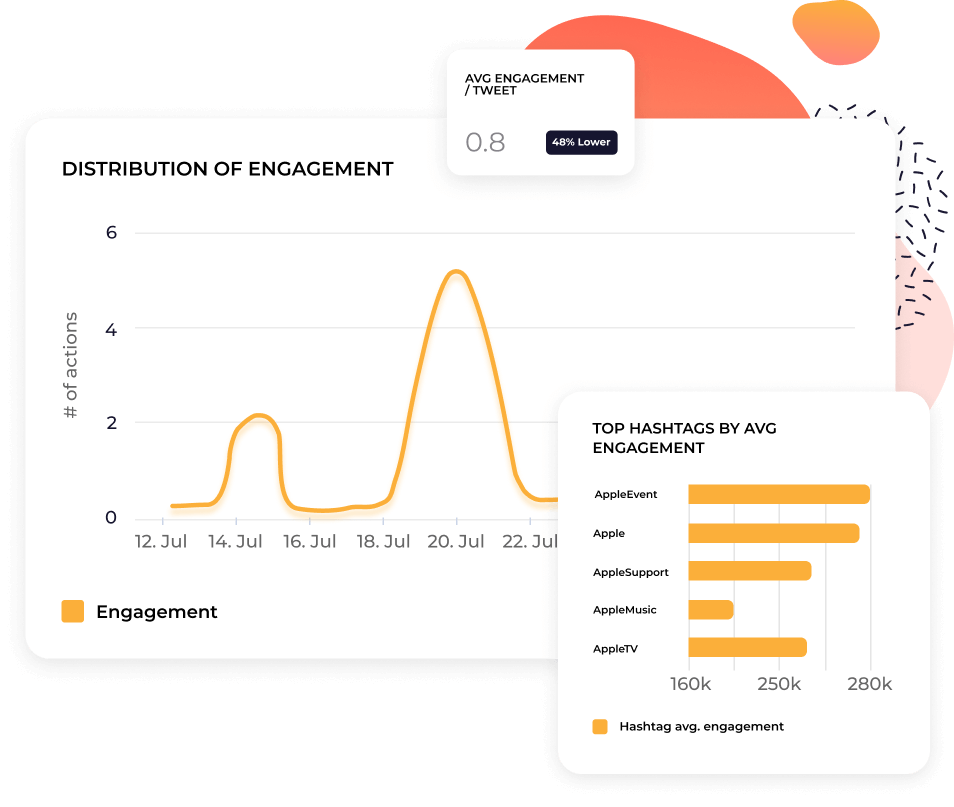
Engagement (track with Socialinsider) - the total number of interactions on a tweet, including likes, replies, retweets and clicks on links, hashtags or media. This lets you know if your content is resonating with your audience. Also, high engagement drives visibility in the X algorithm.
Engagement rate (track with Socialinsider) - the percentage of users who have interacted with a Tweet, out of the total users who saw it. You can calculate this by adding up the total engagements on a Tweet, dividing this number by either Tweet impressions OR your total followers, then multiplying by 100 to get a percentage. As fluctuations in visibility may be out of your control (for example, if there is an algorithm update), engagement rate is a useful way to measure the quality of engagement, not just the quantity.
Profile visits (track in the native app) - how many times users click through to your profile. Monitoring profile visits is a useful way to measure how your content is driving interest in your brand, and if people are actively searching for your account. Essentially, do people want to learn more about you?
New followers (track with Socialinsider) - how many new followers you’ve gained over a specific time period. This shows you whether your content and campaigns are driving audience growth. If you’re gaining followers, it indicates that people are interested in building an ongoing relationship with your brand—perhaps they liked a Tweet, and now they want to see what you post next.
Replies (track with Socialinsider) - the number of direct responses to your tweet. Replies signal that your content is driving conversation—which is, after all, the real purpose of Twitter. They’re useful for increasing engagement (as the X algorithm will prioritize content with lots of buzz) and nurturing your community (for example, fostering connection or gathering feedback).
Likes (track with Socialinsider) - the number of likes a Tweet gets. Likes are the easiest way for your audience to interact with your content, making them a quick indicator of whether your content is getting the seal of approval.
Reposts (track with Socialinsider) - the number of times your tweet is reposted or “retweeted”. If someone retweets you, it means they identify with your content and think it’s valuable enough to share with their followers. So by designing your content to be shareable, you can amplify it to a broader audience.
Bookmarks (track in the native app) - how many times users have saved your tweets. Again, bookmarks are a really important value-based metric—even if people don’t publicly interact with your content, saves show that they found it interesting and relevant enough to revisit at a later date.
Shares (track with Socialinsider) - the number of times your content has been shared, both on and off X. This includes reposts or retweets, but also external shares outside of X (for example, via WhatsApp or email). This lets you see how far your message is spreading beyond your immediate audience.
Quotes (track with Socialinsider) - the number of times your tweet is reposted with additional commentary. When users quote your tweet, they are engaging more deeply with your content by sharing their own ideas or hot takes. In other words, your content is not only interesting or valuable, but also thought-provoking.
Follower growth (track with Socialinsider) - the rate at which your total followers are increasing or decreasing over time. It’s essential to analyze your Twitter followers to understand the overall health of your X presence and track the long-term impact of your content.
Audience metrics
Ultimately, your X strategy—from the type of content you create, to the KPIs you track—is going to depend on your unique audience. Do they prefer videos or article links? Are they entertained or baffled by memes? When are they most likely to see your content? Tracking audience metrics can help you answer all of this and more.
Age (track in the native app) - the dominant age brackets of your followers. If you know the age demographics you’re speaking to, you can make sure this aligns with your business’s target audience, tailor your content to better fit their interests and preferences, and refine your messaging so it lands with the right groups.
Gender (track in the native app) - the gender breakdown of your followers. Again, this helps you assess whether your strategy is on track—whether you’re aiming for balanced representation or targeting a specific gender—and optimize your content and advertising efforts accordingly.
Active times (track in the native app) - peak times of the day or week when your audience is most active on X. Because Tweets are more ephemeral than other types of social media content, you want to post when your followers are online—having this data helps you align your schedule.
Country (track in the native app) - the main geographic locations of your followers. Knowing where your followers are based is essential for ad targeting, but also for being sensitive to cultural preferences, and tailoring content or campaigns for a global vs. local audience.
Content metrics
For some businesses, it’s enough to use X for social listening or customer support. But if you want to build a presence that could genuinely impact your bottom line, you need to invest in content. And if you’re going to invest in content, you’re going to need to understand content metrics.
Here are the metrics you need to track to develop a winning content strategy on X:
AI Content Pillars (track with Socialinsider) - using AI, Socialinsider can identify key themes or categories to build your content around. These are what we call “content pillars”. They help you focus and organize your content creation efforts, so you can invest in posts that resonate most with your audience. In Socialinsider, you can see both the volume of content and the engagement rates in different categories.
Engagement for each content pillar (track with Socialinsider) - this measures how well different content pillars perform by tracking likes, replies, retweets, quotes, shares, clicks, etc. By identifying themes that generate the most interactions, you can feel more confident ideating and creating future content.
Impressions on a post level (track with Socialinsider) - the number of times an individual post has been displayed in users’ feeds. Comparing impressions across analytics for individual tweets will show you what specifically drives reach for your page (messaging, post type, paid promotions, etc.).
Likes on a post level (track with Socialinsider) - the number of likes on an individual post. This gives you a clear indication of which content lands well with your audience.
Replies on a post level (track with Socialinsider) - the number of direct responses or comments on an individual post. This will reveal what kind of content drives deeper engagement by sparking conversations.
Reposts on a post level (track with Socialinsider) - the number of times a post has been reposted or retweeted—in other words, how shareable your content is. By monitoring this over time, you should get an idea of what exactly prompts people to share.
Engagement rate on a post level (track with Socialinsider) - the percentage of people who engaged with an individual post out of the people who saw it (impressions or followers). This is helpful for clarifying your top-performing posts. For instance, if two posts have the same engagement but different impressions, the one with the higher engagement rate stands out.
Post types by engagement (track with Socialinsider) - a breakdown of engagement based on the type of content: links, text posts, photos, animated GIFs or videos. Really handy for easily identifying which formats perform best—so you can create more of what truly engages your audiences.
Top posts by engagement (track with Socialinsider) - a leaderboard of posts with the highest levels of engagement. Ranking post performance will help you replicate and refine successful tactics or content types, so you can keep on hitting new highs of engagement.
Bottom posts by engagement (track with Socialinsider) - the posts with the lowest levels of engagement. This is just as important as tracking top-performers, so you can learn what to stop doing and avoid wasting time, resource or budget on content that doesn’t drive meaningful results.
How to create X (Twitter) analytics reports.
Creating detailed X (Twitter) analytics reports is helpful for you, the rest of your team, and company stakeholders. They’ll help you:
- Track performance to make sure your posts and activity are hitting KPIs
- Identify patterns and trends to refine your content creation efforts
- Gather helpful intel on your audience and competitors
- Communicate how your Twitter marketing is supporting wider business objectives
You can create Twitter reports in various formats by following the steps below.
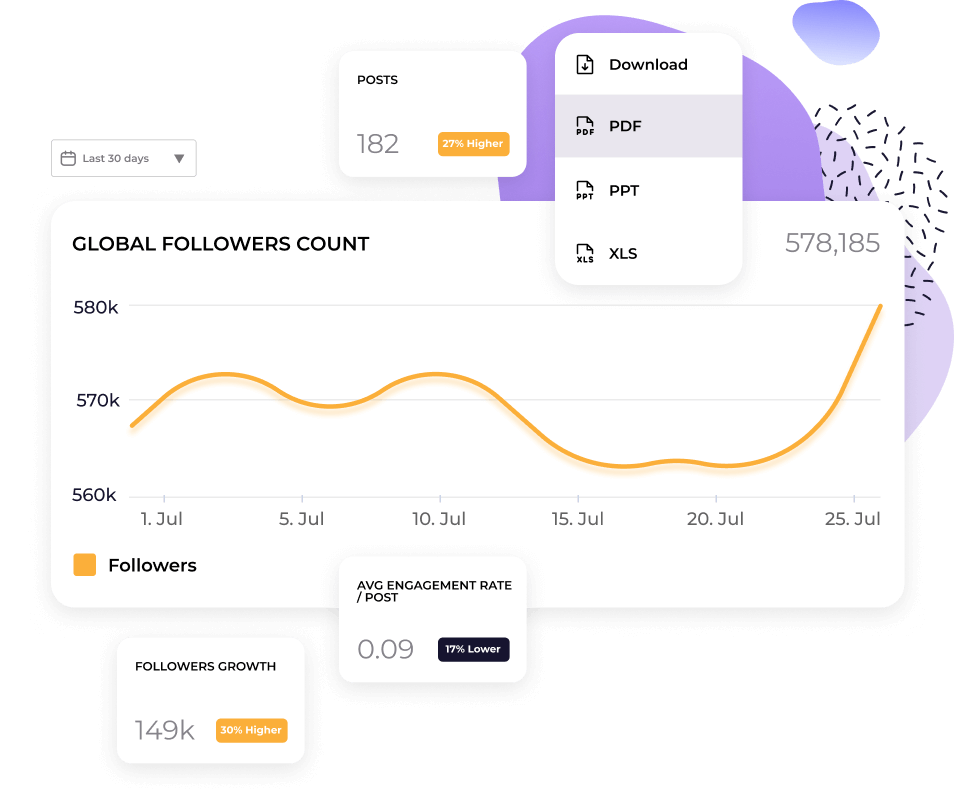
a) CSV reports - create with SocialinsiderWith Socialinsider, you can export any data you see in your dashboard. Whether it’s a profile overview or top-performing posts, just look out for the “Download” button in the top-right corner.
When you click this, you’ll see a dropdown menu with different formats. Select CSV to export your data, which you can then import into Microsoft Excel or Google Sheets (note that only certain reports can be exported as CSVs).
b) PPT, PDF or Excel reports - create with SocialinsiderTo export your Socialinsider data into PPT, PDF or Excel reports, simply follow the same steps as above, but select a different format from the dropdown menu.
You can also automate reporting to get your favorite reports sent straight to your inbox. Just head to the “Autoreports” section in the left hand sidebar and start scheduling.
c) Looker studio - create with GoogleIf you’re working with a lot of data (for example, across multiple profiles, channels or brands), you might wish to use Google’s Looker studio (formerly Google Data Studio). Looker is a data visualization platform that can help you present and analyze your Twitter data in a bigger, more sophisticated marketing dashboard.
To pull in your Socialinsider data, log into Google Looker, go to “Data sources” and connect Socialinsider.
How to create X (Twitter) analytics competitor reports
Your Twitter account may offer plenty of data, but focusing solely on your own metrics won’t drive social media success. To really level up your Twitter marketing strategy, you need to look outwards, conducting regular competitor analysis and benchmarking to figure out what rivals and industry leaders are doing (or missing). This will help you:
- Understand how you are performing compared to competitors
- Set realistic KPIs and objectives
- Keep up with conversations and trends in your niche
- Replicate successful strategies—or jump on opportunities no one else has spotted
Luckily, it’s easy to look at Twitter analytics for another account using Socialinsider’s competitor analysis tools. For each Twitter profile, you can track:
- Which topics resonate most with your audience? - Highlight key themes and topics that drive engagement for competitors, so you can get inspiration for your own posts.
- How do posts perform over time? - Track and compare post performance across your account and your competitors’ accounts, so you can spot patterns and better understand dips or spikes—for example, if there’s an algorithm update that’s affecting everyone’s impressions.
- Followers growth - Monitor your rivals’ follower counts and growth rates so you can keep an eye on how fast their audience is expanding, relative to yours. From this, try to assess triggers for patterns of growth, so you can get an insight into how they are attracting (or even losing followers) and optimize your strategy accordingly.
- AI content pillars - Socialinsider’s AI-driven analysis can group competitor posts into specific pillars, like educational posts or entertainment news. By revealing what drives engagement for competitors (or simply brands you admire), you can reverse-engineer their strategy and refine your own content mix.
By analyzing all these competitive metrics, you can accurately evaluate what does and doesn’t work in your niche, so you can make data-driven decisions and outperform your rivals.
What happened to X (Twitter) analytics?
X (formerly Twitter) analytics used to be free to all users on the platform. As of recent changes, the native Twitter analytics page is now only available to users with a Premium subscription. If you’re wondering how to see Twitter analytics now, you have two choices:
a) Upgrade to a paid plan on X (Premium or Premium+)
b) Sign up for a third-party analytics tool, like Socialinsider
Where is X analytics now?
X Analytics has now moved behind the paywall, meaning users need a Premium subscription to access performance data. Alternatively, you can get advanced reporting and insights using a third-party tool like Socialinsider, without needing to upgrade to a paid X plan.
Why can’t I see analytics for my Tweet?
If you can’t see analytics for your tweets, check which type of X plan you are on. If it’s free or Basic, you can no longer access X analytics—you’ll need to either upgrade to a Premium subscription, or use a third-party tool like Socialinsider.
Where are the analytics for posts on Twitter now?
Post analytics are still available, but only for Premium users. If you're no longer seeing them, it’s because X has restricted access to analytics without a paid plan. Alternatively, you can use third-party analytics platforms like Socialinsider for robust Twitter analytics, without needing to upgrade.
Get the full picture on Twitter analytics data
See how your Twitter performance compares to the competition, then make strategic decisions with the data to back it up.