2026 LinkedIn Benchmarks
Discover the latest LinkedIn benchmarks and get insights into how to optimize your strategy to boost your LinkedIn presence.

If there’s one thing I’ve learned from working with social media data over time, it’s that staying relevant requires constant adjustment. The way people engage with content keeps evolving, and even small shifts in behavior can change what performance looks like from one year to the next.
That is why today, success on LinkedIn is more challenging—and more strategic—than ever. To help you understand where new opportunities lie, this LinkedIn benchmarks report offers clear insights into what’s working across engagement, impressions, posting habits, and audience growth right now.
Based on the analysis of 1.3M LinkedIn business posts, these LinkedIn benchmarks provide the clarity and context needed for you to set informed goals, sharpen your content strategy, and maximize your LinkedIn impact in an increasingly competitive landscape.
Executive summary
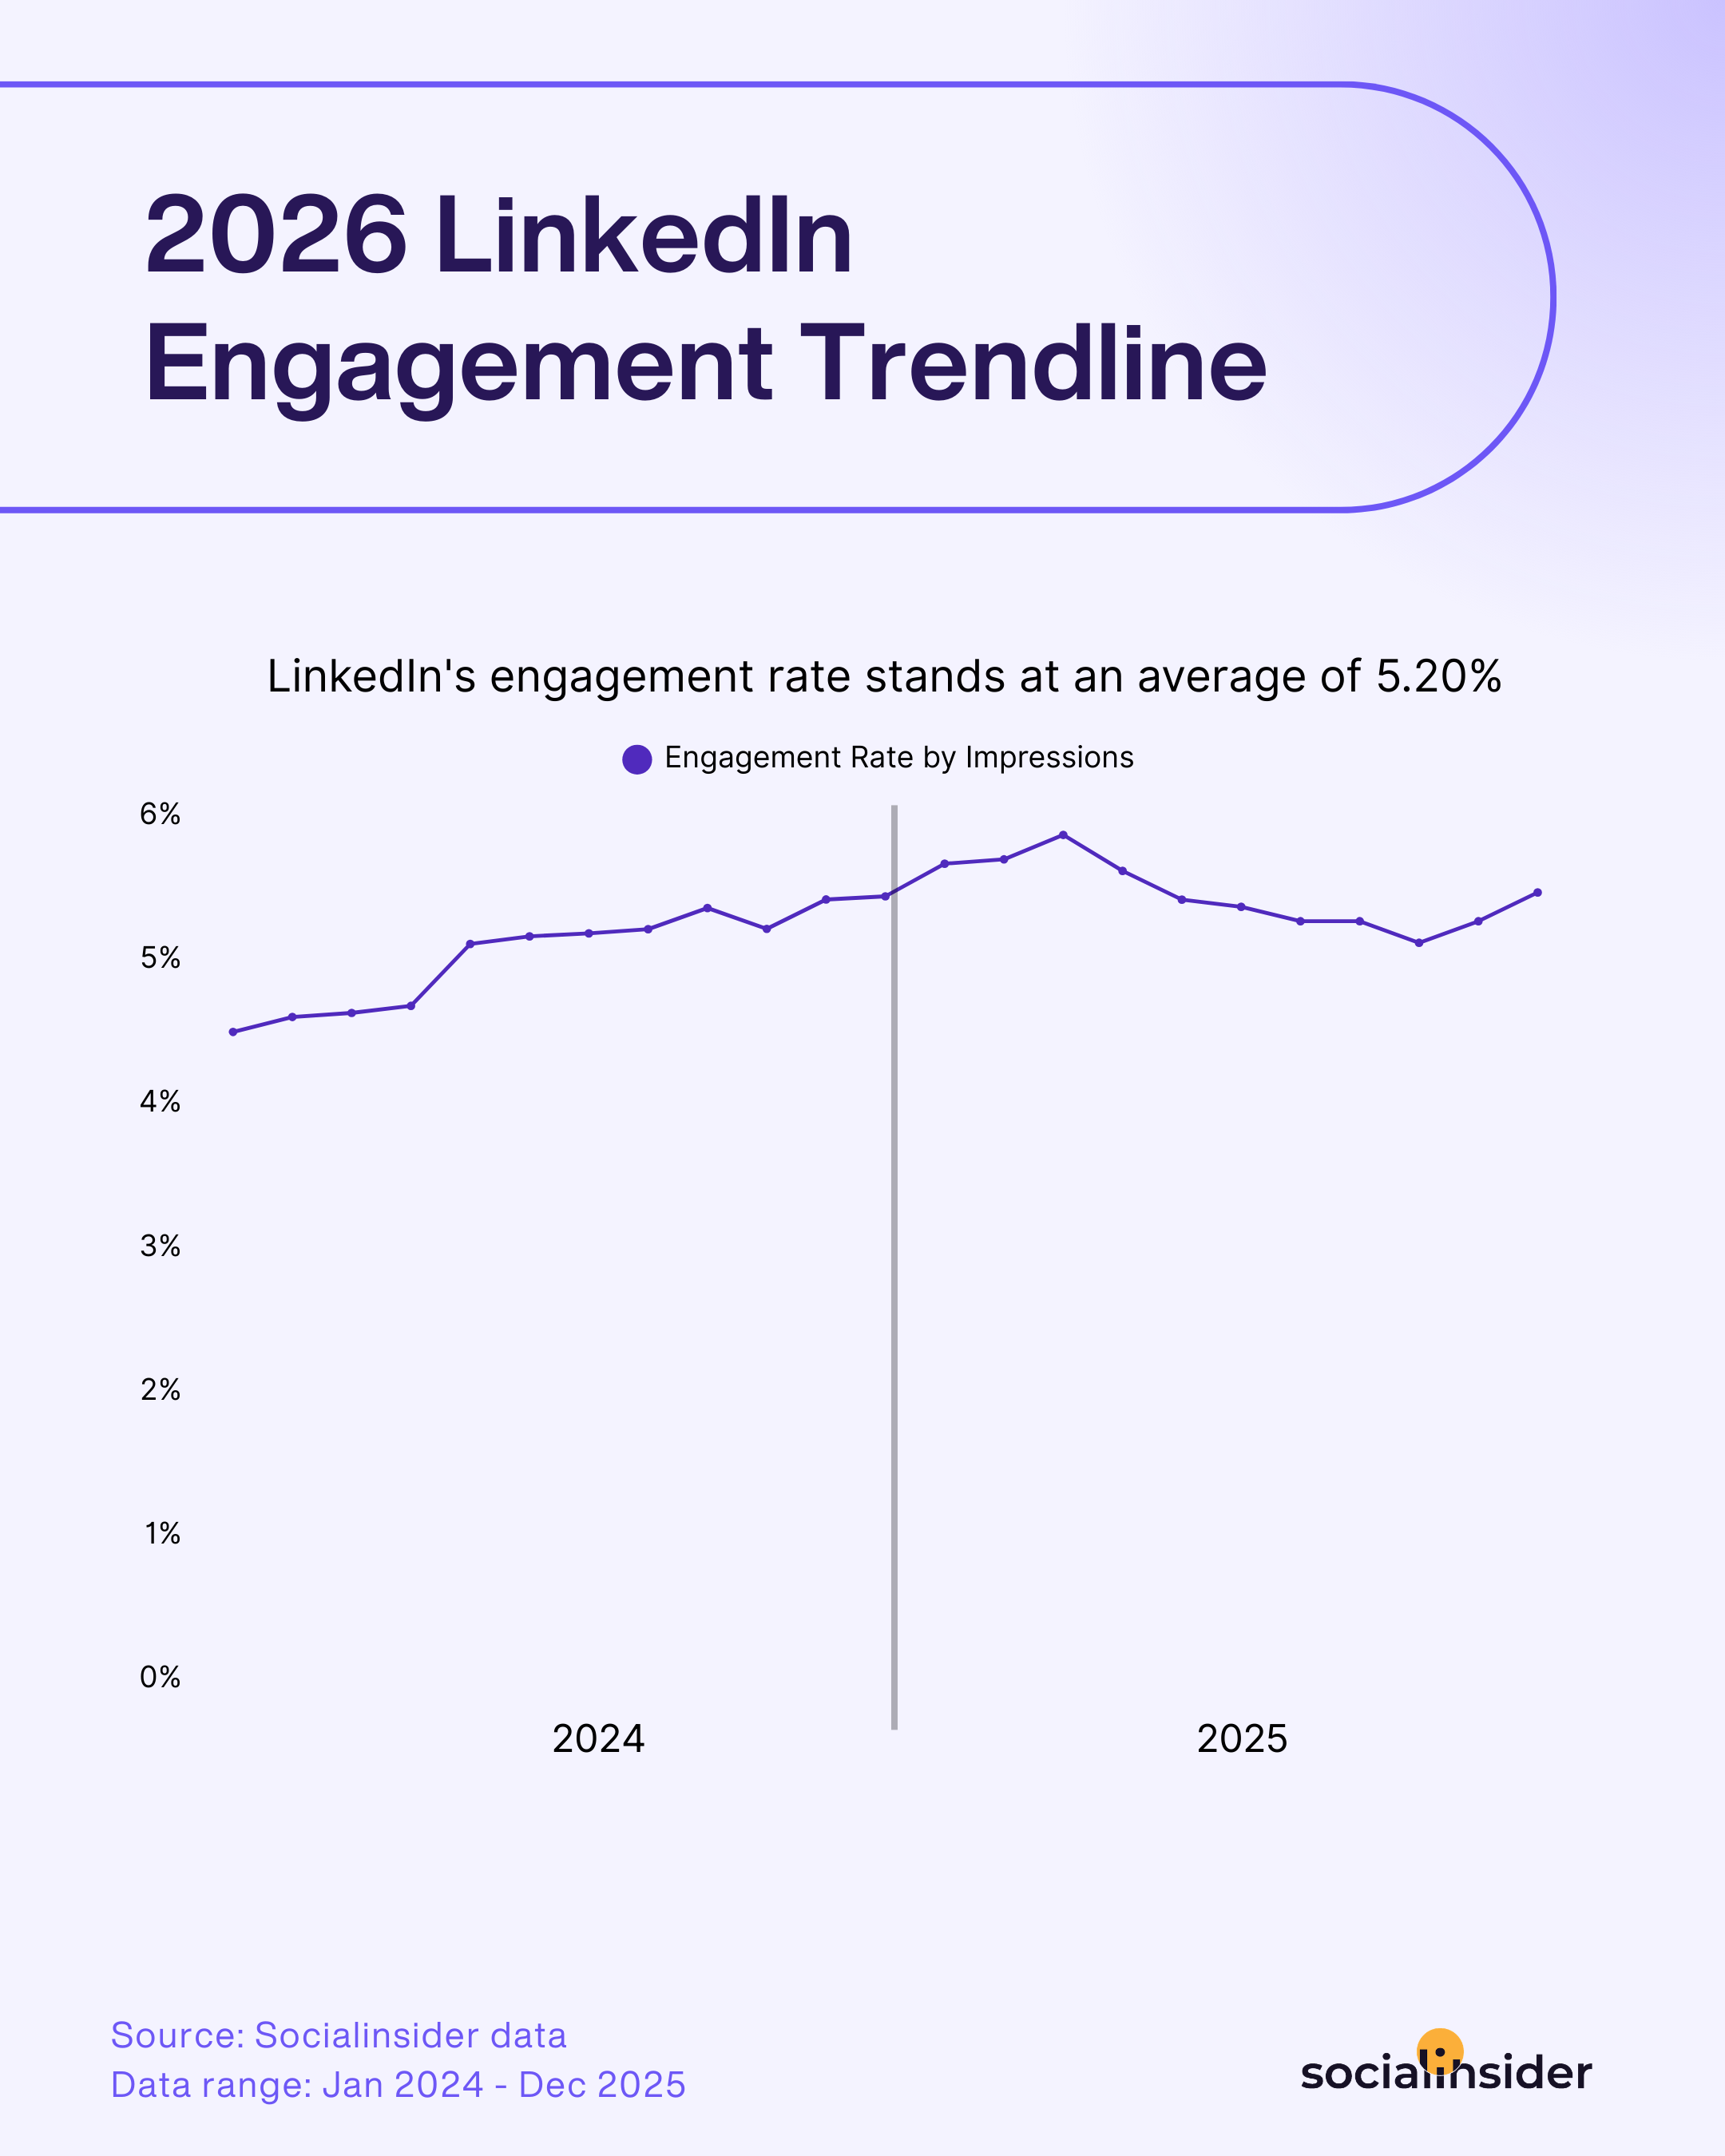
- In 2026, LinkedIn’s engagement rate stands at an average of 5.20%, registering a 8% YoY increase.
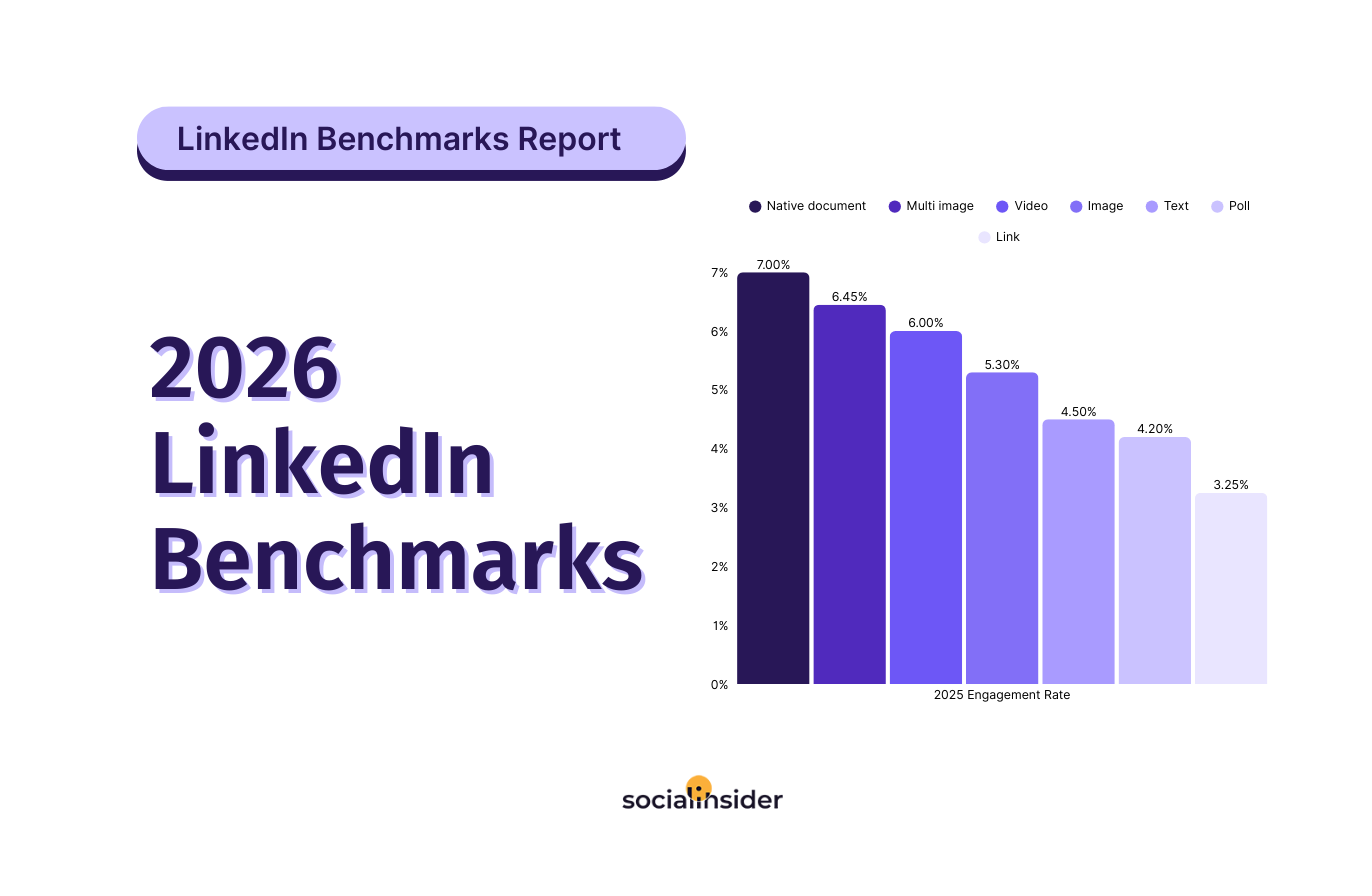
- The native document format leads in engagement, with an average engagement rate of 7.00% and scoring a 14% YoY increase.
- Engagement grew across all formats: videos (+7%), images (+9%), and text posts (+12%).
- Multi-image posts drive more likes across the board.
- Polls perform better for pages with more than 50k followers in terms of impressions.
- While the biggest LinkedIn pages generate the most video views, across all LinkedIn pages, there’s a 36% YoY decline in views.
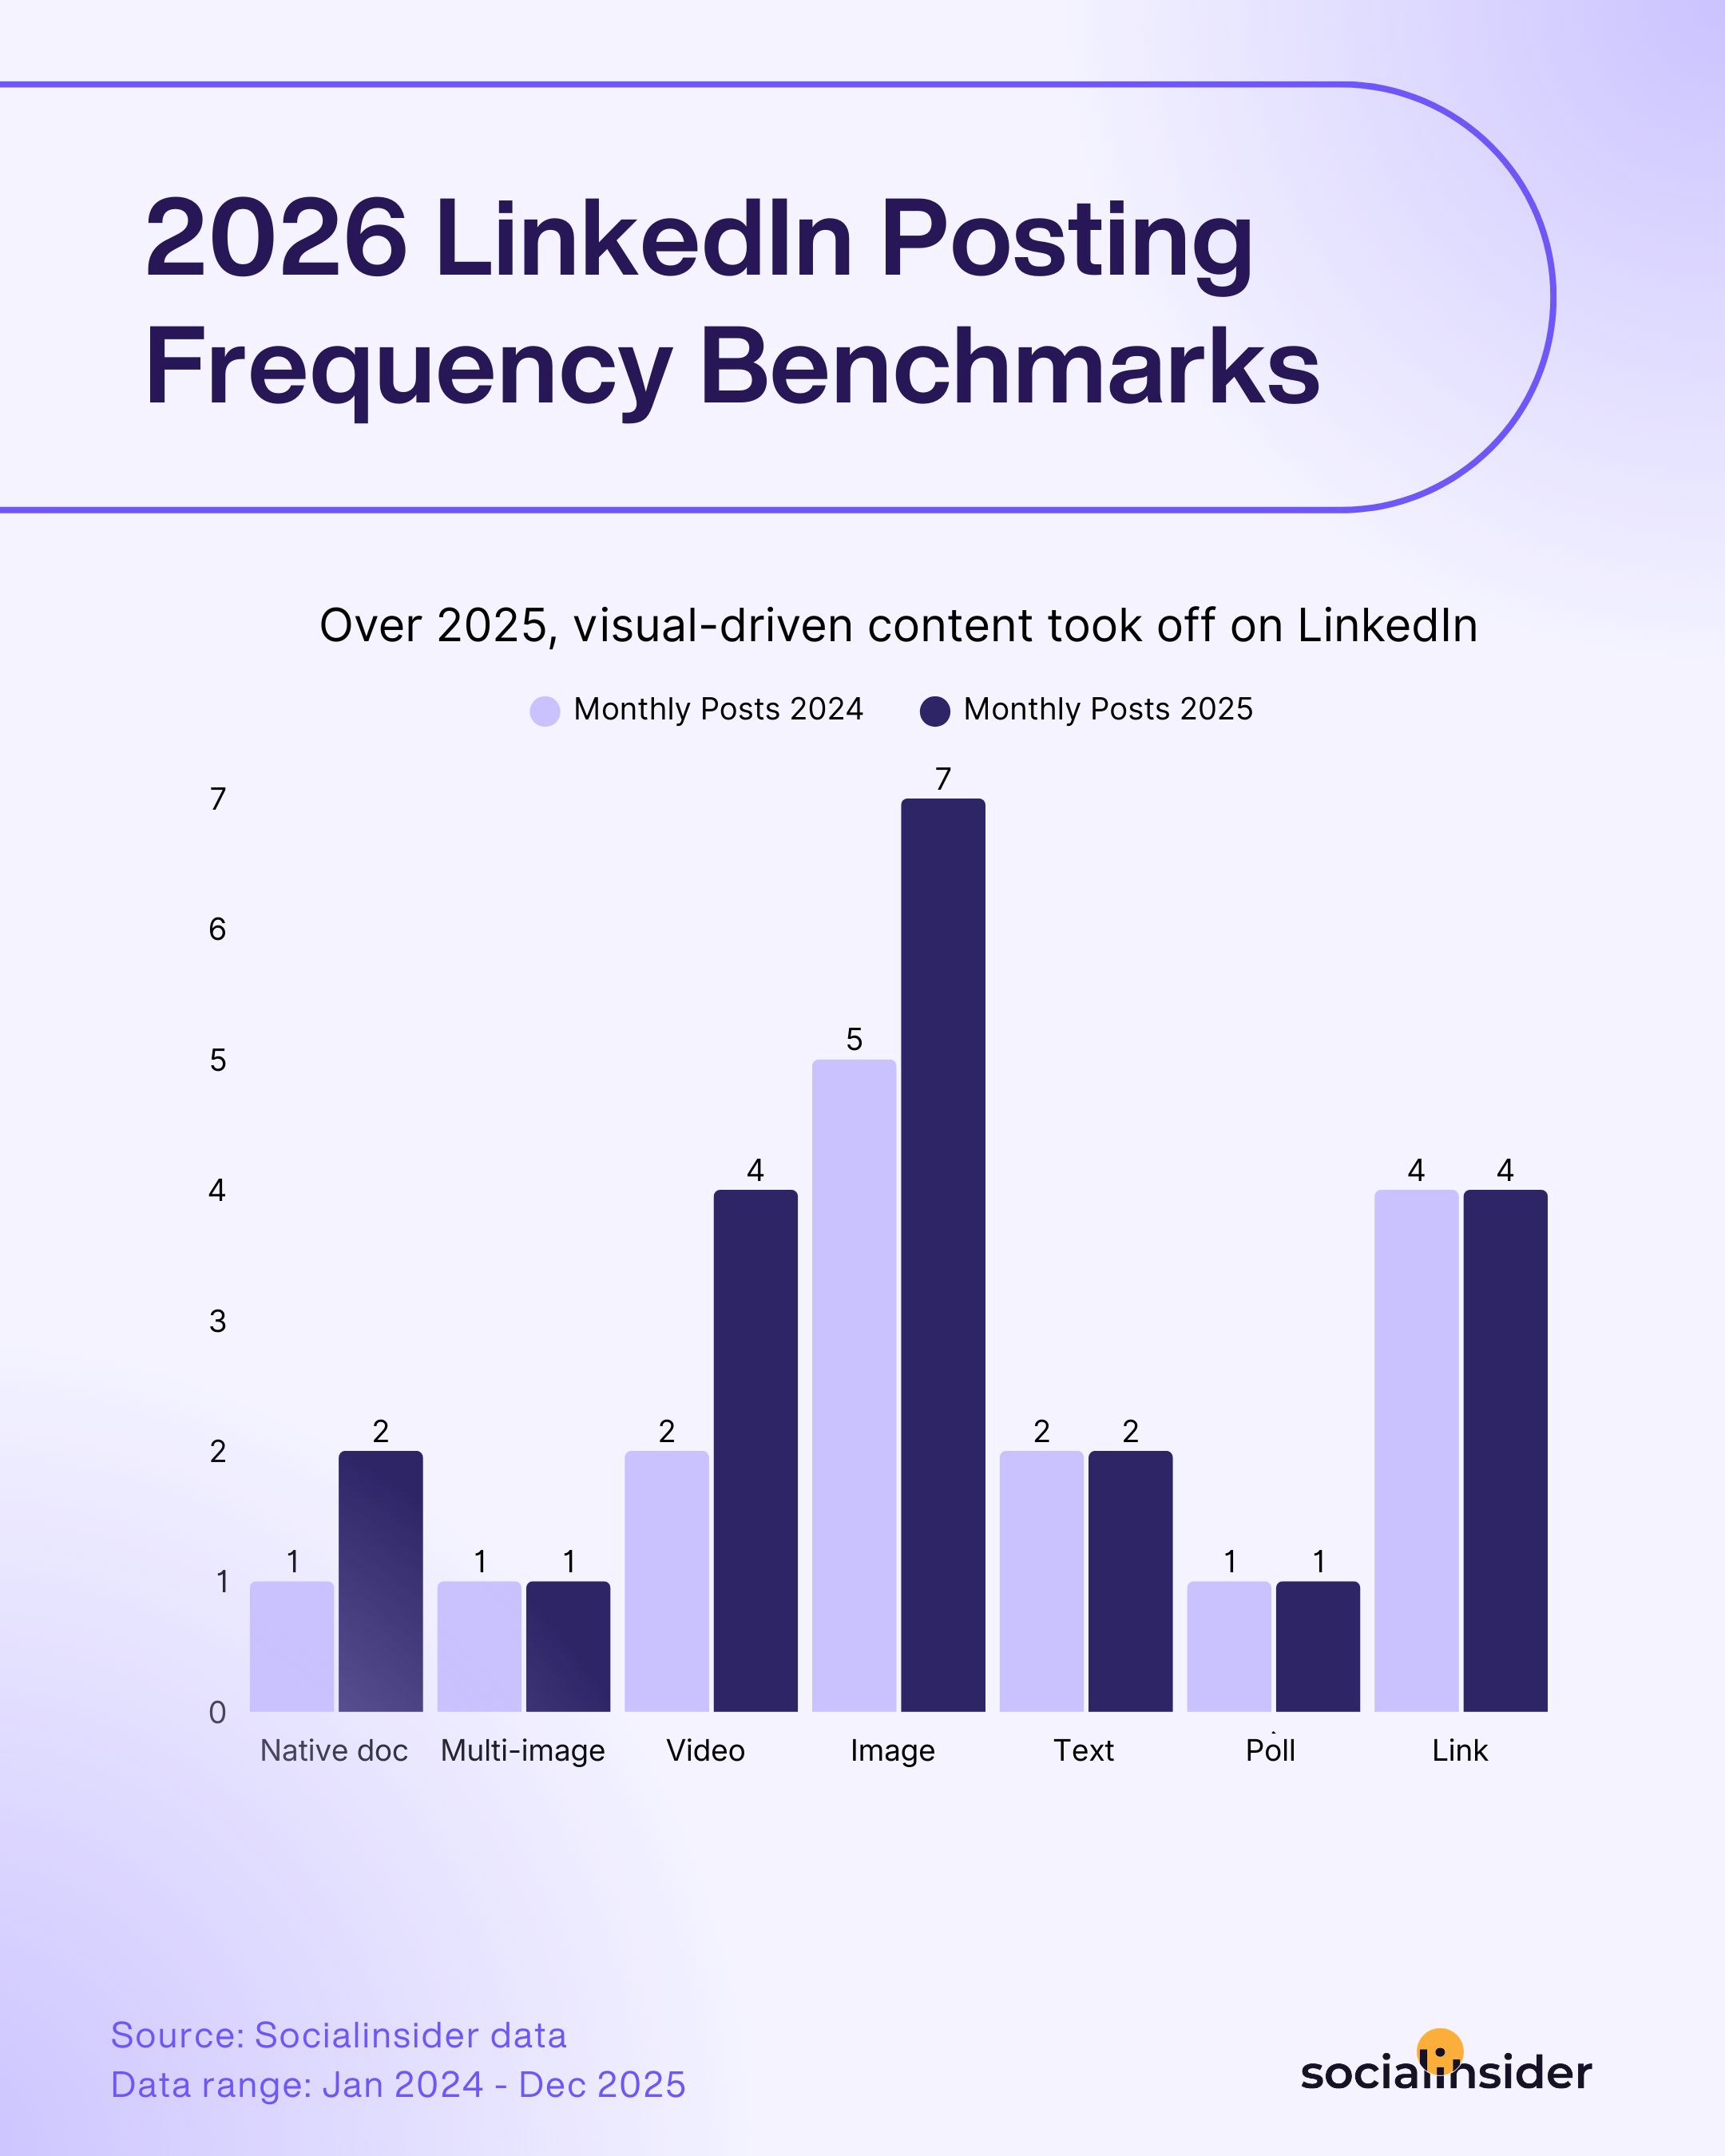
- Over 2025, brands have increased their posting frequency for visual-first content formats.
- LinkedIn audience growth slowed in 2025, particularly for large accounts.
LinkedIn quarterly benchmarks
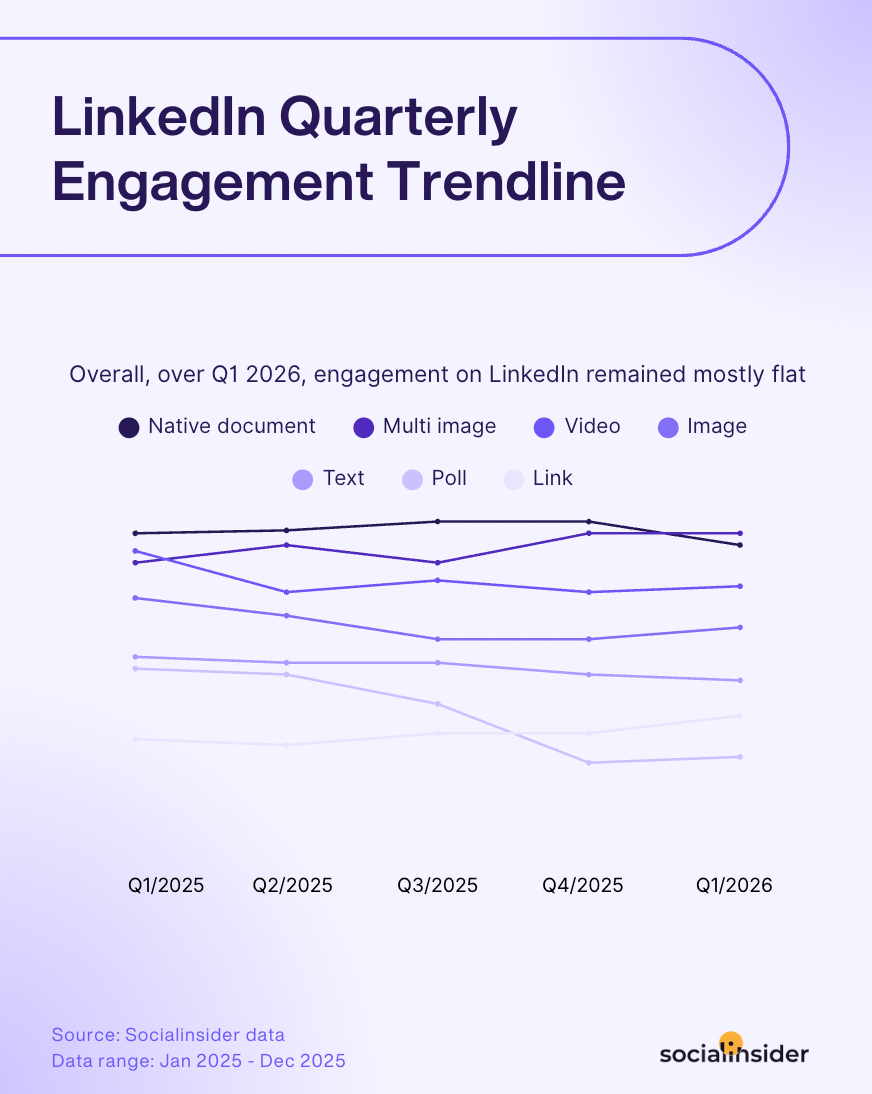
Overall, over the first quarter of 2026, engagement on LinkedIn remained mostly flat.
Looking at the Q1 2026 data, LinkedIn’s engagement landscape remained fairly stable overall, with most content formats seeing only minor fluctuations compared to previous quarters.
For quite some time now, native documents and multi-image posts have consistently outperformed every other content format on LinkedIn, emphasizing that LinkedIn users are engaging most with content that tells a story or delivers value in a more digestible, interactive way.
Whether it’s educational carousels, step-by-step frameworks, industry insights, or personal experiences broken down into slides, users seem far more willing to engage with content that encourages them to slow down, swipe through, and actually spend time with a post.
Here’s what the data revealed, related to each content type’s performance:
- Native documents: Native documents remained one of the best-performing content formats on LinkedIn in Q1 2026.
- Multi-image posts: Multi-image posts maintained a high engagement rate in Q1 2026, holding steady at 6.80% and continuing to prove how effective swipeable storytelling formats have become on LinkedIn.
- Video posts: Video content remained relatively stable in Q1 2026, increasing slightly to a 5.90% average engagement rate compared to the previous quarter.
- Image posts: Image posts saw a small increase in engagement, rising from 5.00% in Q4 2025 to 5.20% in Q1 2026.
- Text posts: Text-only posts registered a small delcine, reaching 4.30% engagement in Q1 2026.
- Poll posts: Polls remained one of the weaker-performing content formats on LinkedIn, despite a slight increase quarter-over-quarter.
- Link posts: Link posts recorded a small uplift in engagement in Q1 2026, increasing to 3.70%, though they still remained among the platform’s lowest-performing content types.
LinkedIn engagement by impressions benchmarks
If there’s one thing I’ve noticed working in the marketing world—it’s that nothing stands still for long. The platforms we use (and even the way people interact with content) are in constant evolution.
Every now and then, the social platforms surprise us with new patterns and best practices, often rewriting our ideas of “what works” for engagement.
Looking at this year’s LinkedIn engagement benchmarks, one trend feels especially clear: audiences are craving substance and depth more than ever. But let’s take it one trend at a time.
To set the stage, LinkedIn’s overall engagement rate currently averages 5.20%, providing a useful reference point as we explore which formats and strategies outperform the norm.
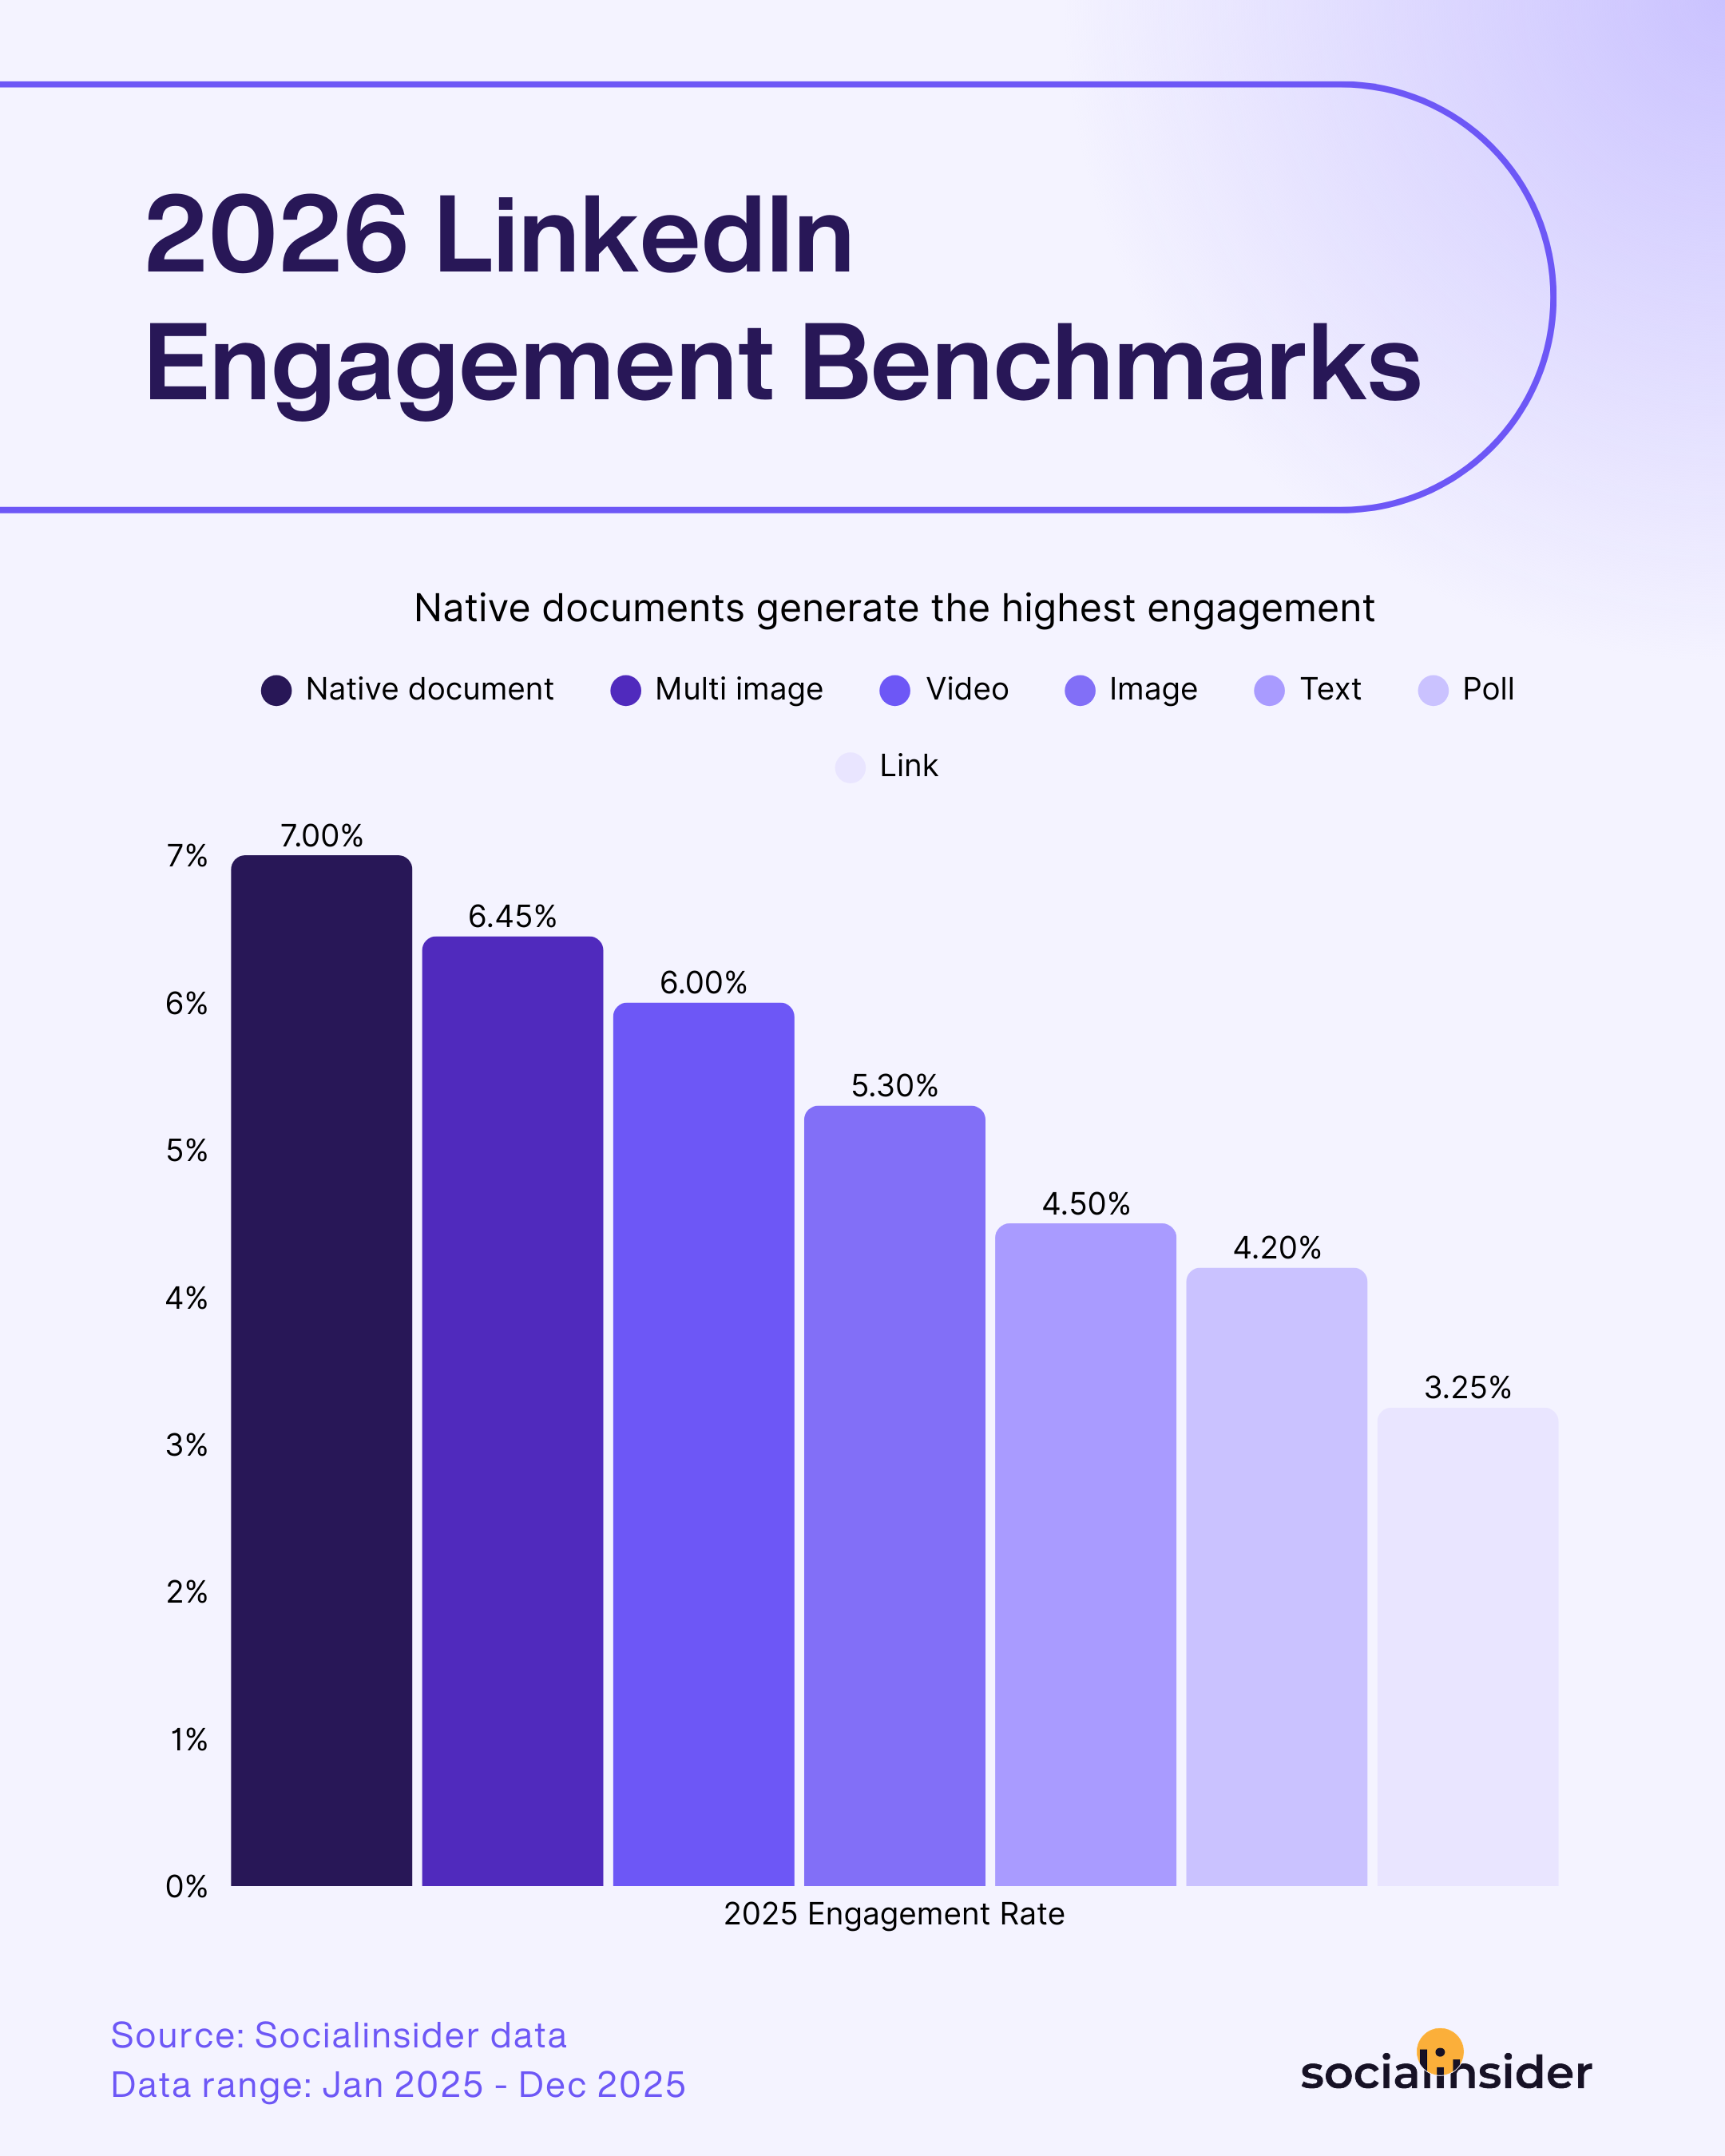
When looking at the top-performing content format on LinkedIn, native documents have pulled ahead to claim the top spot, scoring a LinkedIn average engagement rate of 7.00%, and a 14% YoY increase in performance.
Document posts perform well because they behave like ‘free value’ on a platform where people actively want to learn. LinkedIn is one of the few social platforms where audiences are genuinely looking for practical takeaways (reports, frameworks, templates etc) Document work great because they’re downloadable. People can save them and actually use them later (templates, checklists, frameworks) and they’re very UX-friendly. The carousel format makes it easy to scan. — Julia Holmqvist, Social Media Manager, Semrush
So, the key takeaway here? Users are rewarding brands and professionals who take the time to share original resources, research, and guides.
Additionally, what’s particularly interesting for me to see is that the average engagement rate for LinkedIn rise across other content formats as well, with videos, images, and even simple text posts sparking more reactions—up by 7%, 9%, and 12%, respectively.
This increase in engagement on LinkedIn is because the platform has steadily evolved from a purely professional networking space into a broader content ecosystem where people actively learn, debate, and build personal brands. At the same time, more creators and brands are treating LinkedIn as a primary publishing channel, investing in native storytelling, video, and newsletters, which keeps users on-platform and encourages more frequent interaction – Dylan Patel, Head of Social Media Management, Born Social
Strategic tactics to increase engagement on LinkedIn
- Pivot your strategy more toward native documents: Share timely updates, commentary on industry news, or emerging best practices to spark discussion and signal thought leadership—prompting more users to engage with your content.
- Highlight real-life results or success stories: Share testimonials, case studies, or project outcomes to demonstrate impact, build trust, and invite others to comment or share their own experiences.
- Leverage analytics for long-term success: Monitor which formats are trending up in engagement for your audience and shift your content calendar accordingly to capture peak interest before trends shift again.
One specific content that I have seen contributing to higher engagement on LinkedIn is raw, unpolished behind-the-scenes-type feeling posts. We post 3-6 minute horizontal style clips usually outlining a thought process or framework behind how we approach our work. I think people are starved for simple & helpful information and providing it cleanly in non-thoughtleadery-type posts have showed excellent engagement. — Ian Evans, Social Media Manager, tl;dv
LinkedIn’s average likes per post
One trend that stands out clearly in this year’s Socialinsider LinkedIn data is that there isn’t a one-size-fits-all approach to sparking meaningful engagement. Instead, diversity in content formats remains crucial for maximizing your performance across a range of different interaction types.
Brands shouldn’t be afraid to consistently repurpose content across multiple formats. Meaning, you can take your popular videos, blogs and any other ideas for social and share them out in the carousel document format. Of course you don’t want to put all your eggs in one basket, so continue to keep videos, text-only posts and other creative formats in your content mix. Additionally, you should also invest in creating templates for the document/carousel format to streamline the creation process. — Casey Smith, Senior Social Media Manager, Slack
And if we zoom in for a bit? Here’s what the numbers revealed.
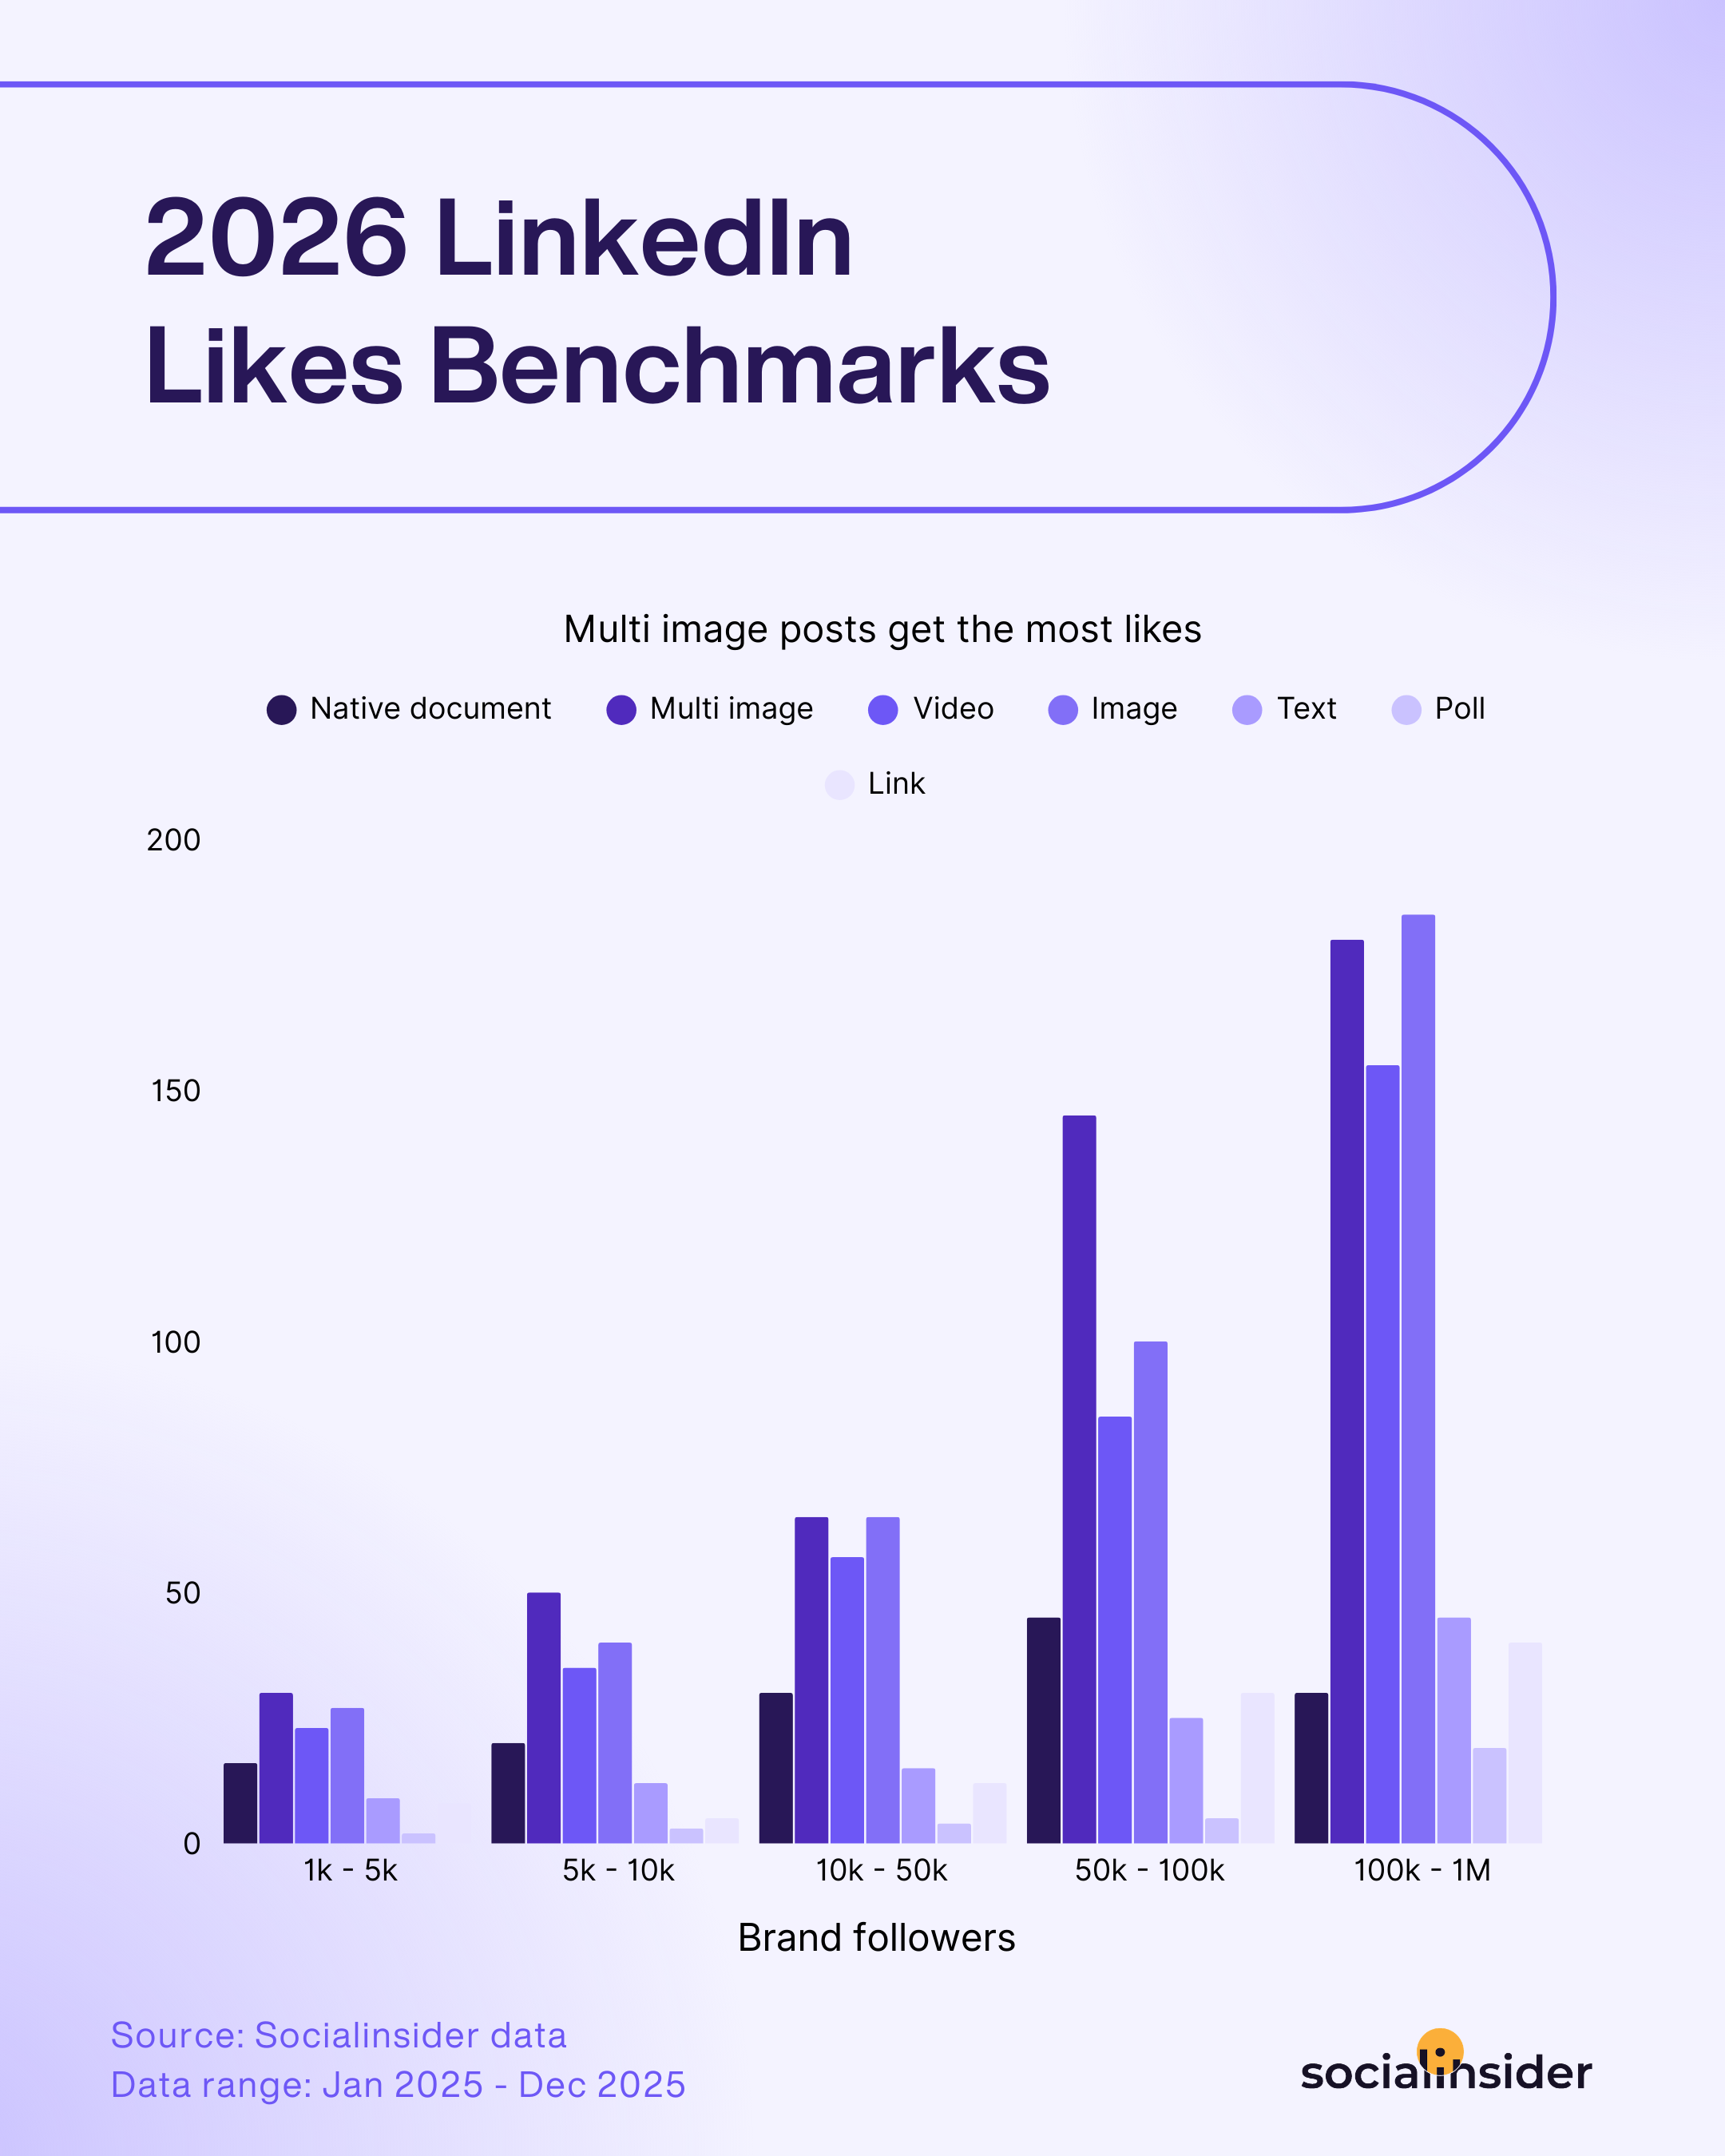
From growing brand pages to long-standing communities, one thing is clear: if boosting likes is your goal, multi-image posts are your best bet. As your LinkedIn follower count increases, the effectiveness of this format only multiplies, making it a top choice for maximizing interactions.
I think in an age dominated by fast-moving video content, multi-image posts, or carousels, seem to engage audiences because they satisfy a part of the brain that is always looking for MORE. People want storytelling, context, and additional layers of information, not just a single image or insight. Carousels allows the poster to deliver content in a way that feels interactive and rewarding. Users can swipe through, uncovering new details, visuals, or messaging at their own pace. This sense of discovery keeps them engaged for longer than a single post might, and encourages more interaction through likes, saves, and comments. — Ivy Mullins, Social Media Manager, Born Social
Strategic tactics to increase your likes on LinkedIn
- Use strong opening visuals and hooks: Start your posts with bold images or compelling headlines to capture attention and motivate users to stop scrolling and acknowledge your content with a like.
- Personalize your messaging: Use tailored language or stories that speak directly to your target audience’s challenges and interests, making your posts more relatable and prompting higher interaction.
- Repurpose popular content: Identify top-performing posts from the past, update or remix them for relevance, and reshare them in new formats to capture fresh engagement without starting from scratch.
Memes! Who says they’re just for Instagram? I’ve seen more and more people (as well as brands) sharing memes on their LinkedIn that are hyper-specific to their industry. People like feeling “seen” in their fields and memes are a great way to relate. — Eileen Mary O’Connell, Senior Social Media Manager, Paramount
LinkedIn’s average impressions per post
So we’ve talked about engagement—a core metric when it comes to evaluating LinkedIn performance. Now, let’s switch to the other important half of the story: impressions.
Metrics like average impressions on LinkedIn reveal how effectively content breaks through and reaches users—serving as a reliable barometer for brand visibility and audience growth.
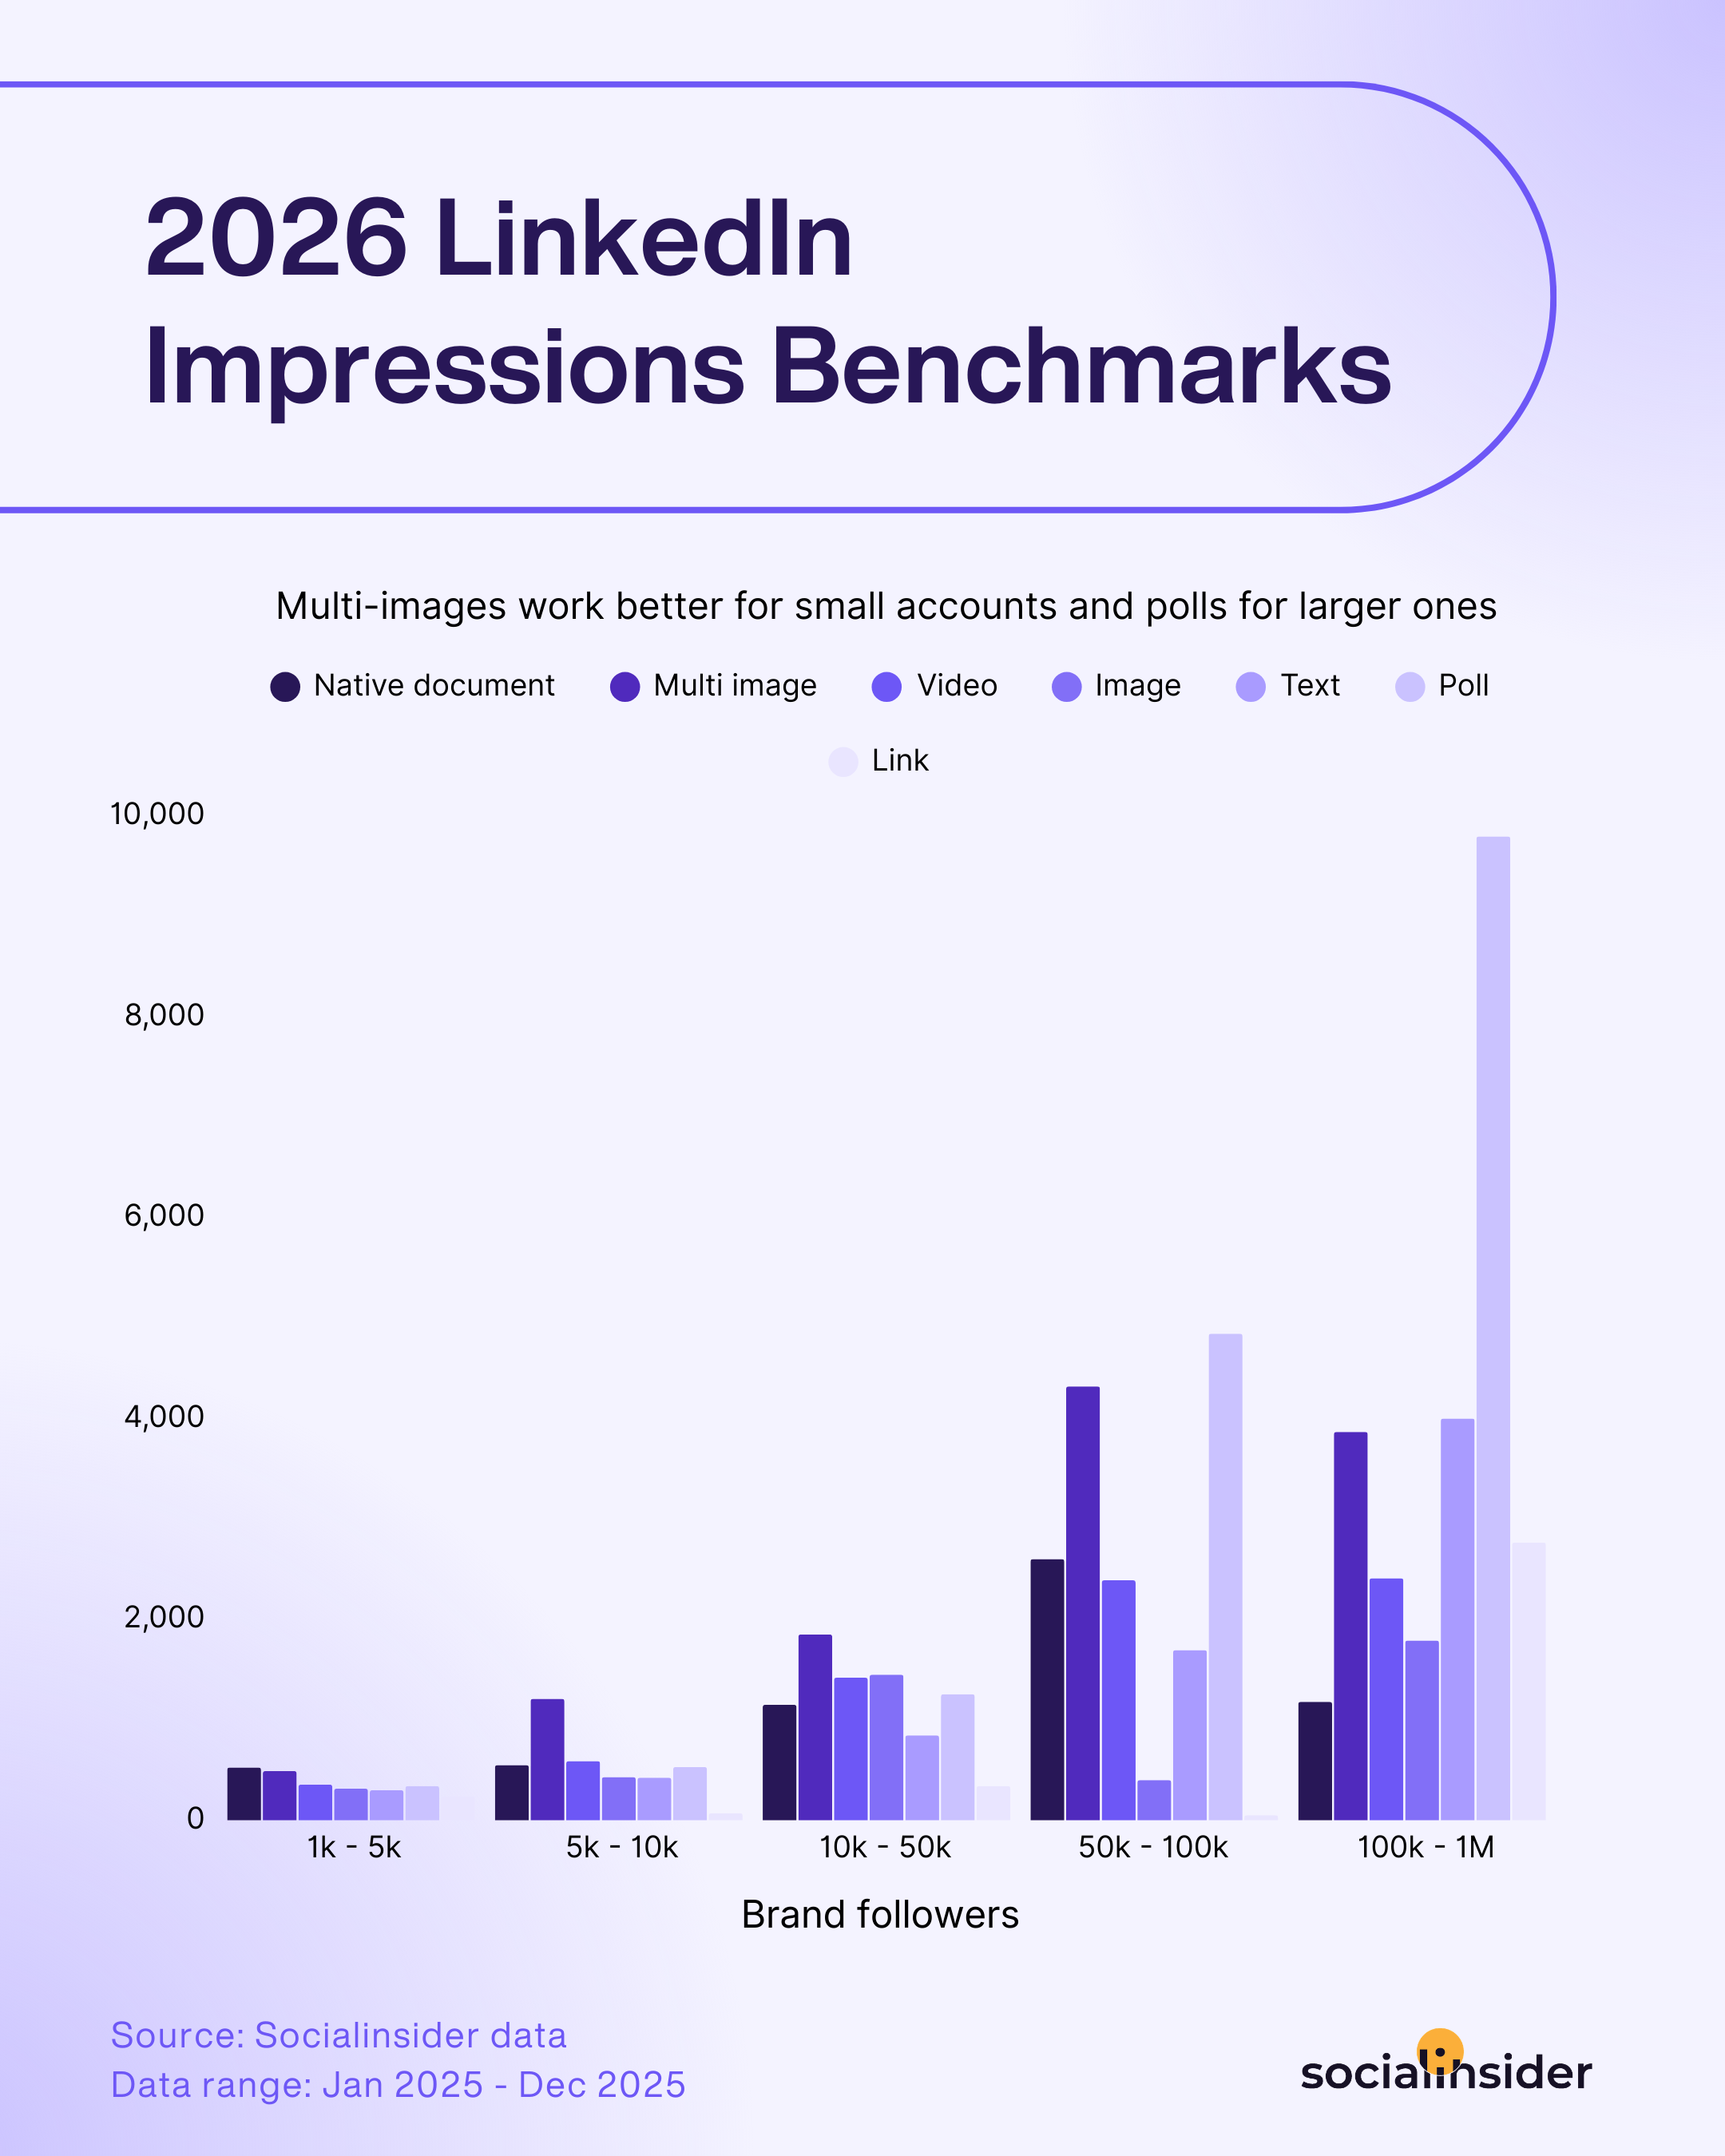
This year’s benchmarks make it clear that content format and page size go hand in hand. For pages with up to 50K followers, multi-image posts consistently generate the highest number of LinkedIn impressions per post, making this post type a highly effective option for expanding reach early in your company’s growth journey.
Multi-image posts work well because they add depth to the story and naturally create curiosity. Much like turning the page in a magazine, newspaper, or book, each slide invites the user to discover what comes next. On LinkedIn, this fits well with how users browse the platform, often between tasks or during short breaks. — Denisa Vlăduță, Senior Social Media Manager
Interestingly, once a page crosses 50K followers, there’s a notable shift: polls become the top-performing format for generating impressions at scale. This change highlights just how important it is to revisit format strategies as your audience expands.
In my experience, polls perform best when it’s a question that the majority of your audience can answer. Meaning, I don’t want to poll people about a niche topic or product that isn’t yet widely adopted. Instead, create polls inspired by organic conversations you’ve already seen about your brand, however small. And consider using them for audience feedback - asking what they’d like to see from you. Use these learnings to shape your upcoming content. — Casey Smith, Senior Social Media Manager, Slack
Strategic tactics to increase LinkedIn impressions
- Diversify content formats for reach: Alternate between carousels, polls, and videos, as the data shows certain formats perform best at different audience sizes—using the right format helps amplify impressions.
- Tag relevant people and companies: Appropriately mention industry partners, employees, and collaborators within your posts to boost discoverability and encourage shares from larger networks.
- Encourage employee engagement: Activate your workforce to interact with and amplify your posts—employee reactions and shares can significantly extend a post’s reach beyond your direct followers.
The rise of founder-led branding is encouraging brands to leverage their employees' personal networks as key contributors to their content ecosystem. As we see leaders share more openly about the realities of building careers and companies, the platform has naturally become a space where professionals across industries feel comfortable unpacking their own milestones and experiences. I’d expect we’ll continue to see more voices take to LinkedIn to share perspectives that resonate with an audience eager to engage in professional growth and development. — Eunice Cancino, Social & Content Strategist
LinkedIn’s average views per videos
After looking at engagement and impressions, let’s turn our attention to a format that’s long been seen as a powerhouse on social: video content. While it’s true that the largest LinkedIn pages continue to attract the highest number of video views, the bigger story in this year’s data is a notable shift: views have dropped across every page size, with an average decrease of 36% YoY.
LinkedIn just isn’t a video-first platform. People don’t open LinkedIn to endlessly scroll like they do on TikTok or Instagram. There’s no real discovery engine or FYP that pushes videos far outside your network, so the viral mechanics are very different. LinkedIn was built around professional knowledge sharing: text posts, insights, documents, frameworks. You can tell the platform is trying to add more video, but the product and the user behavior still aren’t really built for it. — Julia Holmqvist, Social Media Manager, Semrush
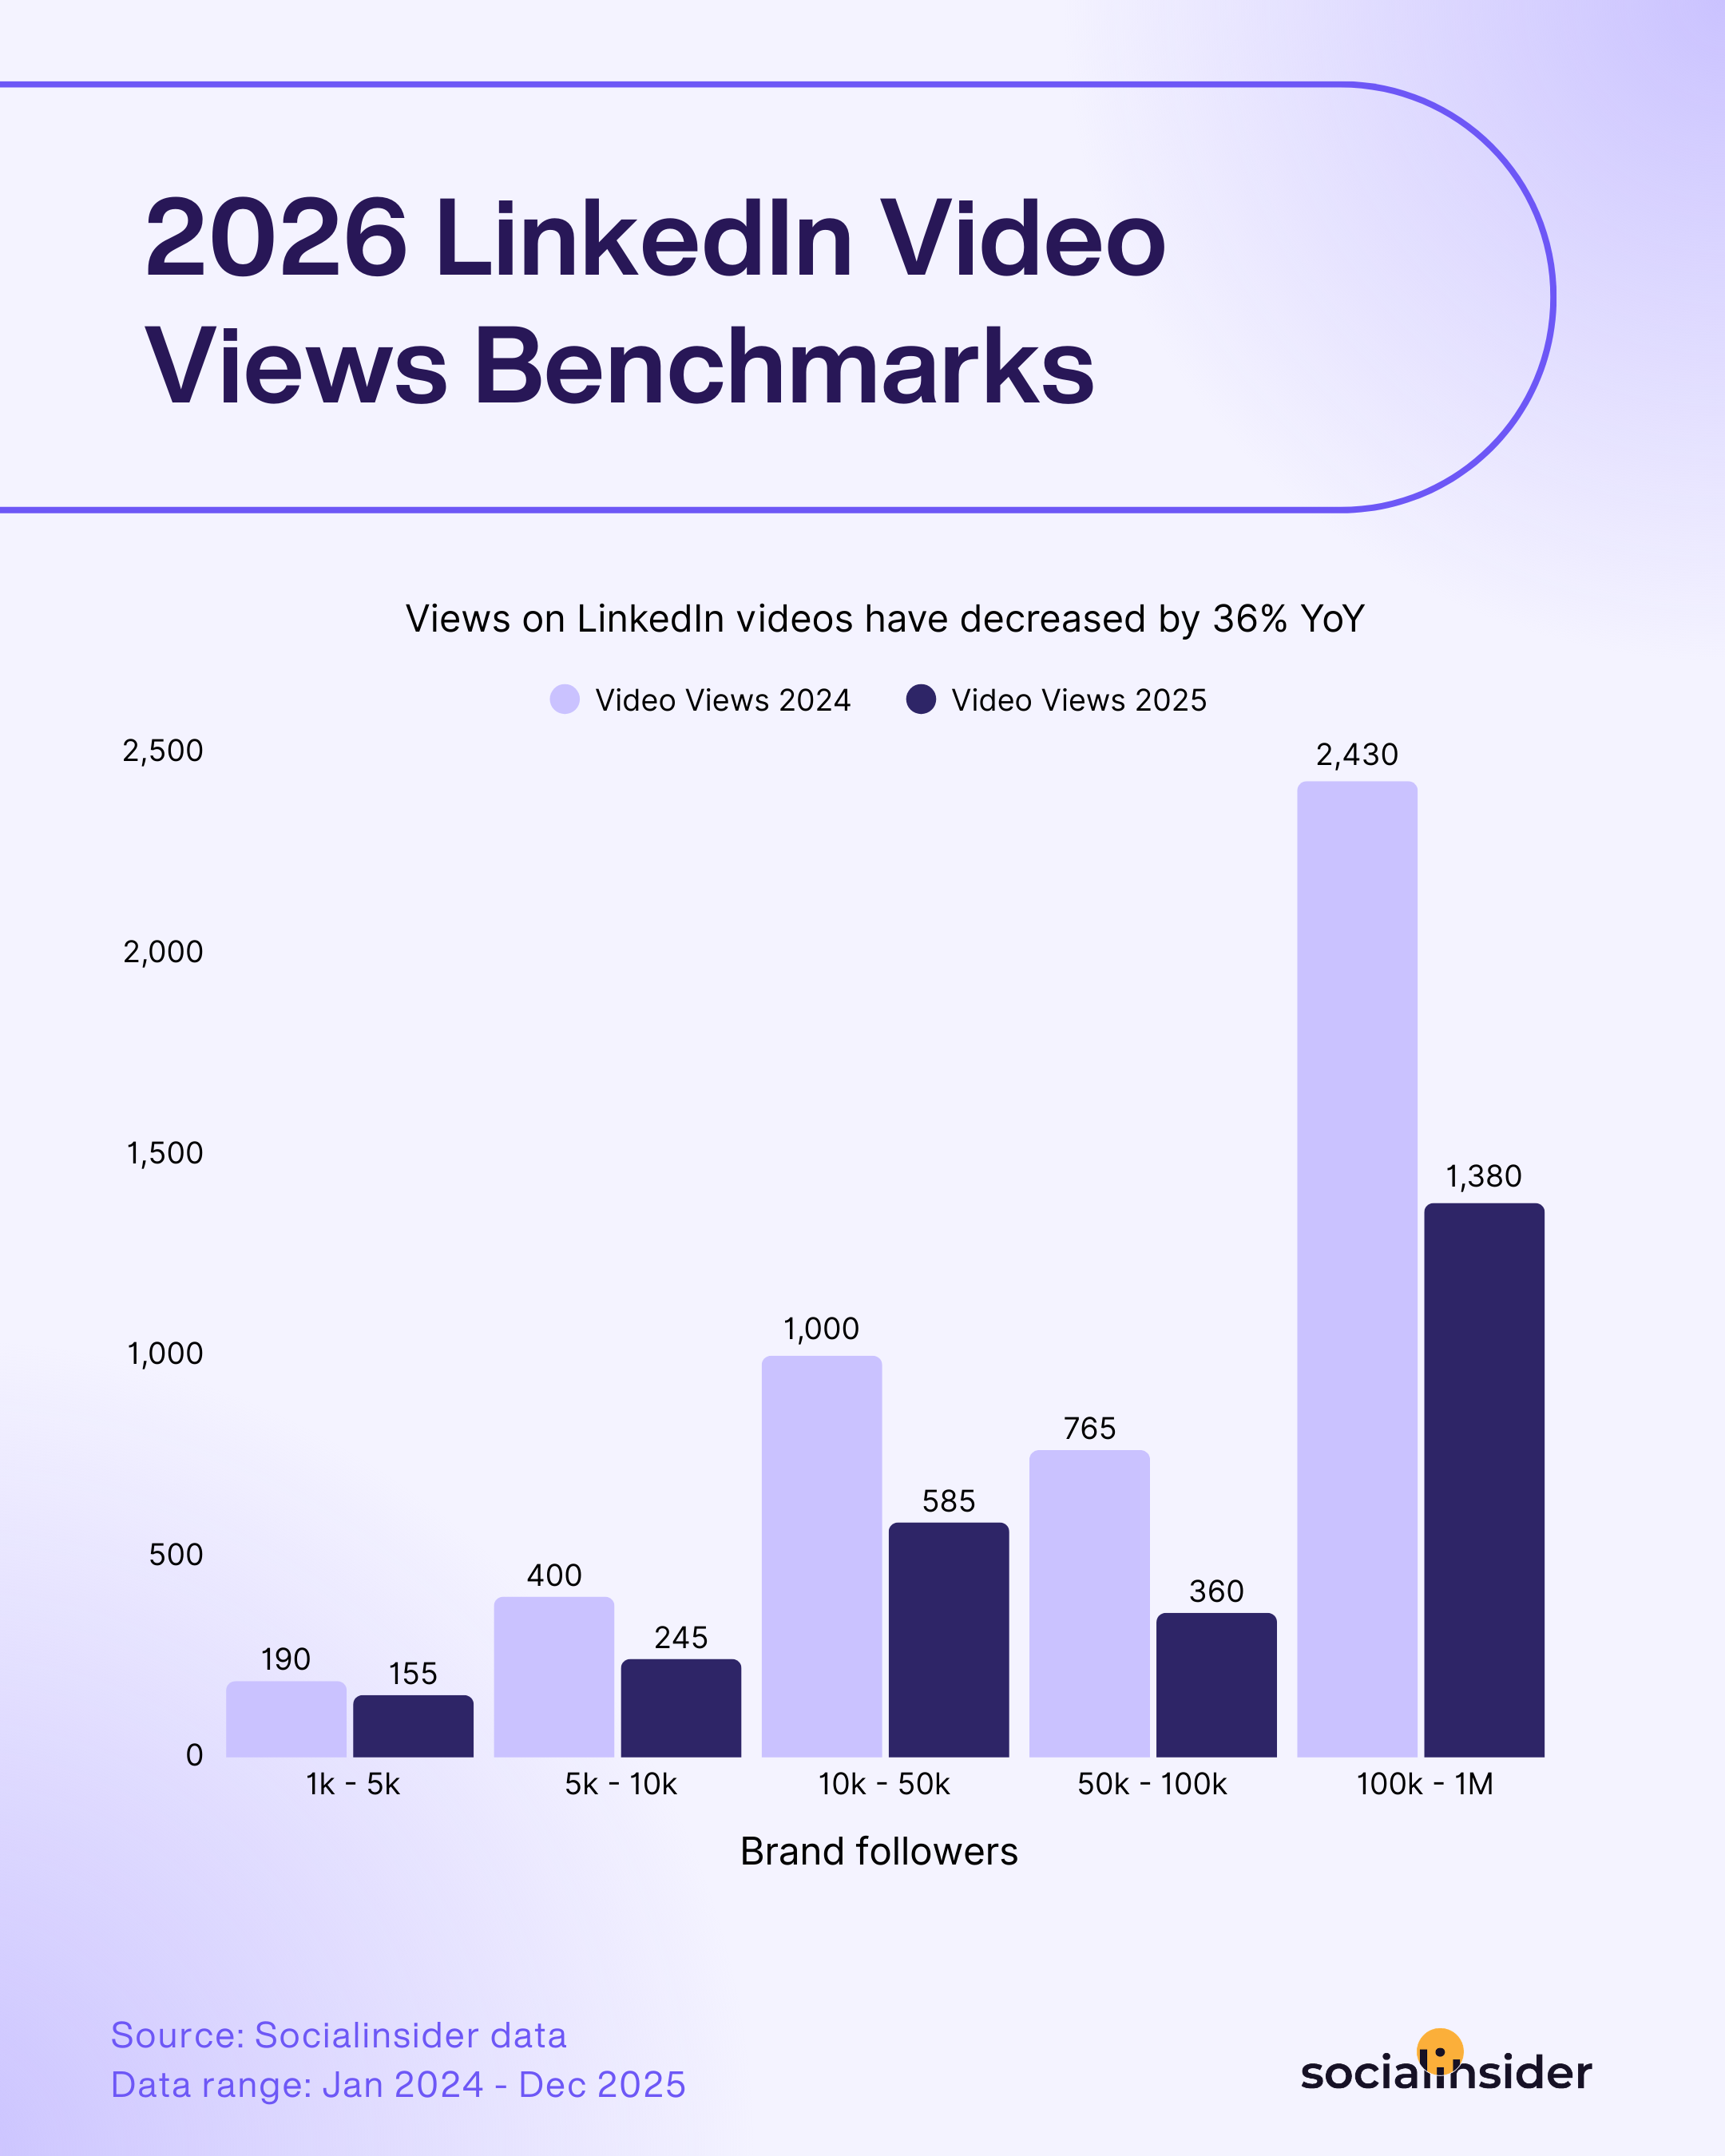
What’s driving this trend? Rising competition and changing user habits are likely having a strong impact on how video content performs, regardless of audience size.
In today’s landscape, ongoing experimentation and fresh creative approaches are more important than ever. Diversifying your content pillars—and paying close attention to where your audience’s interests are shifting—can help ensure your strategy remains resilient.
Strategic tactics to increase your LinkedIn video views
- Pair your video with a descriptive, actionable post summary. A strong supporting text can increase curiosity and encourage users to click play.
- Embed captions and on-screen text: Many users watch on mute. Adding captions and key messages ensures your content is accessible and engaging, boosting completion rates.
- Use video to answer trending or recurring questions: Address common industry challenges or hot topics in a video format, positioning your brand as both responsive and authoritative.
I think a drop may be happening because many creators are bringing the exact same video formats they use on other platforms. While video performs well overall, LinkedIn’s audience likely expects something different.
A lot of the content follows the same structure, hook, insight/value, and call to action. While that formula can work, it’s becoming very saturated. Since people often come to LinkedIn expecting more professional or distinct content, seeing the same patterns they see elsewhere may reduce engagement. — Fernando J, Senior Content Strategist
LinkedIn posting frequency benchmarks
As I look at LinkedIn’s posting frequency benchmarks, another piece of the platform’s evolving patterns comes into focus. Over 2025, brands have made a deliberate move to post more frequently—especially when it comes to visual-first formats.
The numbers tell an interesting story: image posts and videos are seeing the biggest increase, with average monthly image content rising from 5 to 7 posts, and video frequency doubling from 2 to 4 posts per month. Even native documents have seen a subtle boost in presence on feeds, doubling on average compared to the previous year.
If you ask me, I’d say this trend highlights a broader shift—that brands are investing more in formats that capture attention quickly and encourage users to interact.
Strategic tactics to create a high-performing LinkedIn content strategy
- Batch-create content in advance: Dedicate specific days each month to create and schedule posts, making it easier to maintain a consistent, higher frequency without last-minute stress.
- Document your processes and templates: Create templates for different post types (announcements, tips, client stories) and document best practices, making it easy for anyone on your team to produce content quickly.
- Maintain an ‘ideas bank’: Keep a central shared document or digital board where anyone can drop potential post ideas or inspiration as they arise for quick reference and less brainstorming pressure.
LinkedIn audience growth benchmarks
Growth is becoming more challenging across all social platforms these days, and LinkedIn is no exception. In 2025, the average LinkedIn follower growth rates slowed noticeably for pages of every size, a trend that’s especially apparent among large accounts.
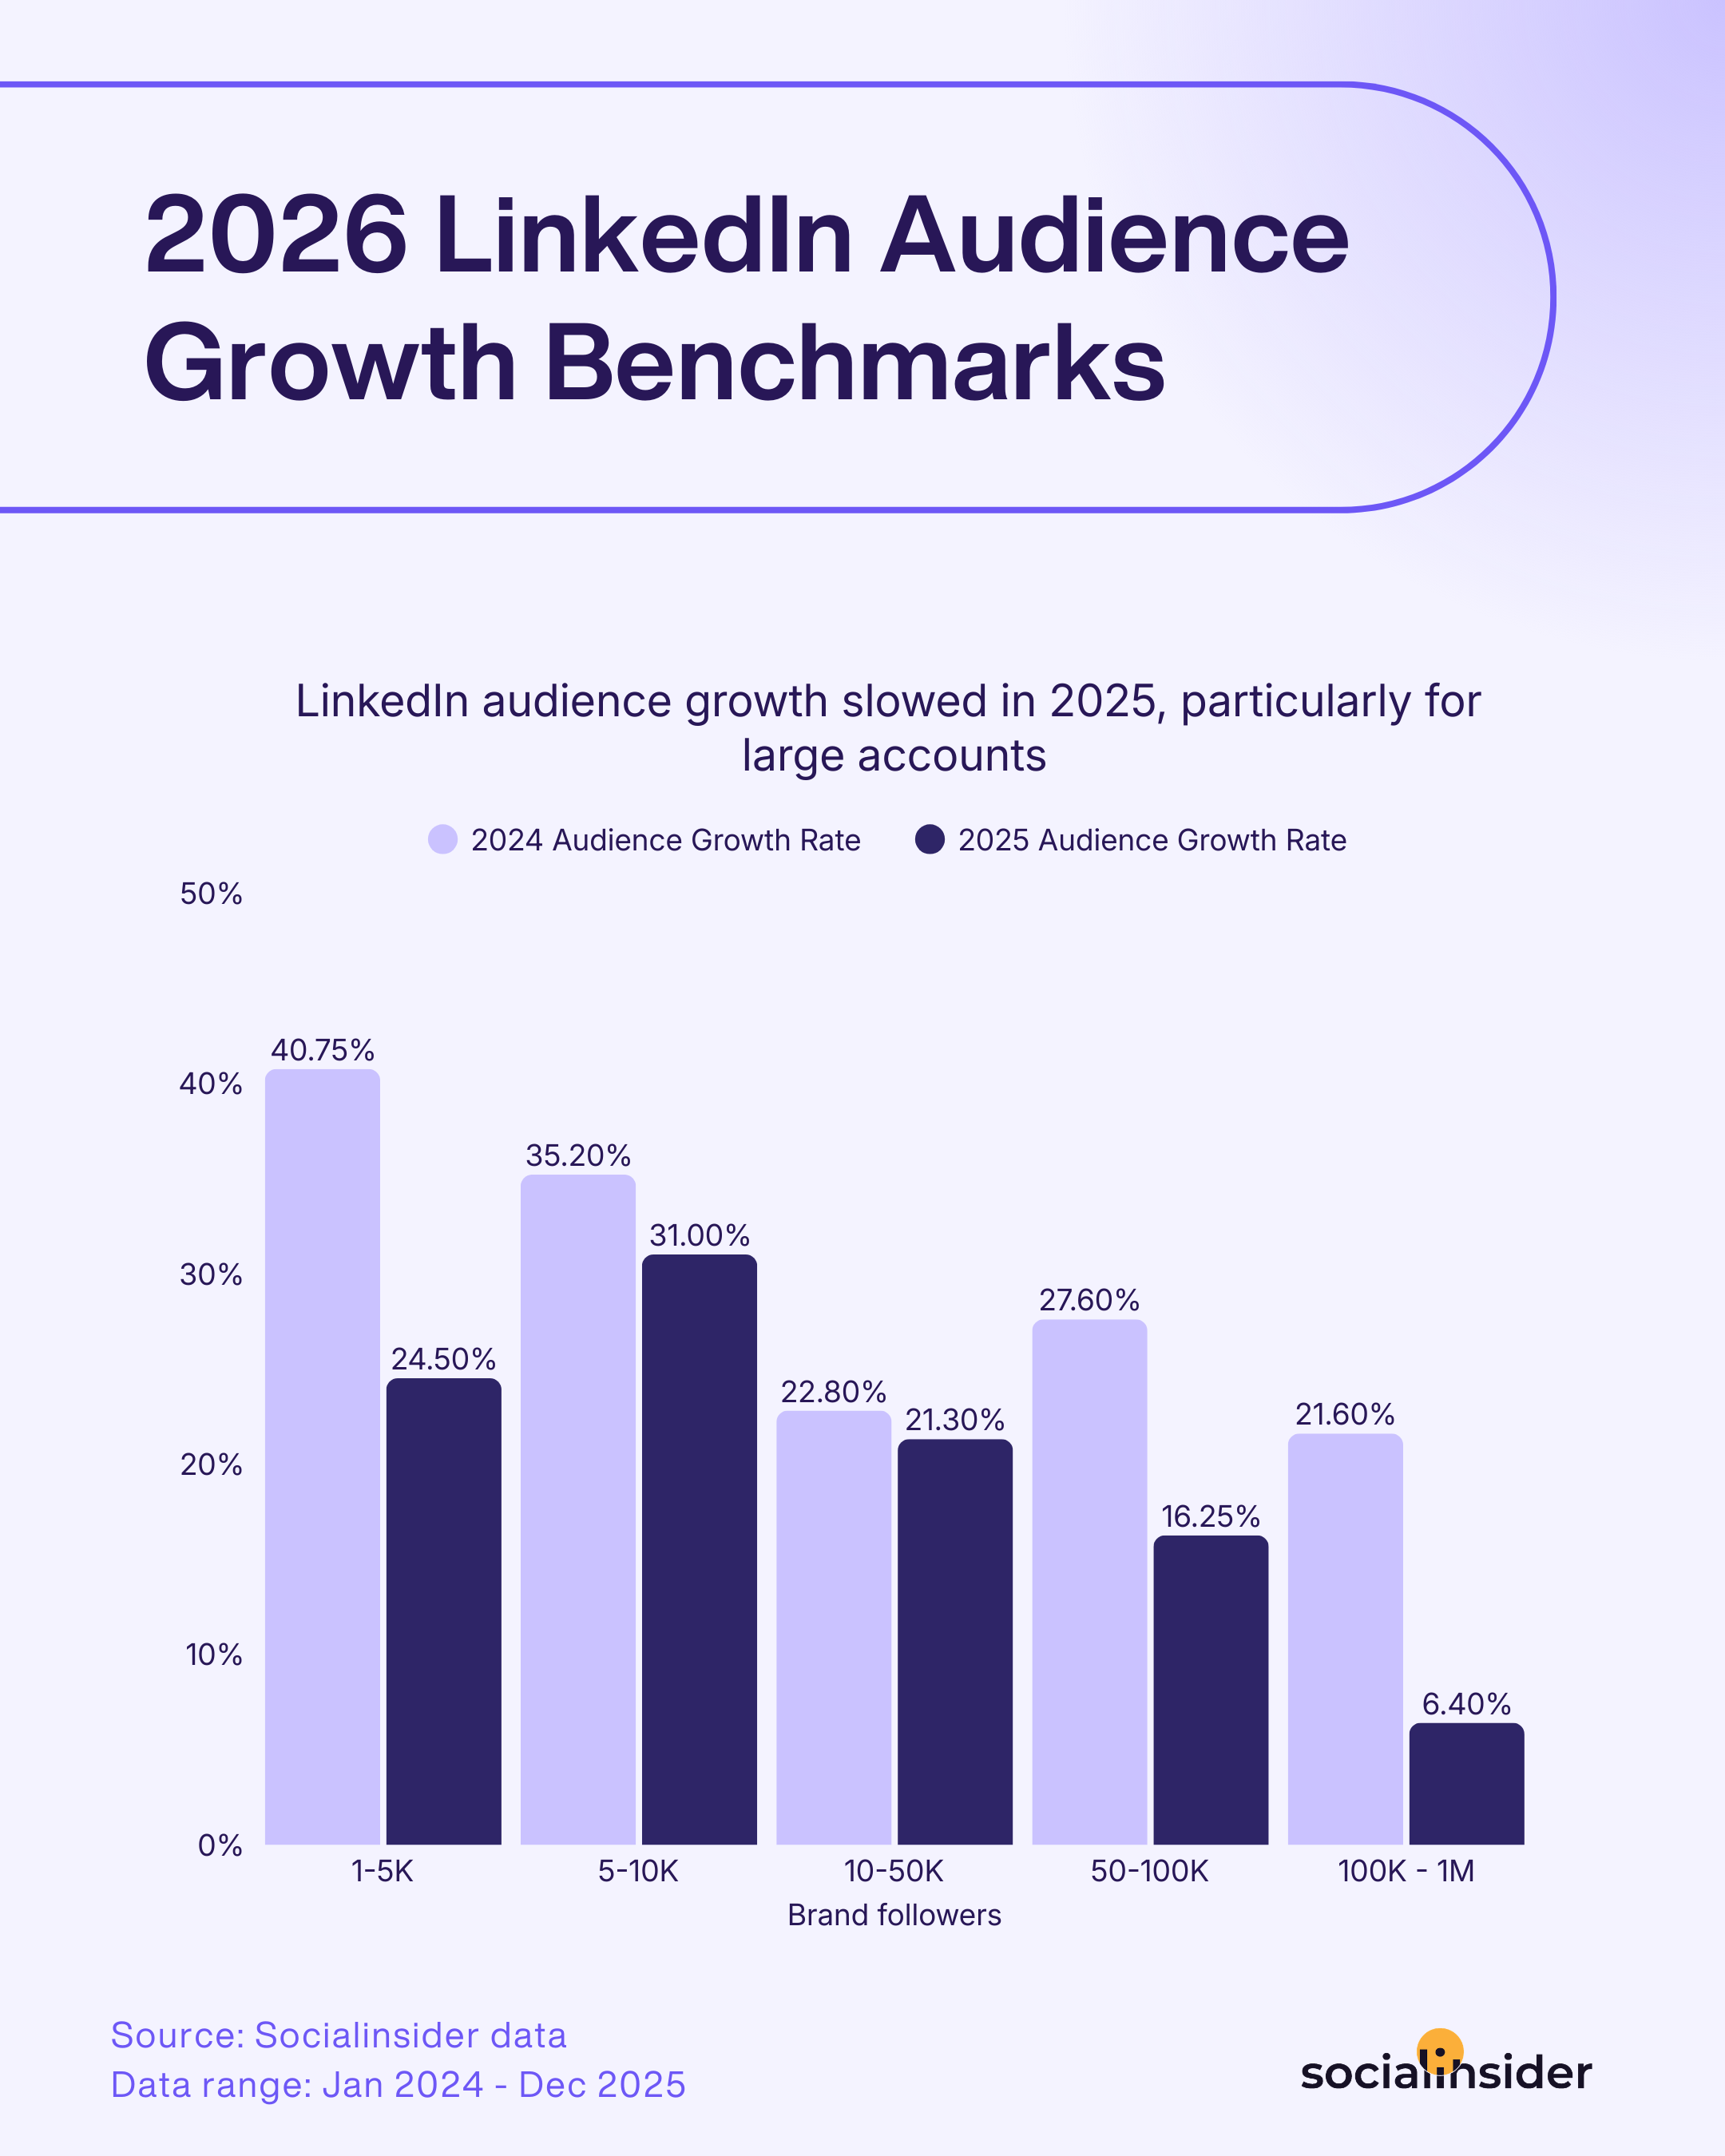
While smaller pages (those with 1-5K followers) still saw a respectable average growth rate of 24.5%, for accounts with 100K to 1M followers, growth slowed sharply to just 6.4%.
This slowdown is particularly striking for larger communities, showing that expanding an already established audience now requires more effort and strategic thinking than ever before.
The brands that continue to find success—and maintain a healthy LinkedIn growth rate—are those that keep adapting, analyzing results, and delivering content that aligns closely with their audience’s interests.
I attribute this slowdown to ‘career as content’ increasingly becoming a normalised content topic across mainstream social channels, with users integrating their work achievements, career stories and thought leadership onto platforms that were once reserved for personal life highlights. The rise of employee-generated content has blurred the lines between acceptable and avoidable when it comes to posting about the workplace, with audiences even finding and landing jobs in their own For You Pages or Feeds on platforms like TikTok and Instagram. LinkedIn’s monopoly as the online careers hub is fading, as career conversations and opportunities exist across other social platform giants and users no longer have to flood to the platform as the single source. — Bronte Chandler, Associate Director of Social Media, Born Social
Strategic tactics to grow your audience on LinkedIn
- Launch specialized LinkedIn Live events or webinars: Host exclusive, interactive events (Q&As, interviews, industry panels) and promote them broadly—live content draws new audiences and encourages non-followers to connect.
- Collaborate with industry peers: Partner on co-branded posts, joint campaigns, or shoutouts with complementary brands or professionals, introducing each other’s networks for organic follower expansion.
- Offer ongoing mini-series or expert tips: Start a weekly or bi-weekly educational series with practical advice, giving visitors a recurring reason to follow so they don’t miss the next installment.
Methodology
The findings of this study were based on the analysis of 1.3M LinkedIn posts, collected from 16,645 LinkedIn business pages with an active presence between January 2024 - December 2025.
The content formats references in this analysis consist of the following:
- Native documents: the type of post consisting of a PDF uploaded directly on LinkedIn that is similar to a carousel.
- Multi images: the upload of multiple photos at once, displayed similarly to an album.
- Text posts: LinkedIn posts consisting of a block of text.
- Polls: open for voting questions.
- Image: posts that include the upload of an image.
- Video: posts that include the upload of a video.
We define LinkedIn metrics as follows:
- Engagement rate by impressions: how many people interacted with your LinkedIn posts from those who watched repeatedly. It is calculated by dividing your engagement by impressions, then multiplied by 100. This is the same formula LinkedIn uses.
- Average impressions per post represents the number of impressions a post receives on average.
- Average views per video stands for the average number of views a video gets, on average.
- Average number of posts per month: how many posts pages post on average on LinkedIn
NOTE: This study contains 2025 values, presented as 2026, because, at the time of publication, there wasn't enough data for analysis, with the year just starting. That is why we bring quarterly updates, as the year unfolds and more data is available.
Get in-depth LinkedIn performance metrics
Run an insightful LinkedIn analysis and get strategic content optimization ideas!
Ready to improve your social media strategy with real-time insights?
Get strategic insights, analyze the social performance across all channels, compare metrics from different periods and download reports in seconds.