2026 Organic Facebook Engagement Benchmarks
Get the latest Facebook organic engagement benchmarks to understand its impact in the marketing world and better interpret your own metrics.

One of the questions I hear most often from social media leaders when reviewing their Facebook performance is simple: “are these numbers actually good?”
Because metrics on their own—engagement, views, comments, or follower growth—don’t mean much without context. This is exactly where Facebook organic benchmarks come into play. They help turn raw numbers into meaningful insights when reporting performance to stakeholders.
At Socialinsider, I analyzed 25M Facebook posts, coming from more than 130K business pages, to understand how brands are currently performing on the platform. The report looks at key indicators such as Facebook engagement rate benchmarks, content formats, interactions, posting frequency, and the Facebook follow
Executive summary
- Facebook’s average engagement rate currently sits at 0.15%, staying flat YoY.
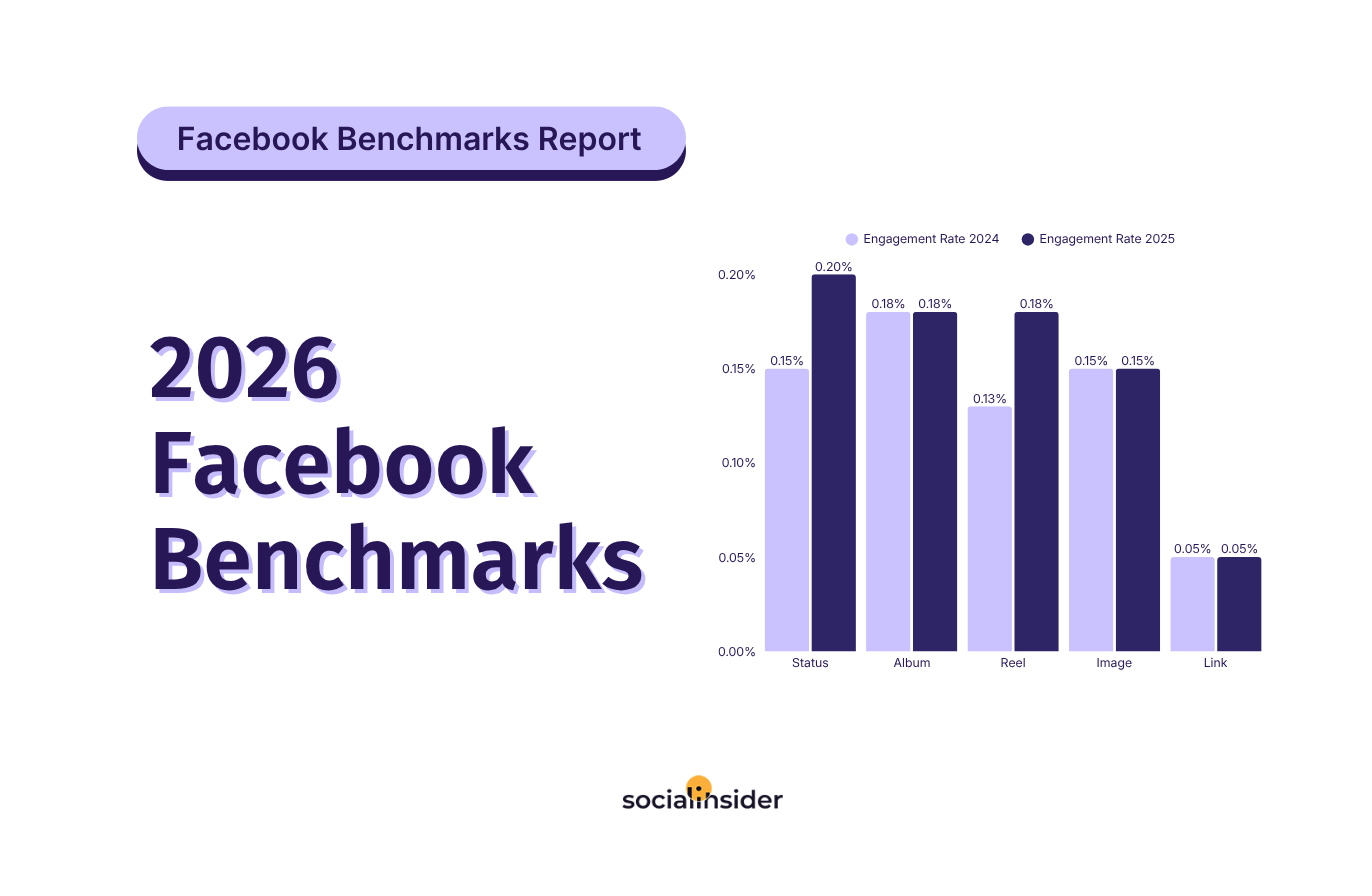
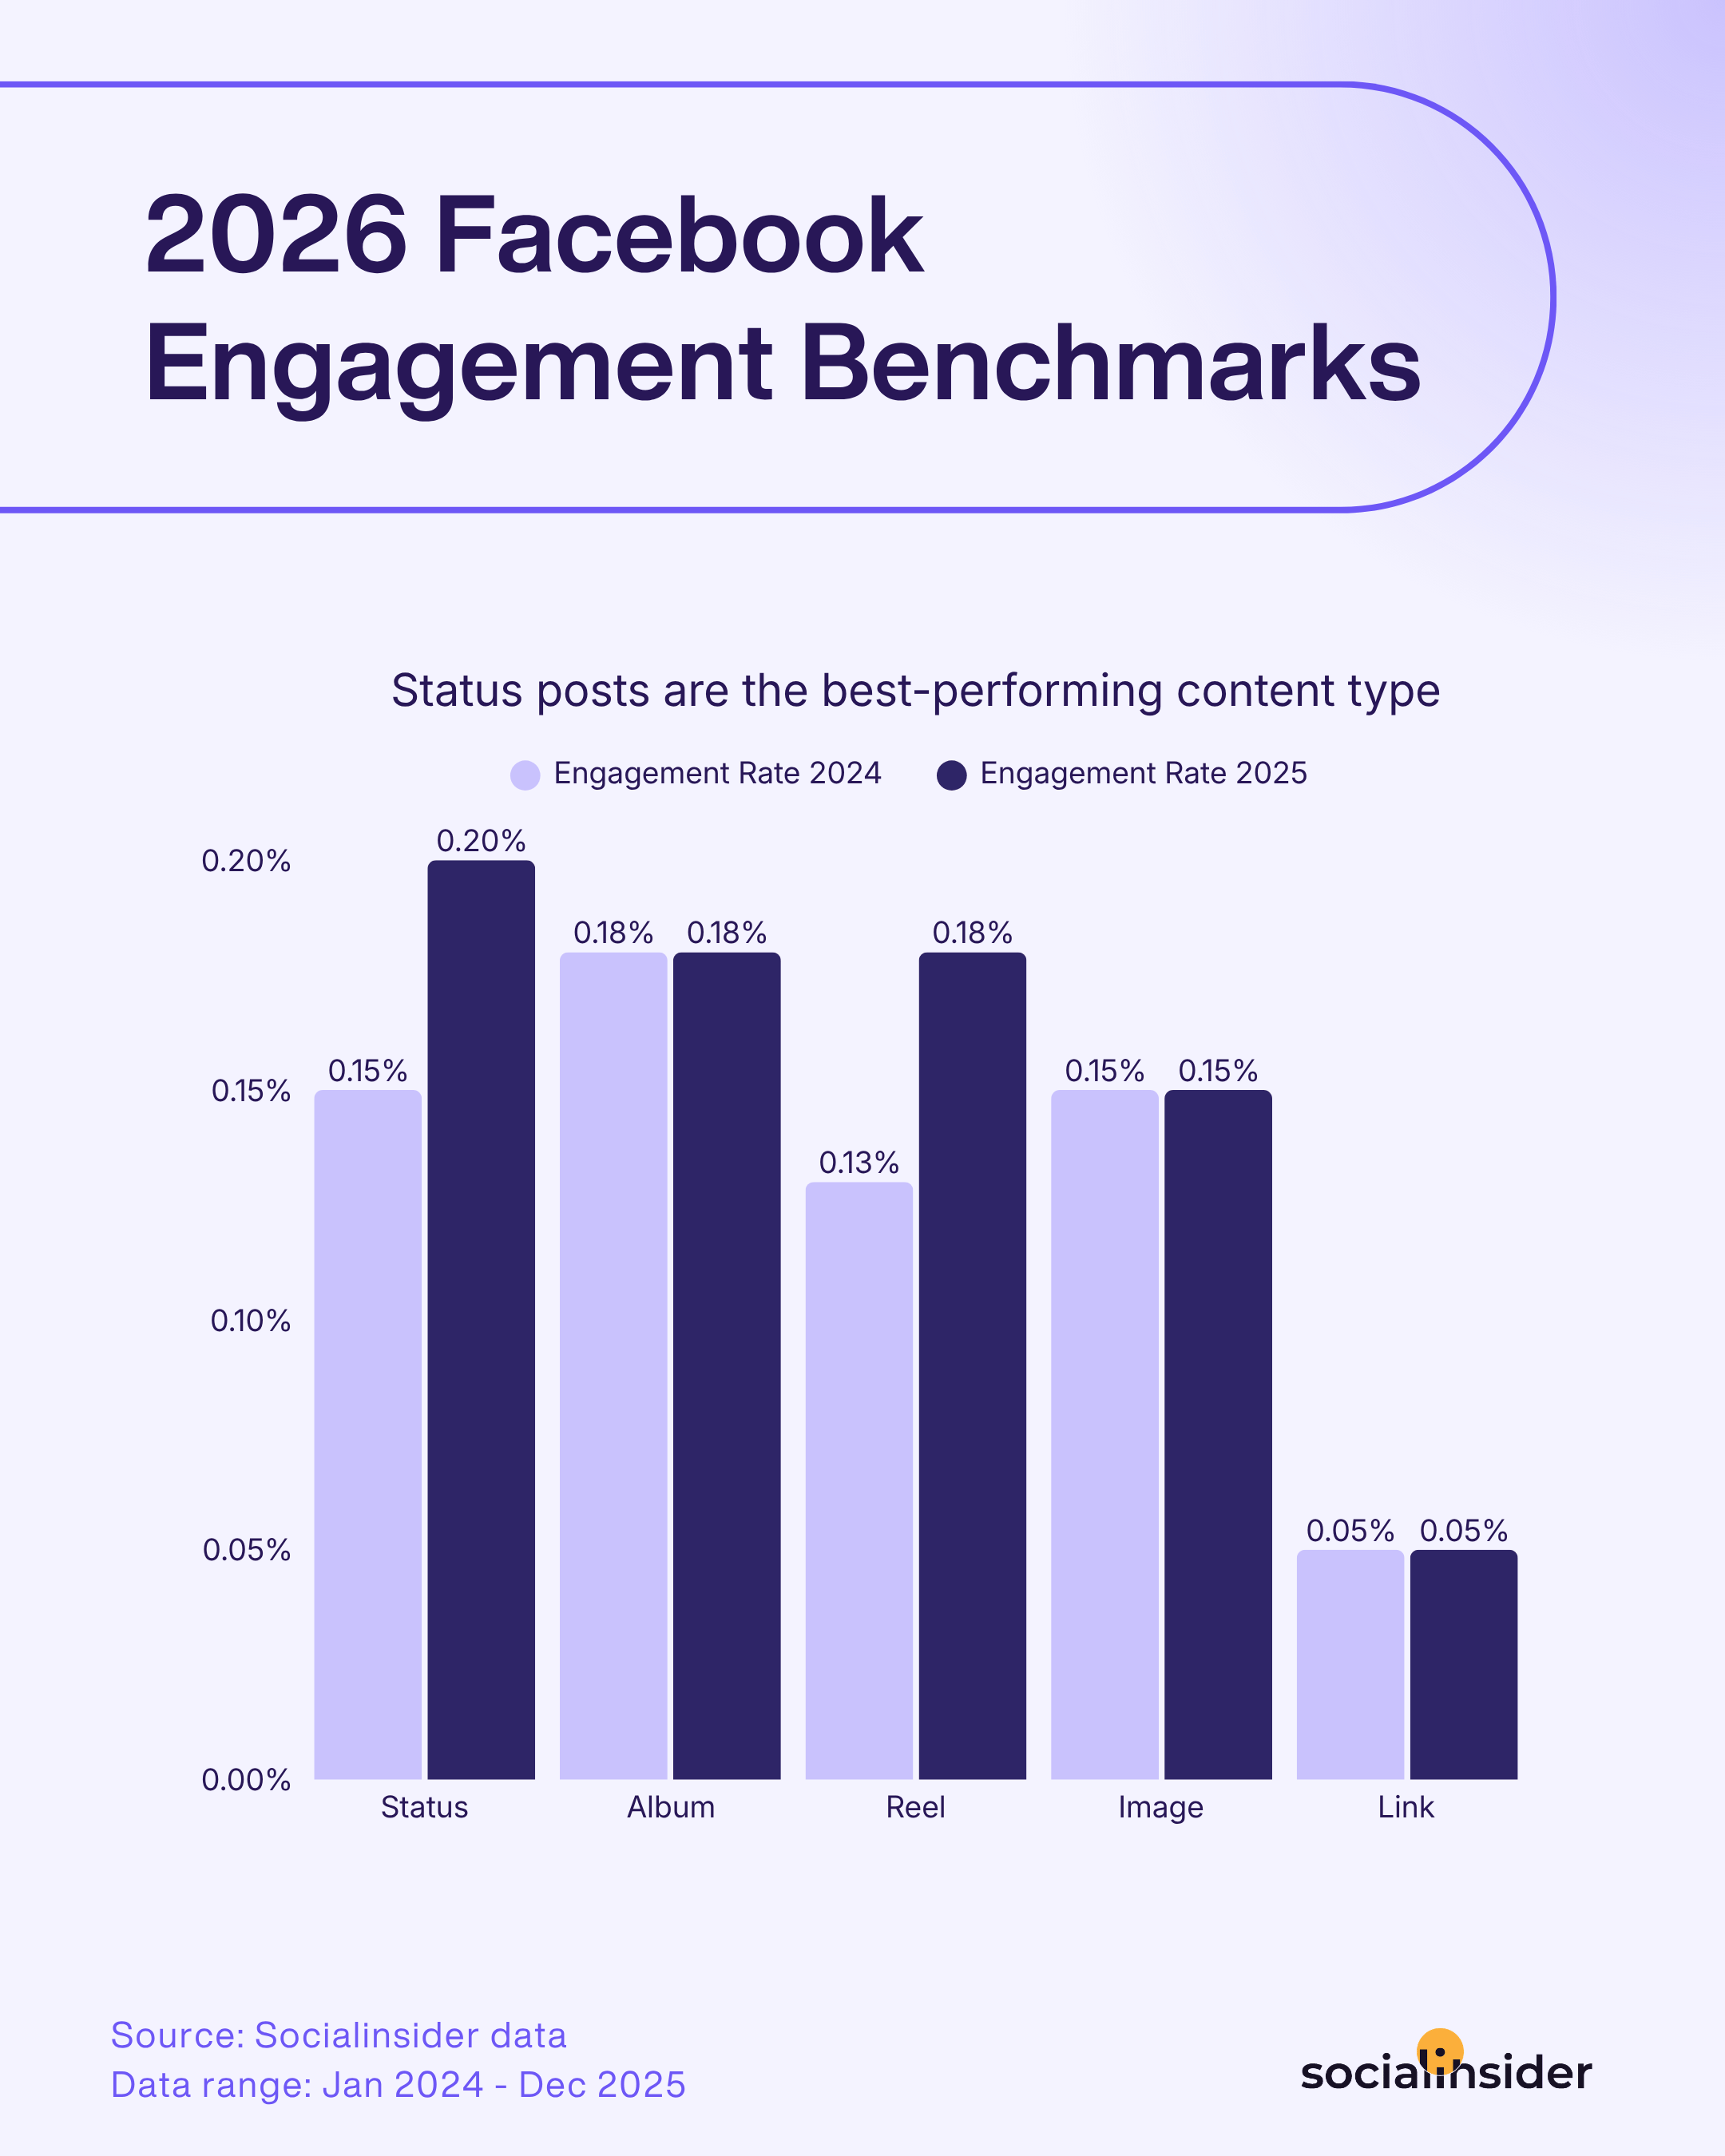
- Status posts emerge as the top-performing content format on Facebook.
- Albums win for smaller pages, while status posts dominate engagement for mid- to large-sized accounts.
- Status posts spark the most conversations on Facebook.
- Albums lead the way when it comes to shares and views across all Facebook pages.
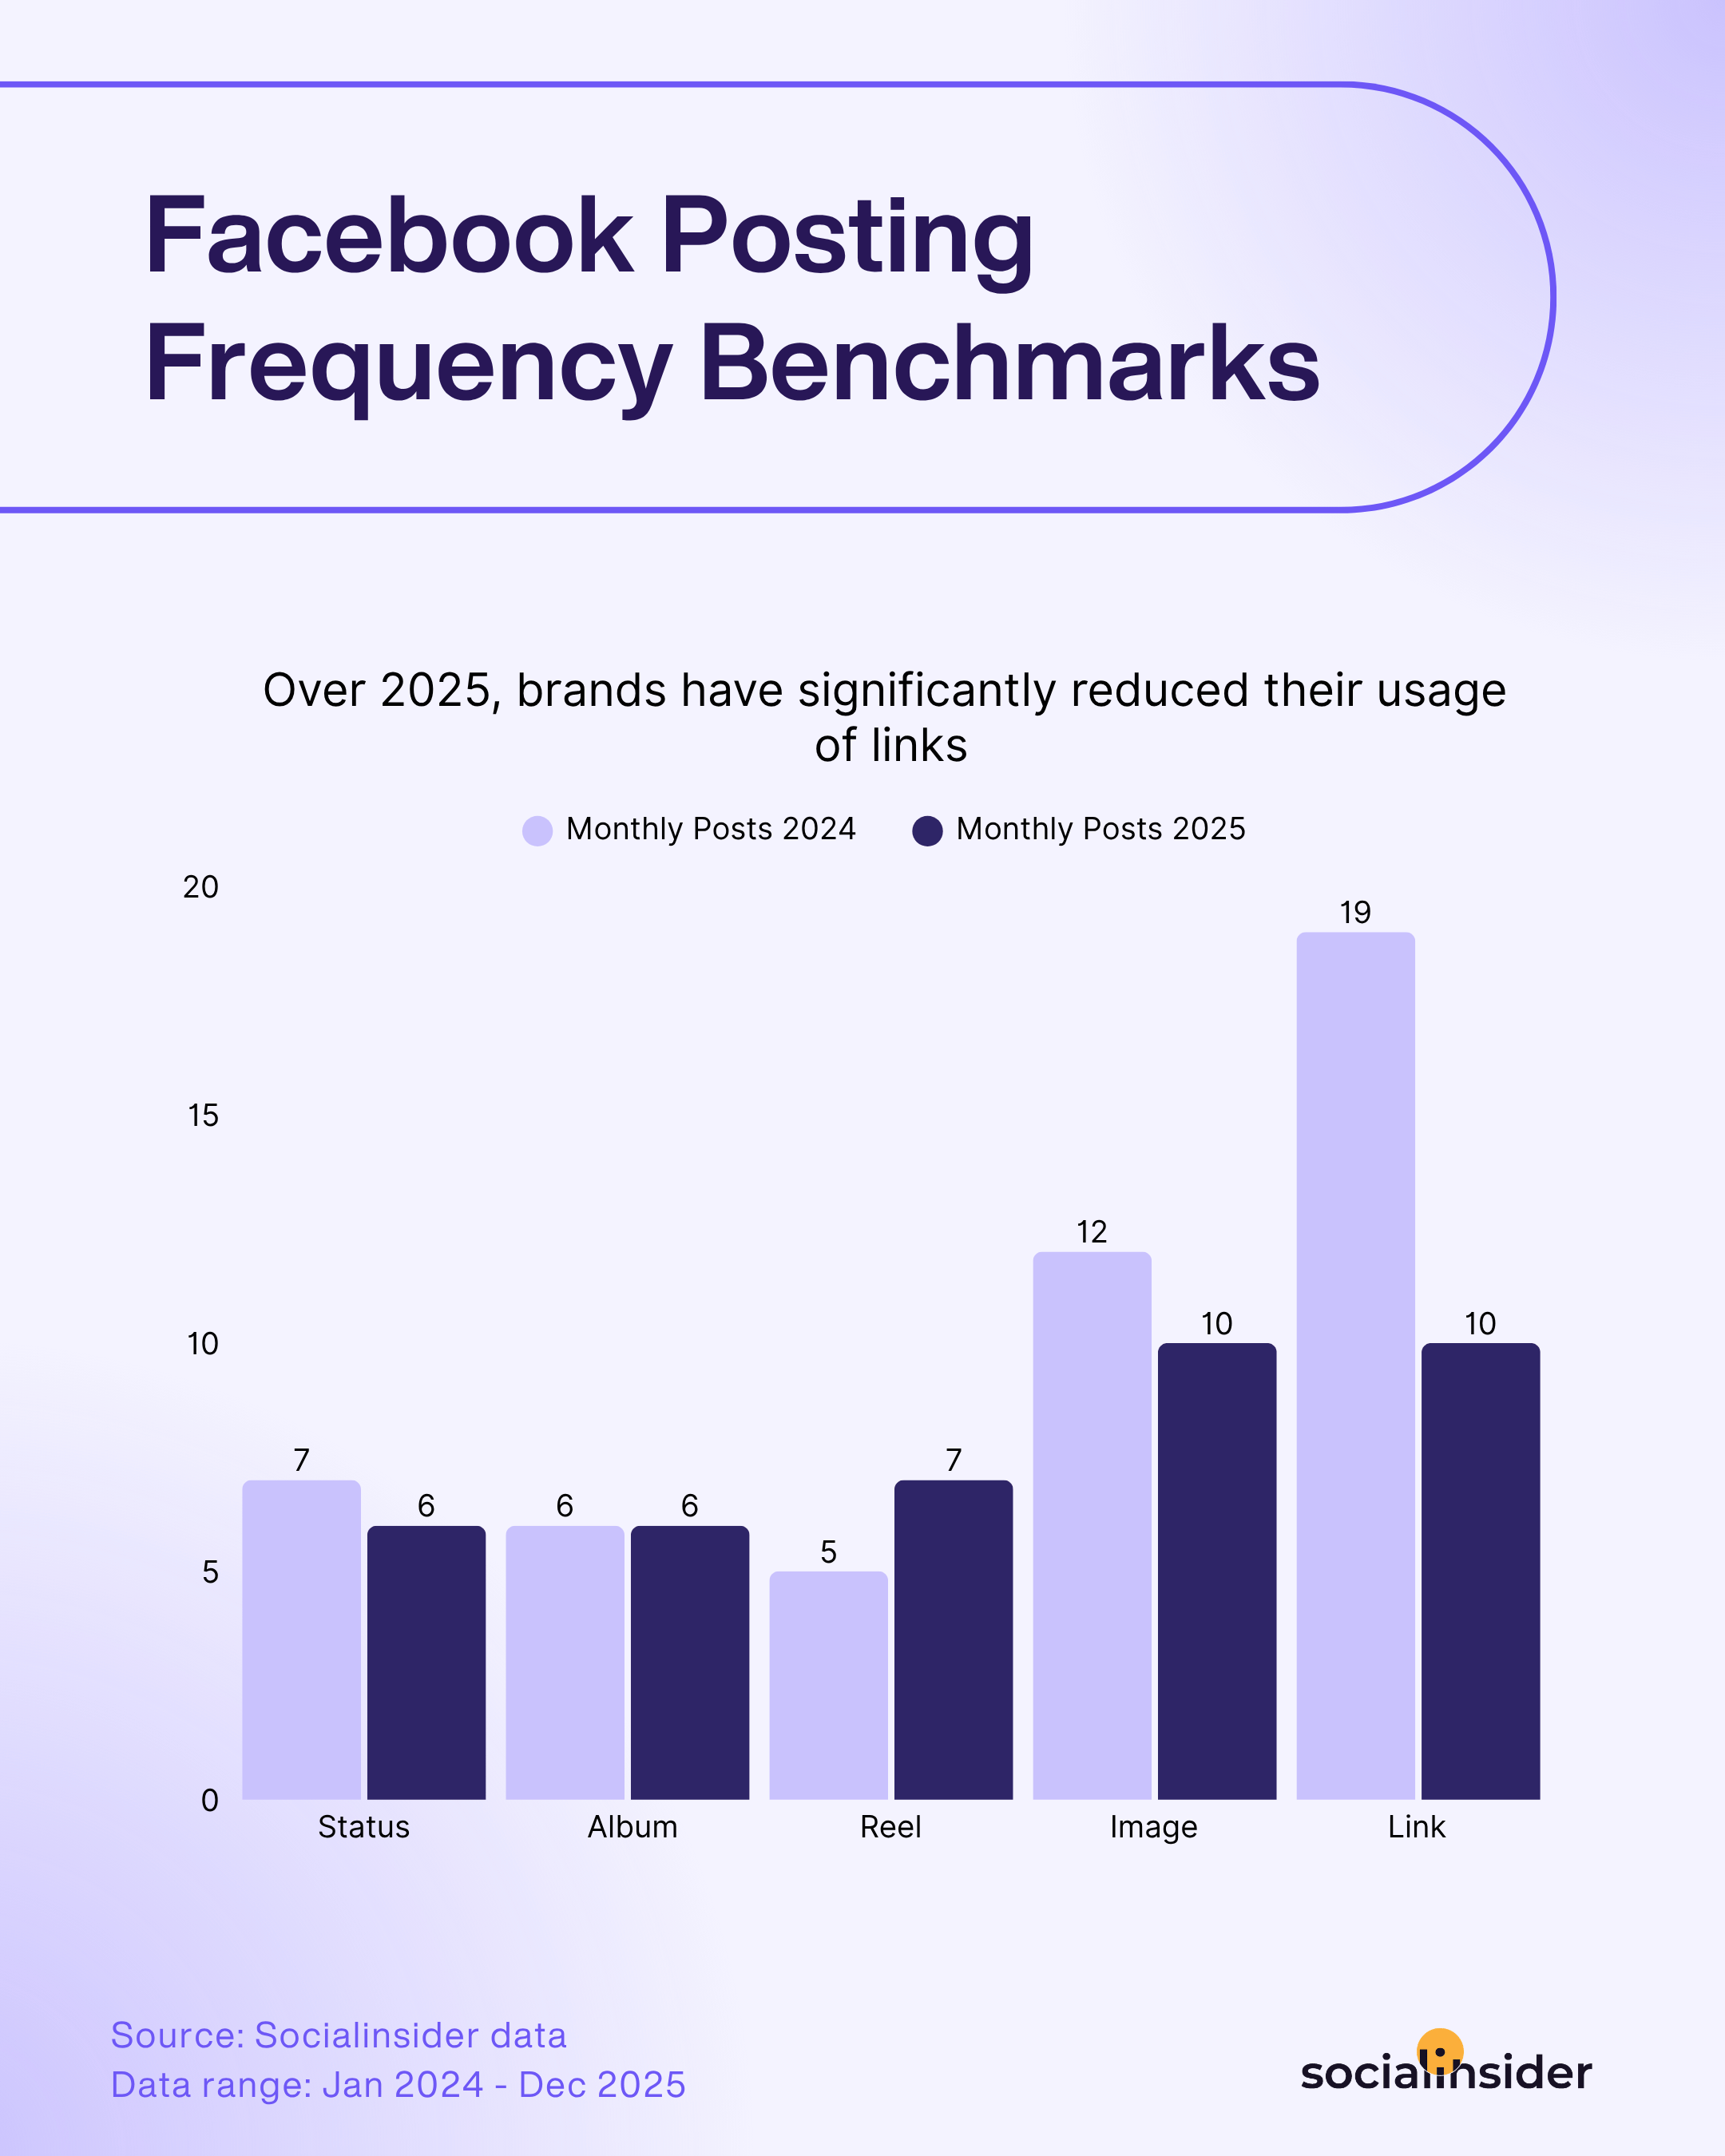
- YoY, brands have reduced their posting volume by 22.00%, currently posting 39 posts per month on average.
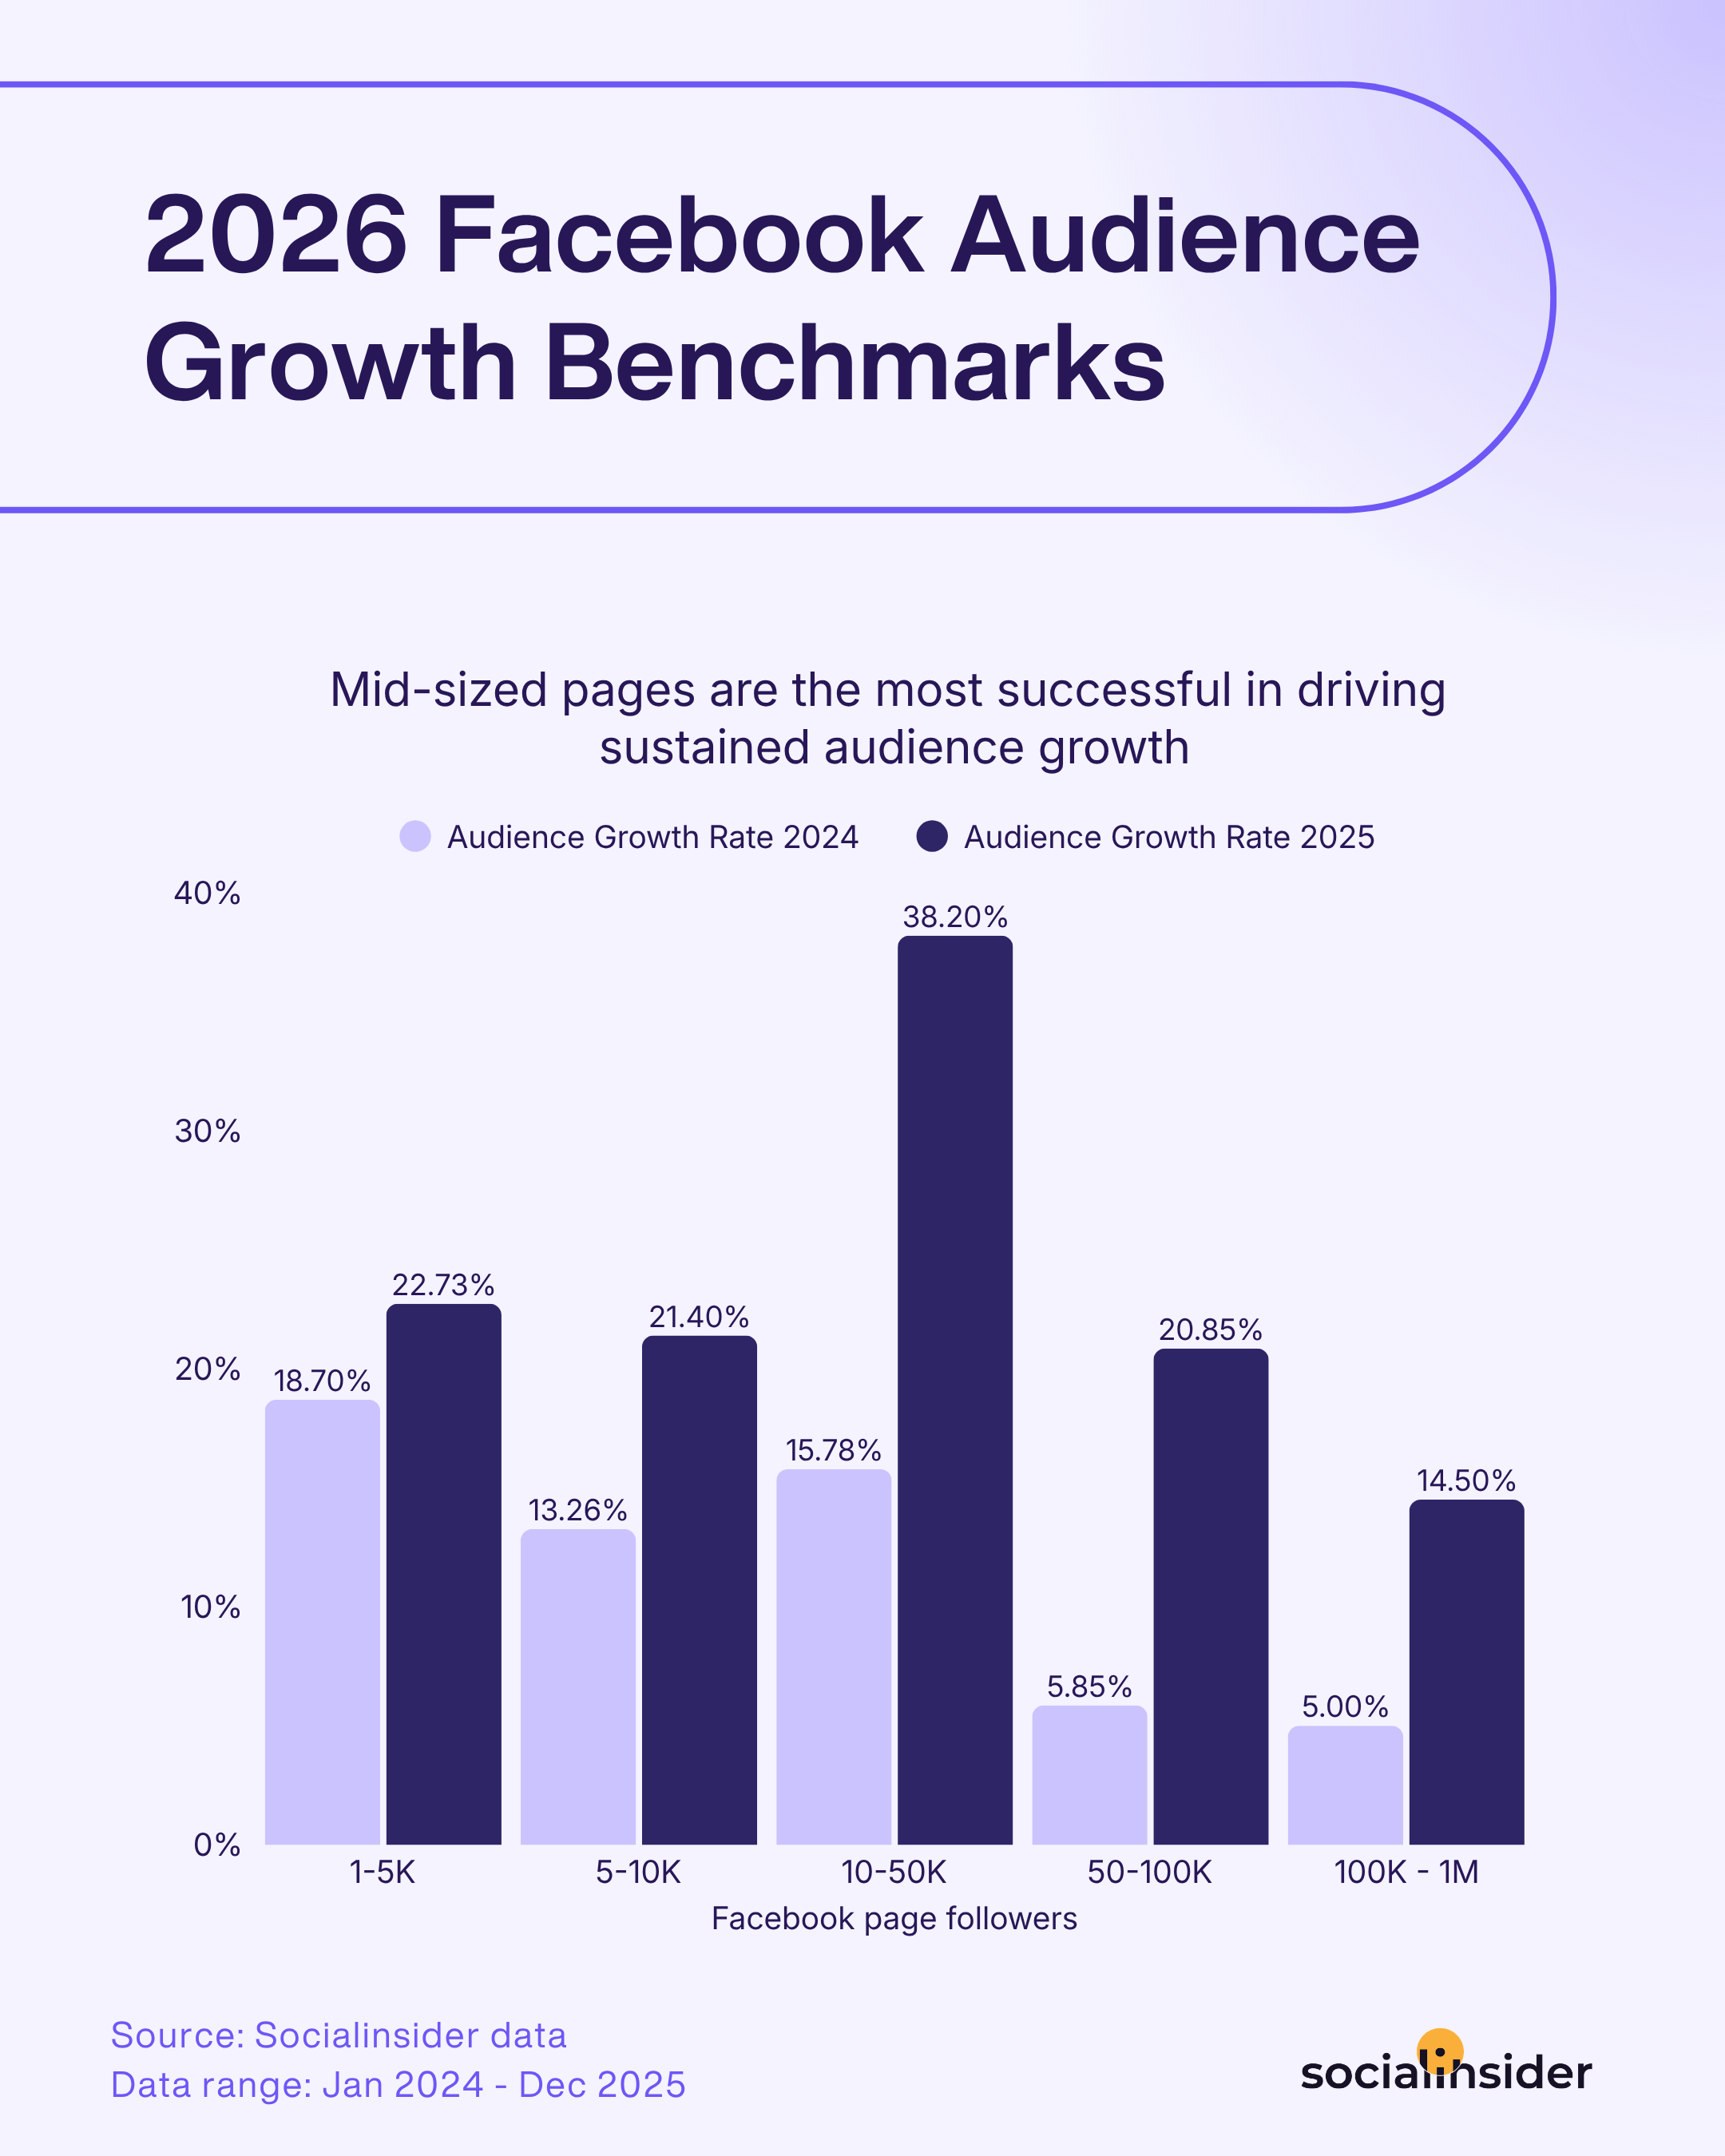
- Facebook audience growth rates doubled year over year, increasing from 12.20% to 23.20% in 2025.
Facebook quarterly benchmarks
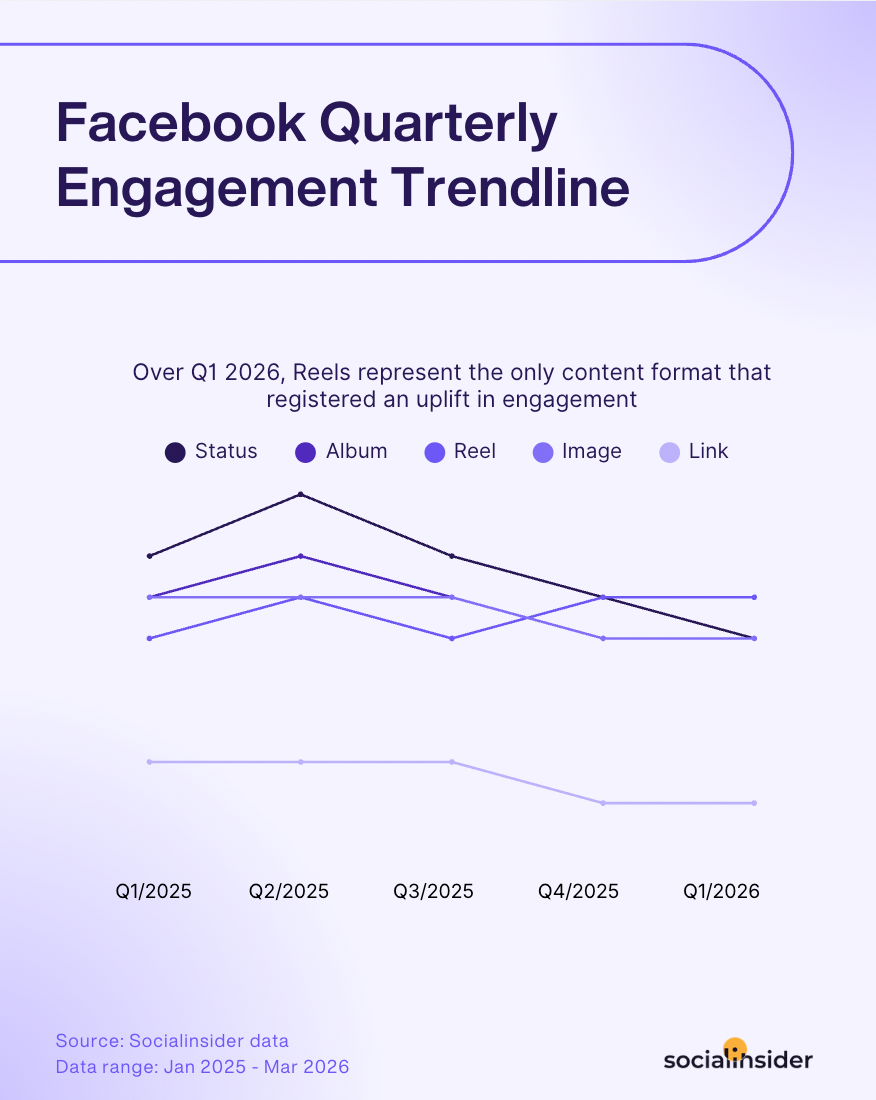
Over the first quarter of 2026, Reels represent the only content format that registered an uplift in engagement.
Compared to other platforms, 2025 was actually a fairly strong year for Facebook in terms of engagement stability.
However, Q1 2026 paints a slightly different picture. Most content formats started the year with lower engagement rates compared to Q1 2025, suggesting that Facebook is also beginning to feel the impact of the broader engagement decline affecting the entire social media landscape.
At the same time, one thing becomes very clear from the Socialinsider data: Facebook continues to move further toward a video-first content ecosystem. Reels were the only content format to see an increase in engagement in Q1 2026, reinforcing the platform’s growing focus on short-form video content.
Over Q1, engagement evolved in the following directions for different content formats:
- Status posts: Status posts saw a gradual decline in engagement, dropping from 0.17% in Q1 2025 to 0.13% in Q1 2026.
- Album posts: Album posts also recorded lower engagement levels in Q1 2026, decreasing from 0.15% to 0.13% year-over-year.
- Reels: Reels were the only content format to register an uplift in engagement during Q1 2026, reaching 0.15%. This further confirms Facebook’s growing preference for short-form video content.
- Image posts: Image posts maintained relatively stable engagement rates throughout the analyzed period, ending Q1 2026 at 0.13%.
- Link posts: Link posts continued to generate the lowest engagement rates on Facebook, remaining flat at 0.05% in Q1 2026 — roughly half the engagement generated by most other content formats.
Average Facebook engagement rate
Facebook is one of the oldest social media platforms still shaping how brands connect with their audiences. And over the years, what “success” looks like on Facebook has changed… a lot. There was a time when getting thousands of likes was the ultimate goal. Then everyone started chasing reach. Later, views became the big KPI.
Still, through all of these changes—algorithm changes, new formats, endless feed updates— one thing has held steady: building real engagement is what consistently makes a brand stand out.
What used to be a race for likes and page follows has gradually evolved into something more meaningful—a steady focus on building genuine connections and conversations. And because the platform keeps changing, the definition of success can sometimes feel like a moving target.
That’s exactly why looking at Facebook engagement benchmarks becomes so valuable. Because they give you a clearer reference point for understanding whether your content is actually performing well.
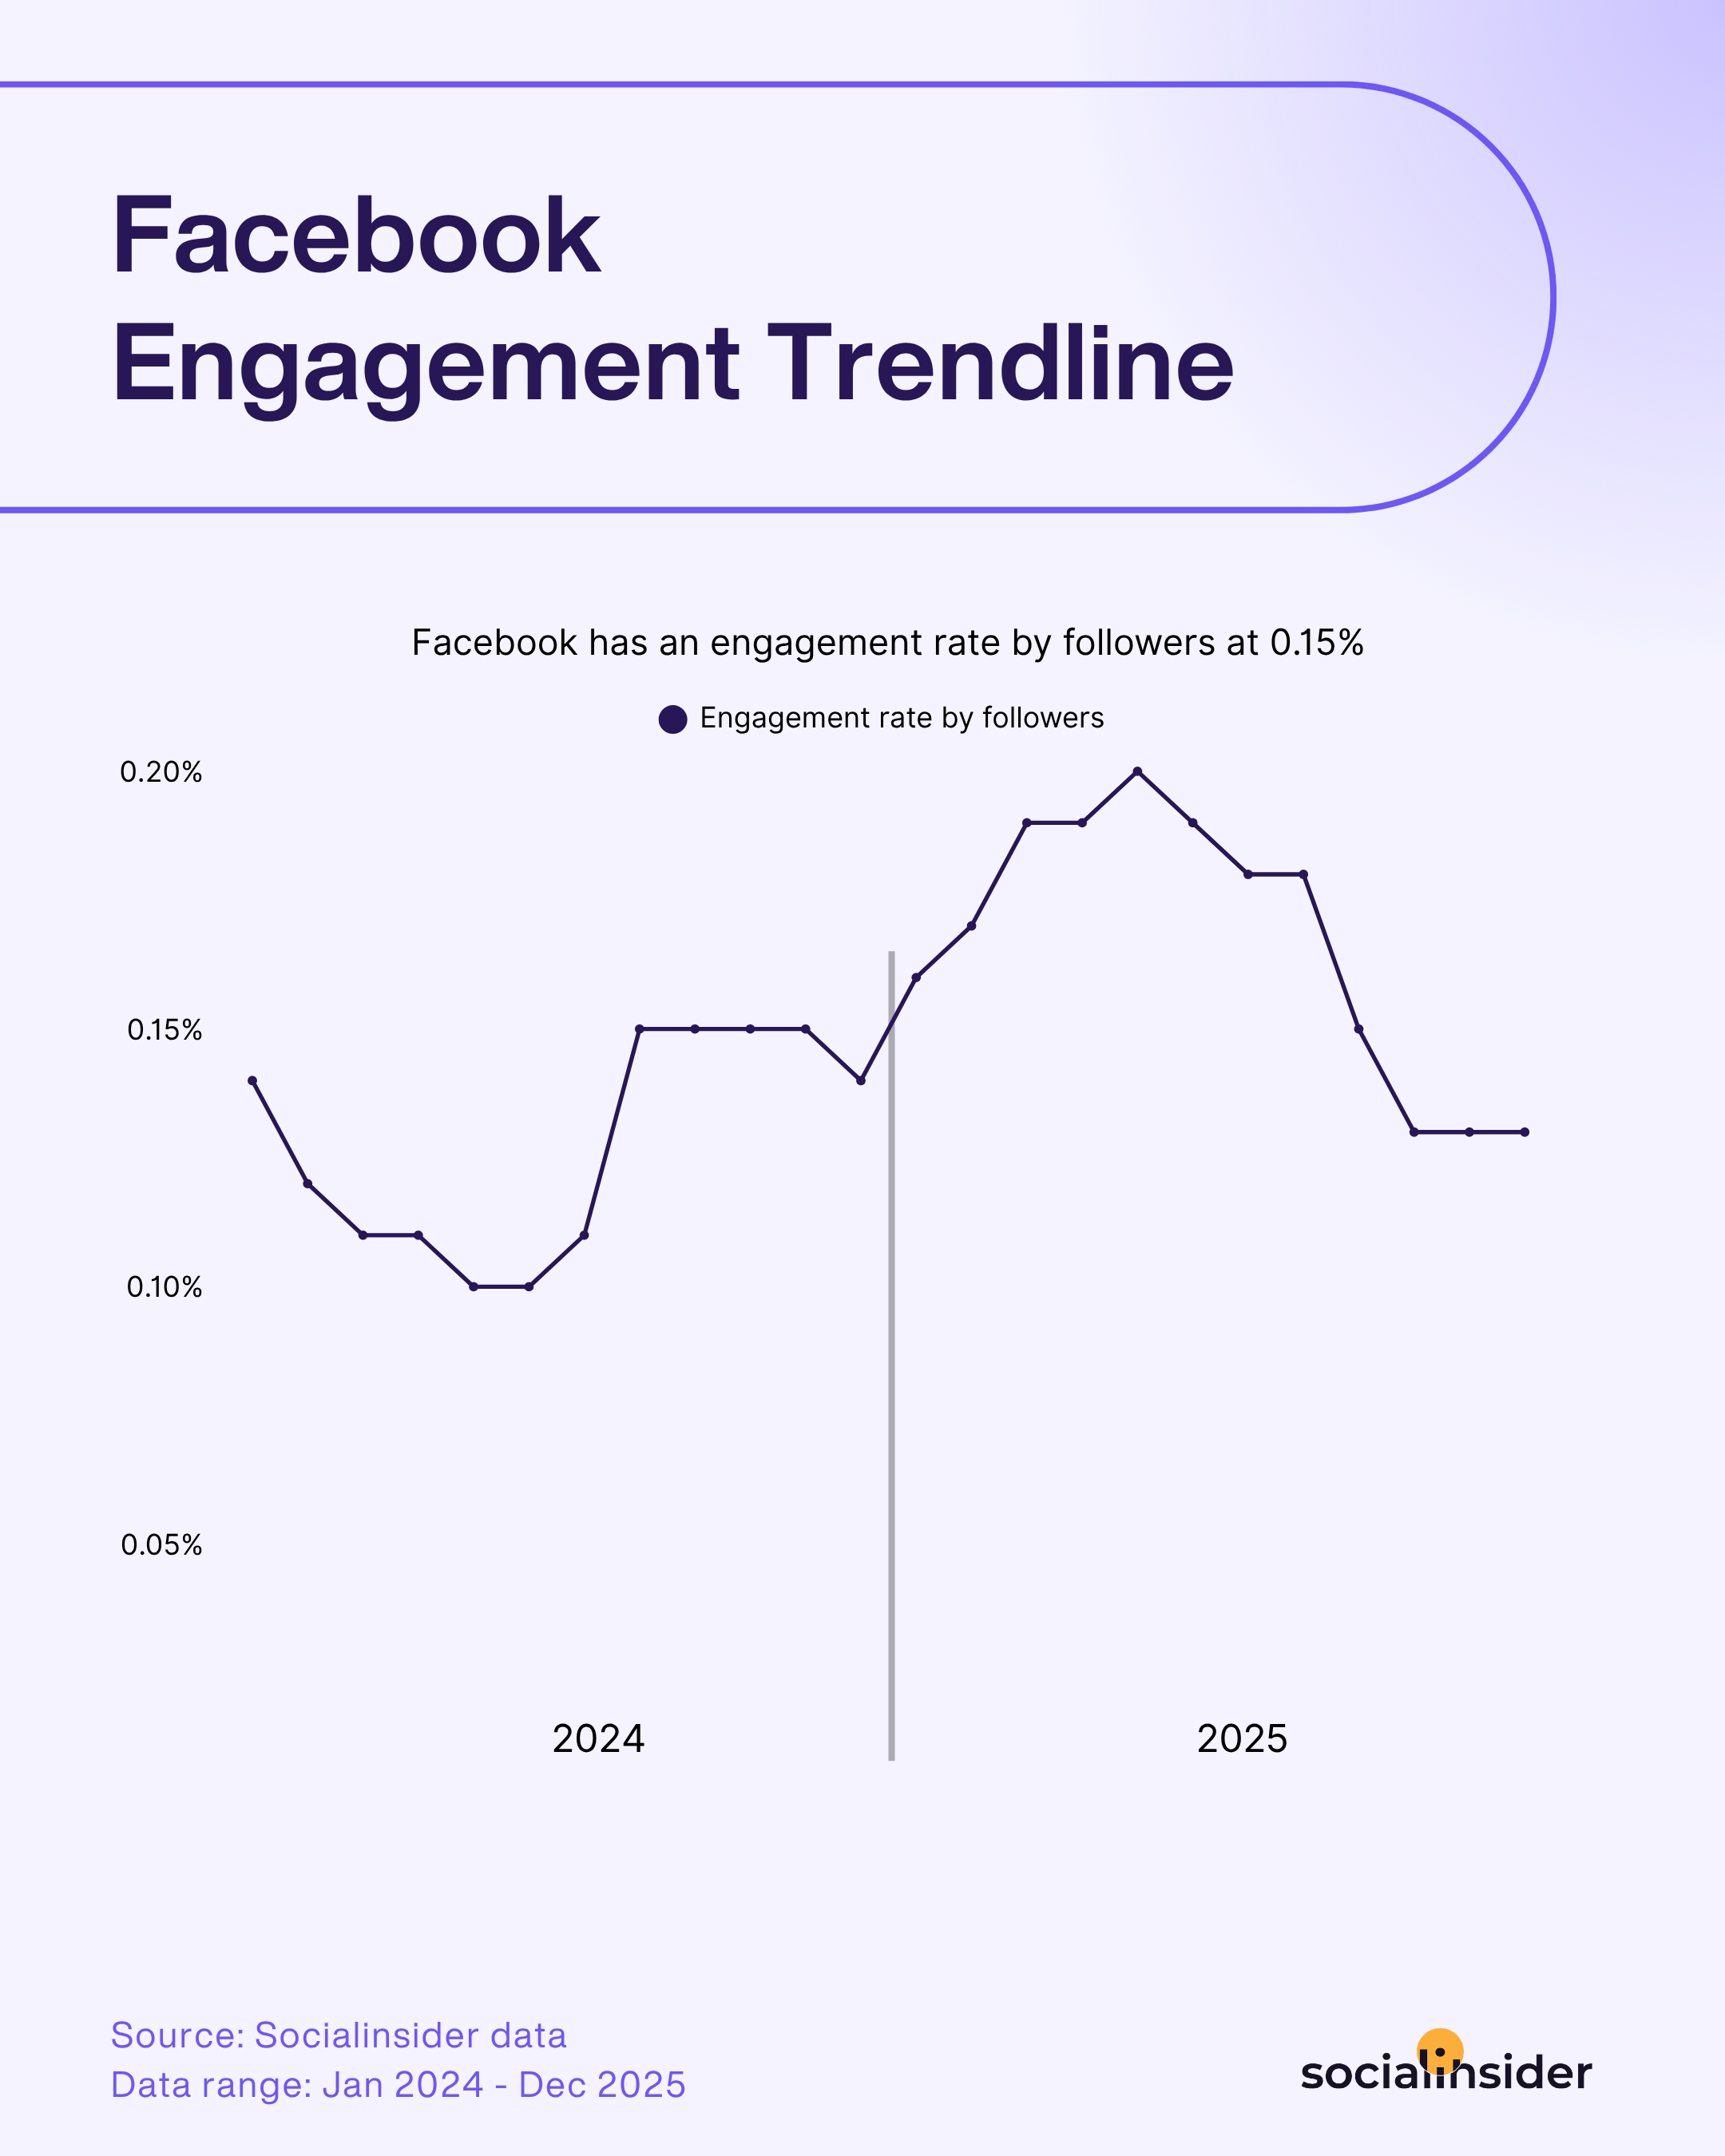
So what does engagement actually look like across Facebook today? According to the latest Socialinsider data, the average engagement rate on Facebook currently stands at 0.15%.
But averages rarely tell the whole story.
Once I broke engagement down by content format, some interesting differences start to appear—and one result stands out in particular.
Status posts generate the highest engagement rate, reaching 0.20% in 2025, compared to 0.15% in 2024.
Who would have thought that, right?
With video dominating so many conversations around social media performance, it would be easy to assume that formats like Reels would lead when it comes to engagement. Yet the data suggests something a bit different.
Status posts, despite their simplicity, naturally invite interaction. They encourage people to share opinions, react quickly, or jump into a conversation—which is exactly what helps them outperform other formats.
On Facebook today, the content that wins isn’t the most produced — it’s the most participatory. Simple status posts outperform video because they meet users in a lean-back mindset, ask for almost no effort, and invite immediate interaction. A quick thought, a question, a prompt, that’s enough to spark comments, and comments remain the clearest signal of meaningful engagement.
Video still has a role, but it asks for time and attention that many users aren’t offering in-feed. In contrast, status posts feel human, familiar, and conversational — more like something from a friend than a brand. - Heather Brinckerhoff, Vice President Social media and Digital Content, Great American Media
Strategic tactics to increase your Facebook engagement
- Ask direct, opinion-based questions in status posts. Since text updates naturally invite conversation, use them to spark discussion.
- Post content that reflects shared experiences. Relatable industry pain points or common mistakes are moments often trigger reactions and comments.
- Experiment with short text hooks. Posts that start with lines like “Unpopular opinion:” often perform well because they invite people to weigh in.
- Keep promotional content conversational. Even when promoting something, frame it as a discussion or insight rather than a sales message.
Flat engagement rates don’t necessarily mean a brand doesn’t understand its audience, it can also indicate that content or approach has plateaued. To improve performance, brands should focus on evolving their creative, testing stronger hooks, more distinctive storytelling, and formats that align with how audiences are engaging on the platform.
Ongoing optimisation is also key, using performance signals like saves and shares to refine content over time and double down on what’s working.
Ultimately, it’s about continuously refreshing how you show up, rather than relying on the same approach, even if it’s worked in the past. - Daisy Castle, Social Media Manager, TUI
Average Facebook likes
If engagement rate tells us how actively audiences interact with content, likes still offer another useful layer of insight. They’re often the first and easiest form of interaction people give to a post. A quick tap, a simple signal of approval. Small action, but at scale, it tells us a lot about how content resonates across different types of Facebook pages.
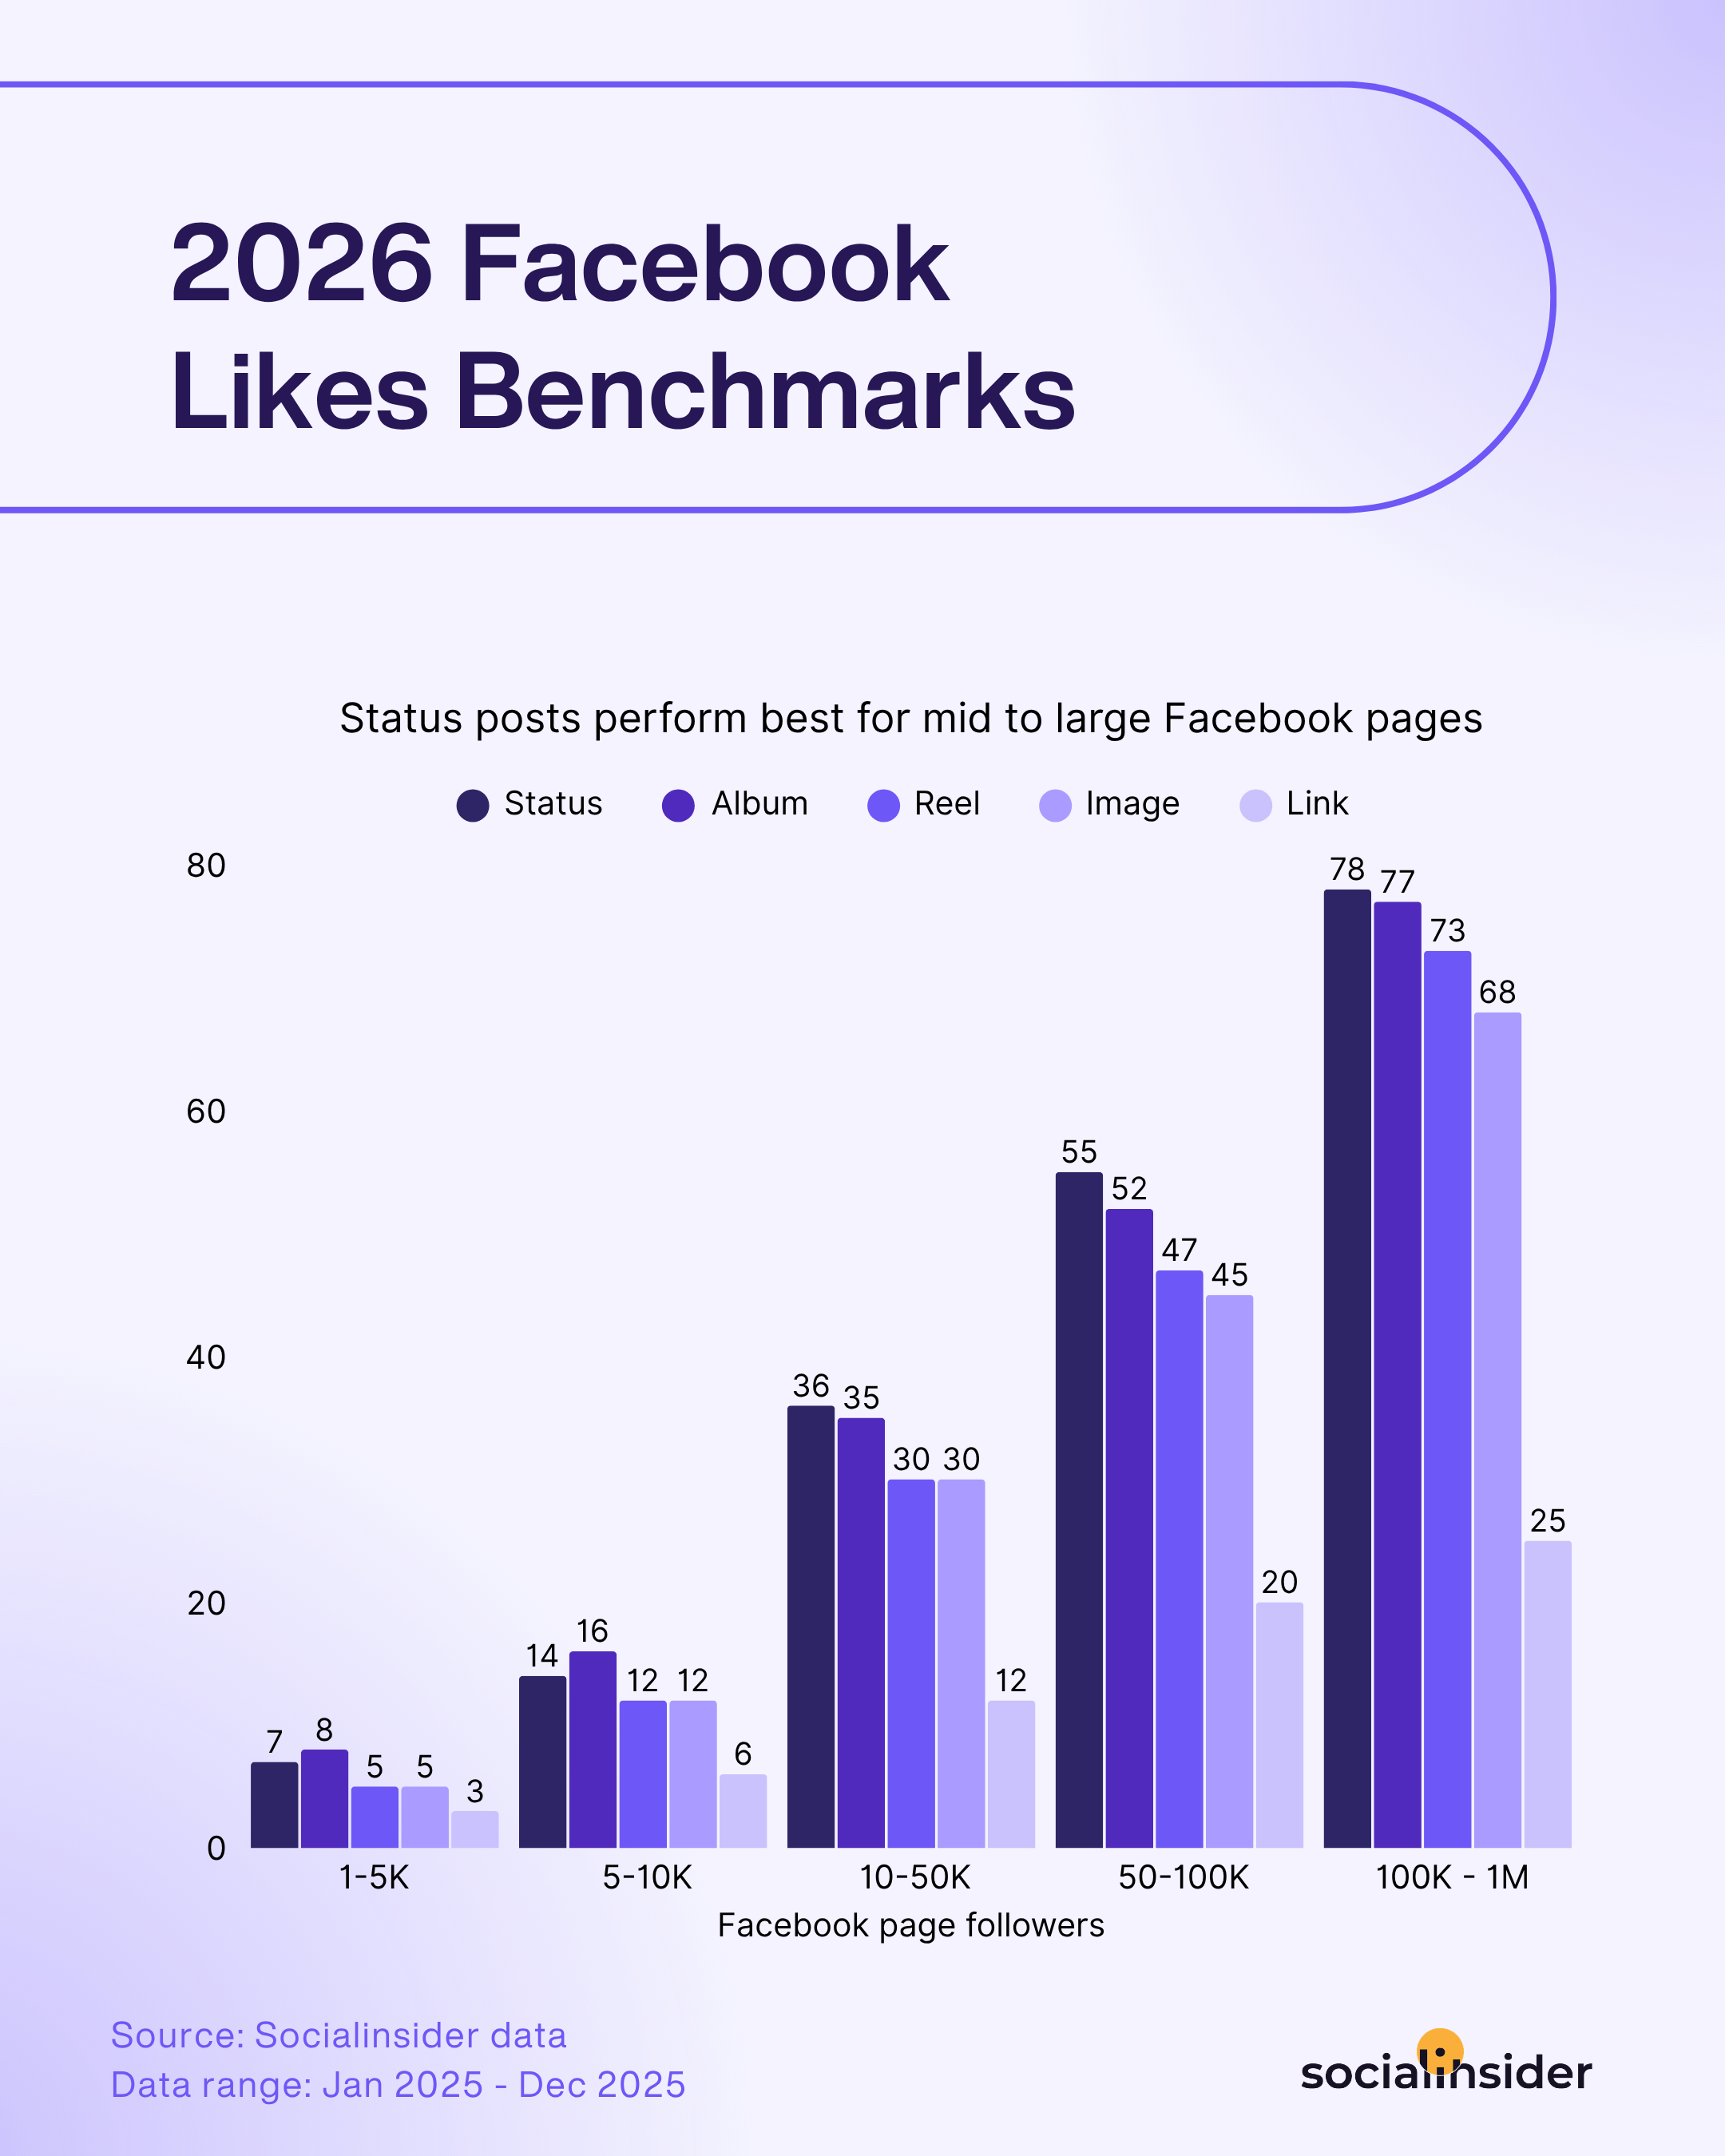
And when analyzing the latest Facebook engagement benchmarks, one thing quickly became clear: page size plays a big role in how many likes a post typically receives.
For smaller Facebook pages—those with fewer than 10K followers—albums tend to perform best, generating the highest number of likes compared to other content types. This likely comes down to how albums package multiple visuals into a single post, creating a richer piece of content that encourages people to pause, browse, and react.
However, once pages grow beyond the 10K follower mark, the pattern begins to change.
From that point on, status posts consistently generate more likes than other formats. Simple text updates—often written in a conversational tone—make it incredibly easy for audiences to react quickly, especially for larger communities where interactions tend to happen faster and with less friction.
Facebook users are tired. They don't want to be sold to, they don't want overproduced content, and they definitely don't want another 90-second brand video explaining why they should care. Status posts work because they feel like a person, not a marketing team. The platform spent years pushing video, brands followed, and now everyone's feed is a wall of content that looks the same. The simplest format won because it's the only one that still feels human. - Carolina Barbosa, Senior Social Strategist
Strategic tactics to increase your Facebook likes
- Match your format to your audience size. If your page has fewer than 10K followers, experiment more with albums. Collections of visuals—like product sets, event highlights, or step-by-step visuals—tend to capture attention and generate more likes in smaller communities.
- Post relatable or experience-based content. Posts that reflect shared experiences—industry struggles, common mistakes, or everyday work moments—often drive quick reactions because people instantly recognize themselves in the message.
- Encourage micro-engagement. Simple prompts like “Like if you agree” or “Drop a 👍 if this sounds familiar” reduce friction and make it easier for followers to interact.
Average Facebook comments
Over the years, comments have become an increasingly important signal of content performance on Facebook. As audiences grow larger, user behavior has also shifted—most people scroll quickly through their feeds, reacting with a like and moving on.
That’s exactly why comments carry so much weight today.
When someone takes the time to leave a comment, it usually means the content genuinely resonated with them. They paused, reflected on what they saw, and felt compelled to join the conversation. In an environment where passive consumption is becoming the norm, comments represent a much stronger level of engagement.
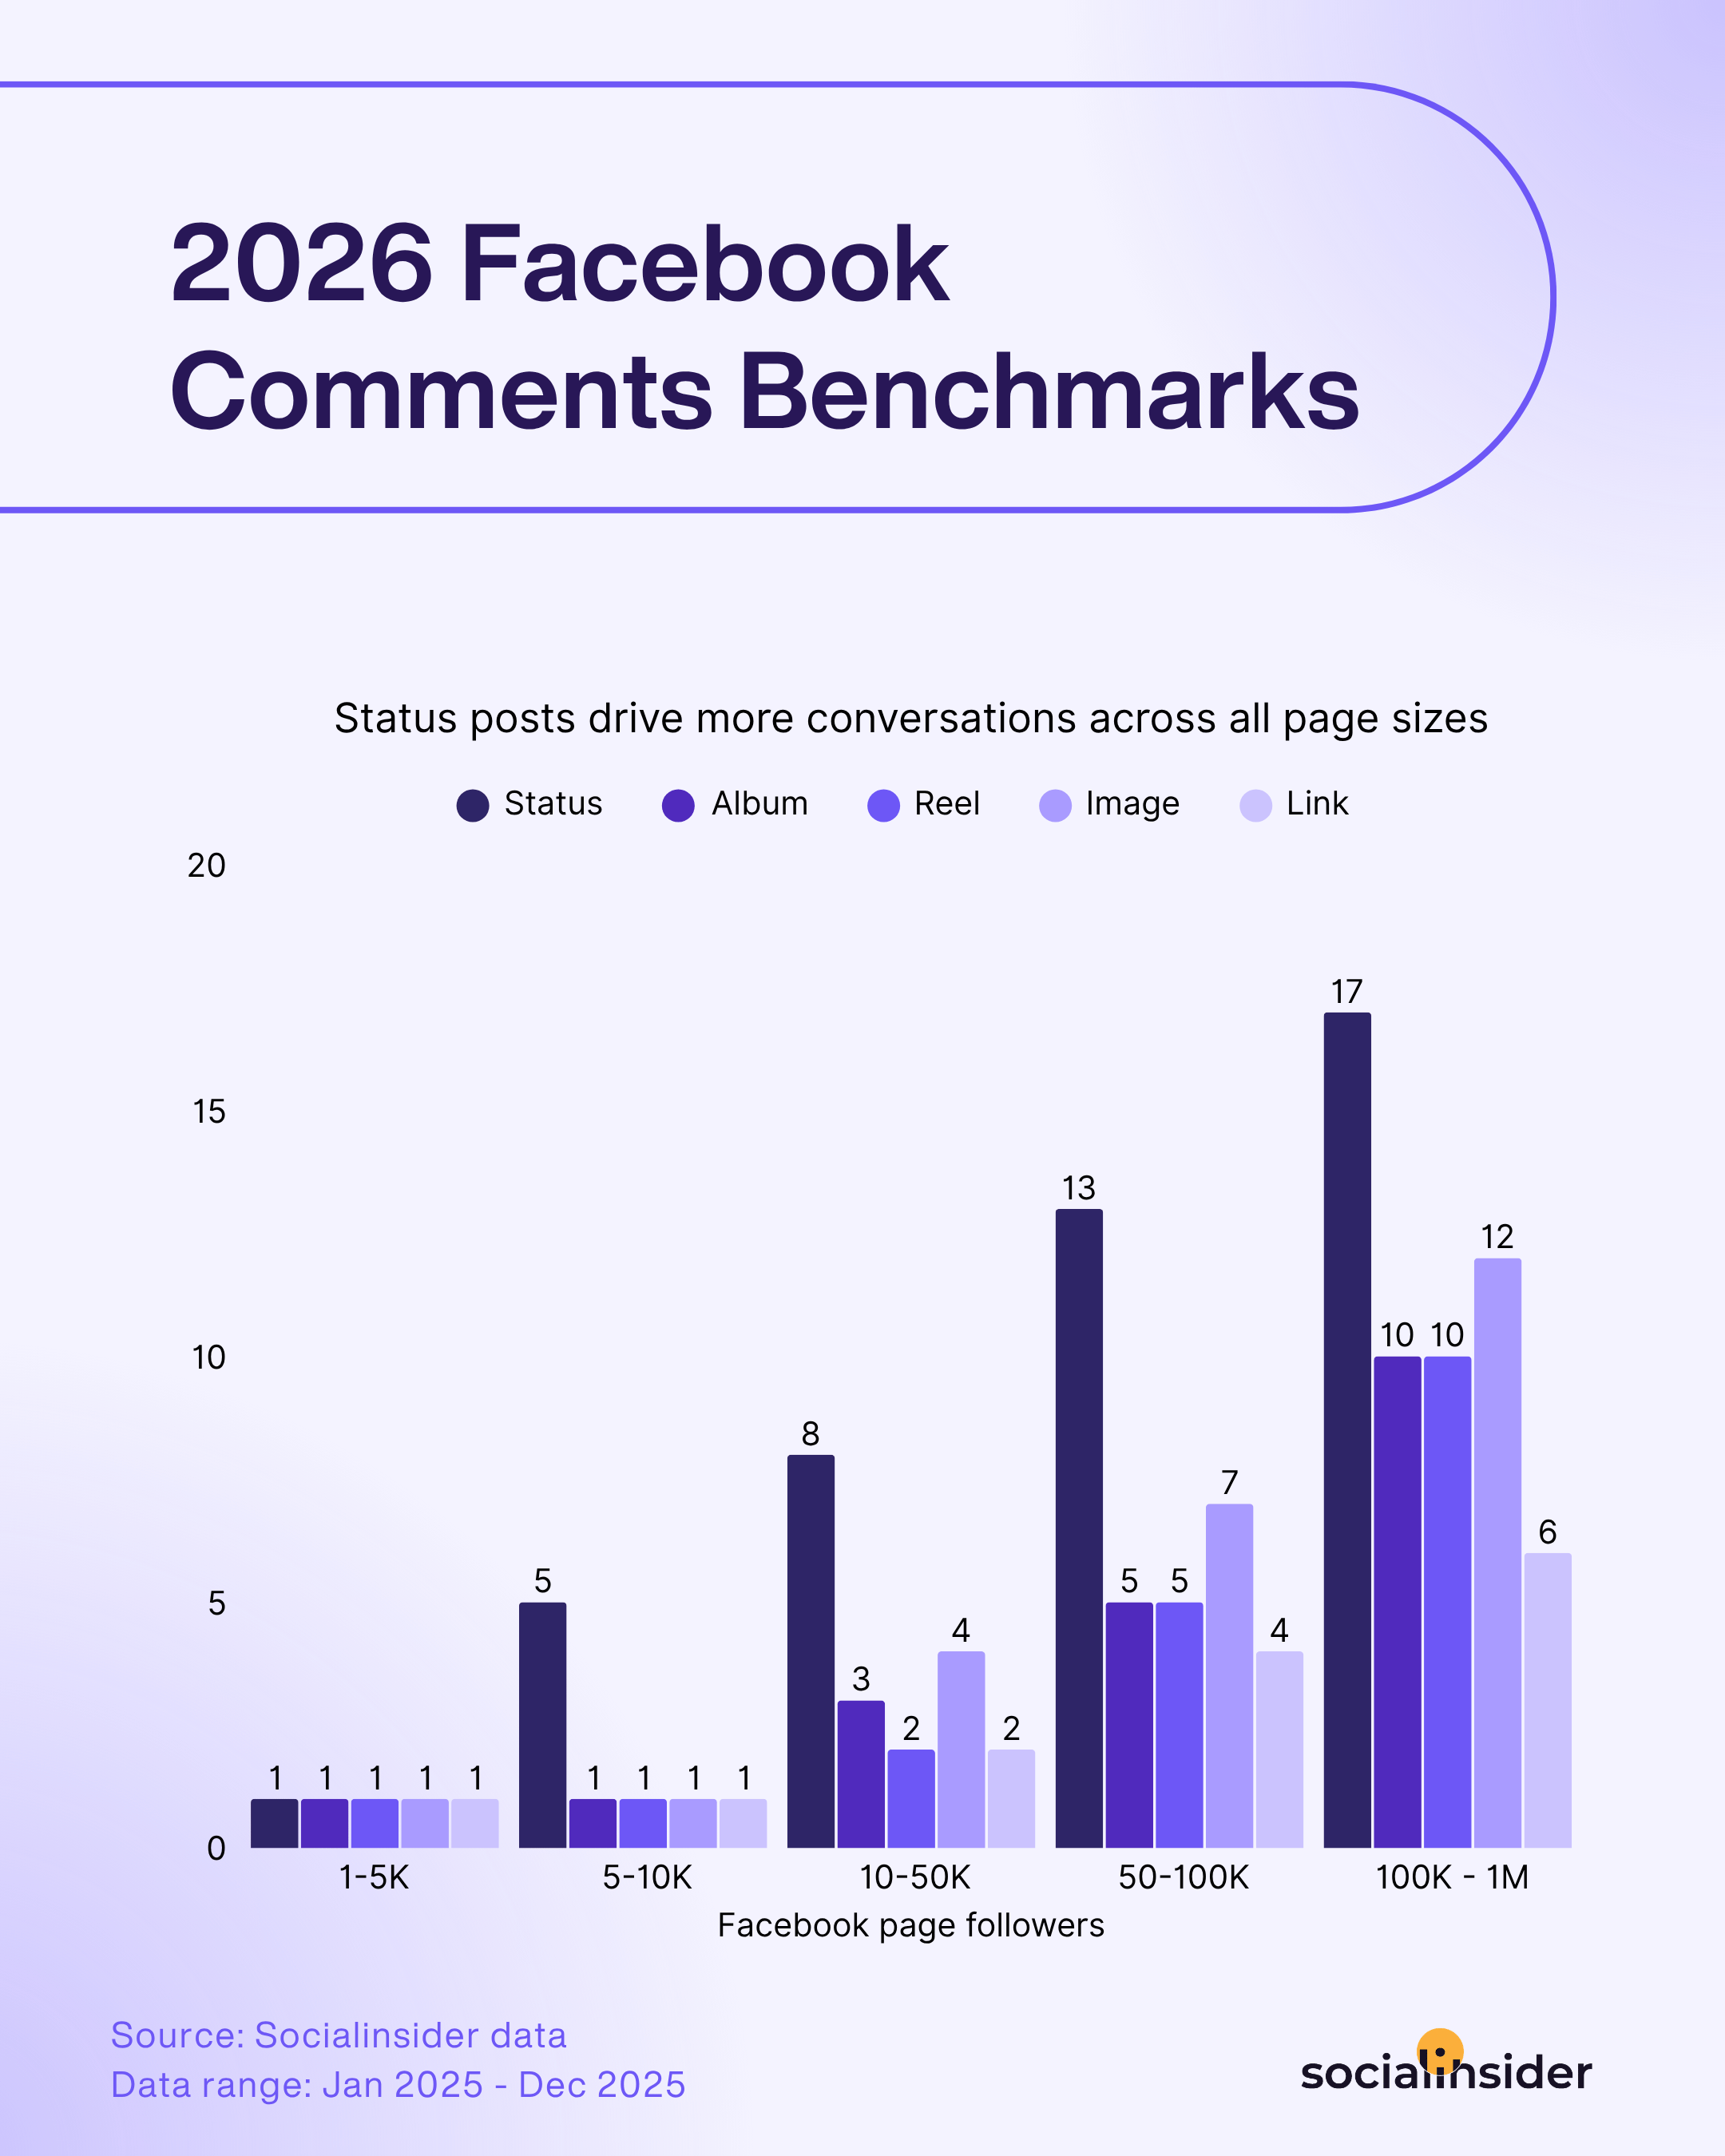
And when looking at the average comments on Facebook across different page sizes and content formats, one pattern becomes very clear.
Status posts consistently generate the highest number of comments.
Unlike other formats, status updates naturally invite discussion. They often take the form of opinions, questions, or short reflections—content that encourages people to respond, share their own experiences, or react to a point being made. In many ways, status posts behave more like conversation starters than traditional pieces of content.
This becomes even more noticeable as page size grows. Larger audiences tend to amplify discussions around text-based posts, where followers can easily jump into the conversation without needing to interpret visuals or watch a video first.
Strategic tactics to increase your Facebook comments
- Create light debates. Present two options and ask followers to choose a side. Friendly debates naturally drive comment threads.
- Respond with follow-up questions. When someone comments, don’t just reply—ask another question. This extends the thread and keeps the discussion alive.
- Share a bold opinion or “hot take.” Posts that take a clear stance on an industry topic often encourage followers to agree, disagree, or add their perspective.
Moving a user from a passive scrolling trance to actively commenting requires triggering a strong psychological response that makes the mental effort feel worth it. People are driven to break their scrolling habit primarily by high-arousal emotions, like fierce agreement or fiery outrage, or the desire to project their identity by showing off their expertise or sharing a personal story.
To capitalise on this, you must lower the barrier to entry; generic questions usually fail, but ultra-specific, low-friction prompts (like a binary choice or a fill-in-the-blank) make engaging almost effortless. Finally, creating highly relatable content encourages users to simply tag a friend, turning your post into social currency and naturally driving up those crucial interaction metrics. - Madeleine Brice, Social Media Manager, We Are Social
Average Facebook shares
Shares are a slightly different kind of engagement. While likes and comments show how audiences react to content, shares indicate something stronger—that people find a post valuable or interesting enough to pass it along to their own network.
In many ways, a share is a form of endorsement. When someone shares a post, they’re not just interacting with the content—they’re helping it travel beyond the original audience.
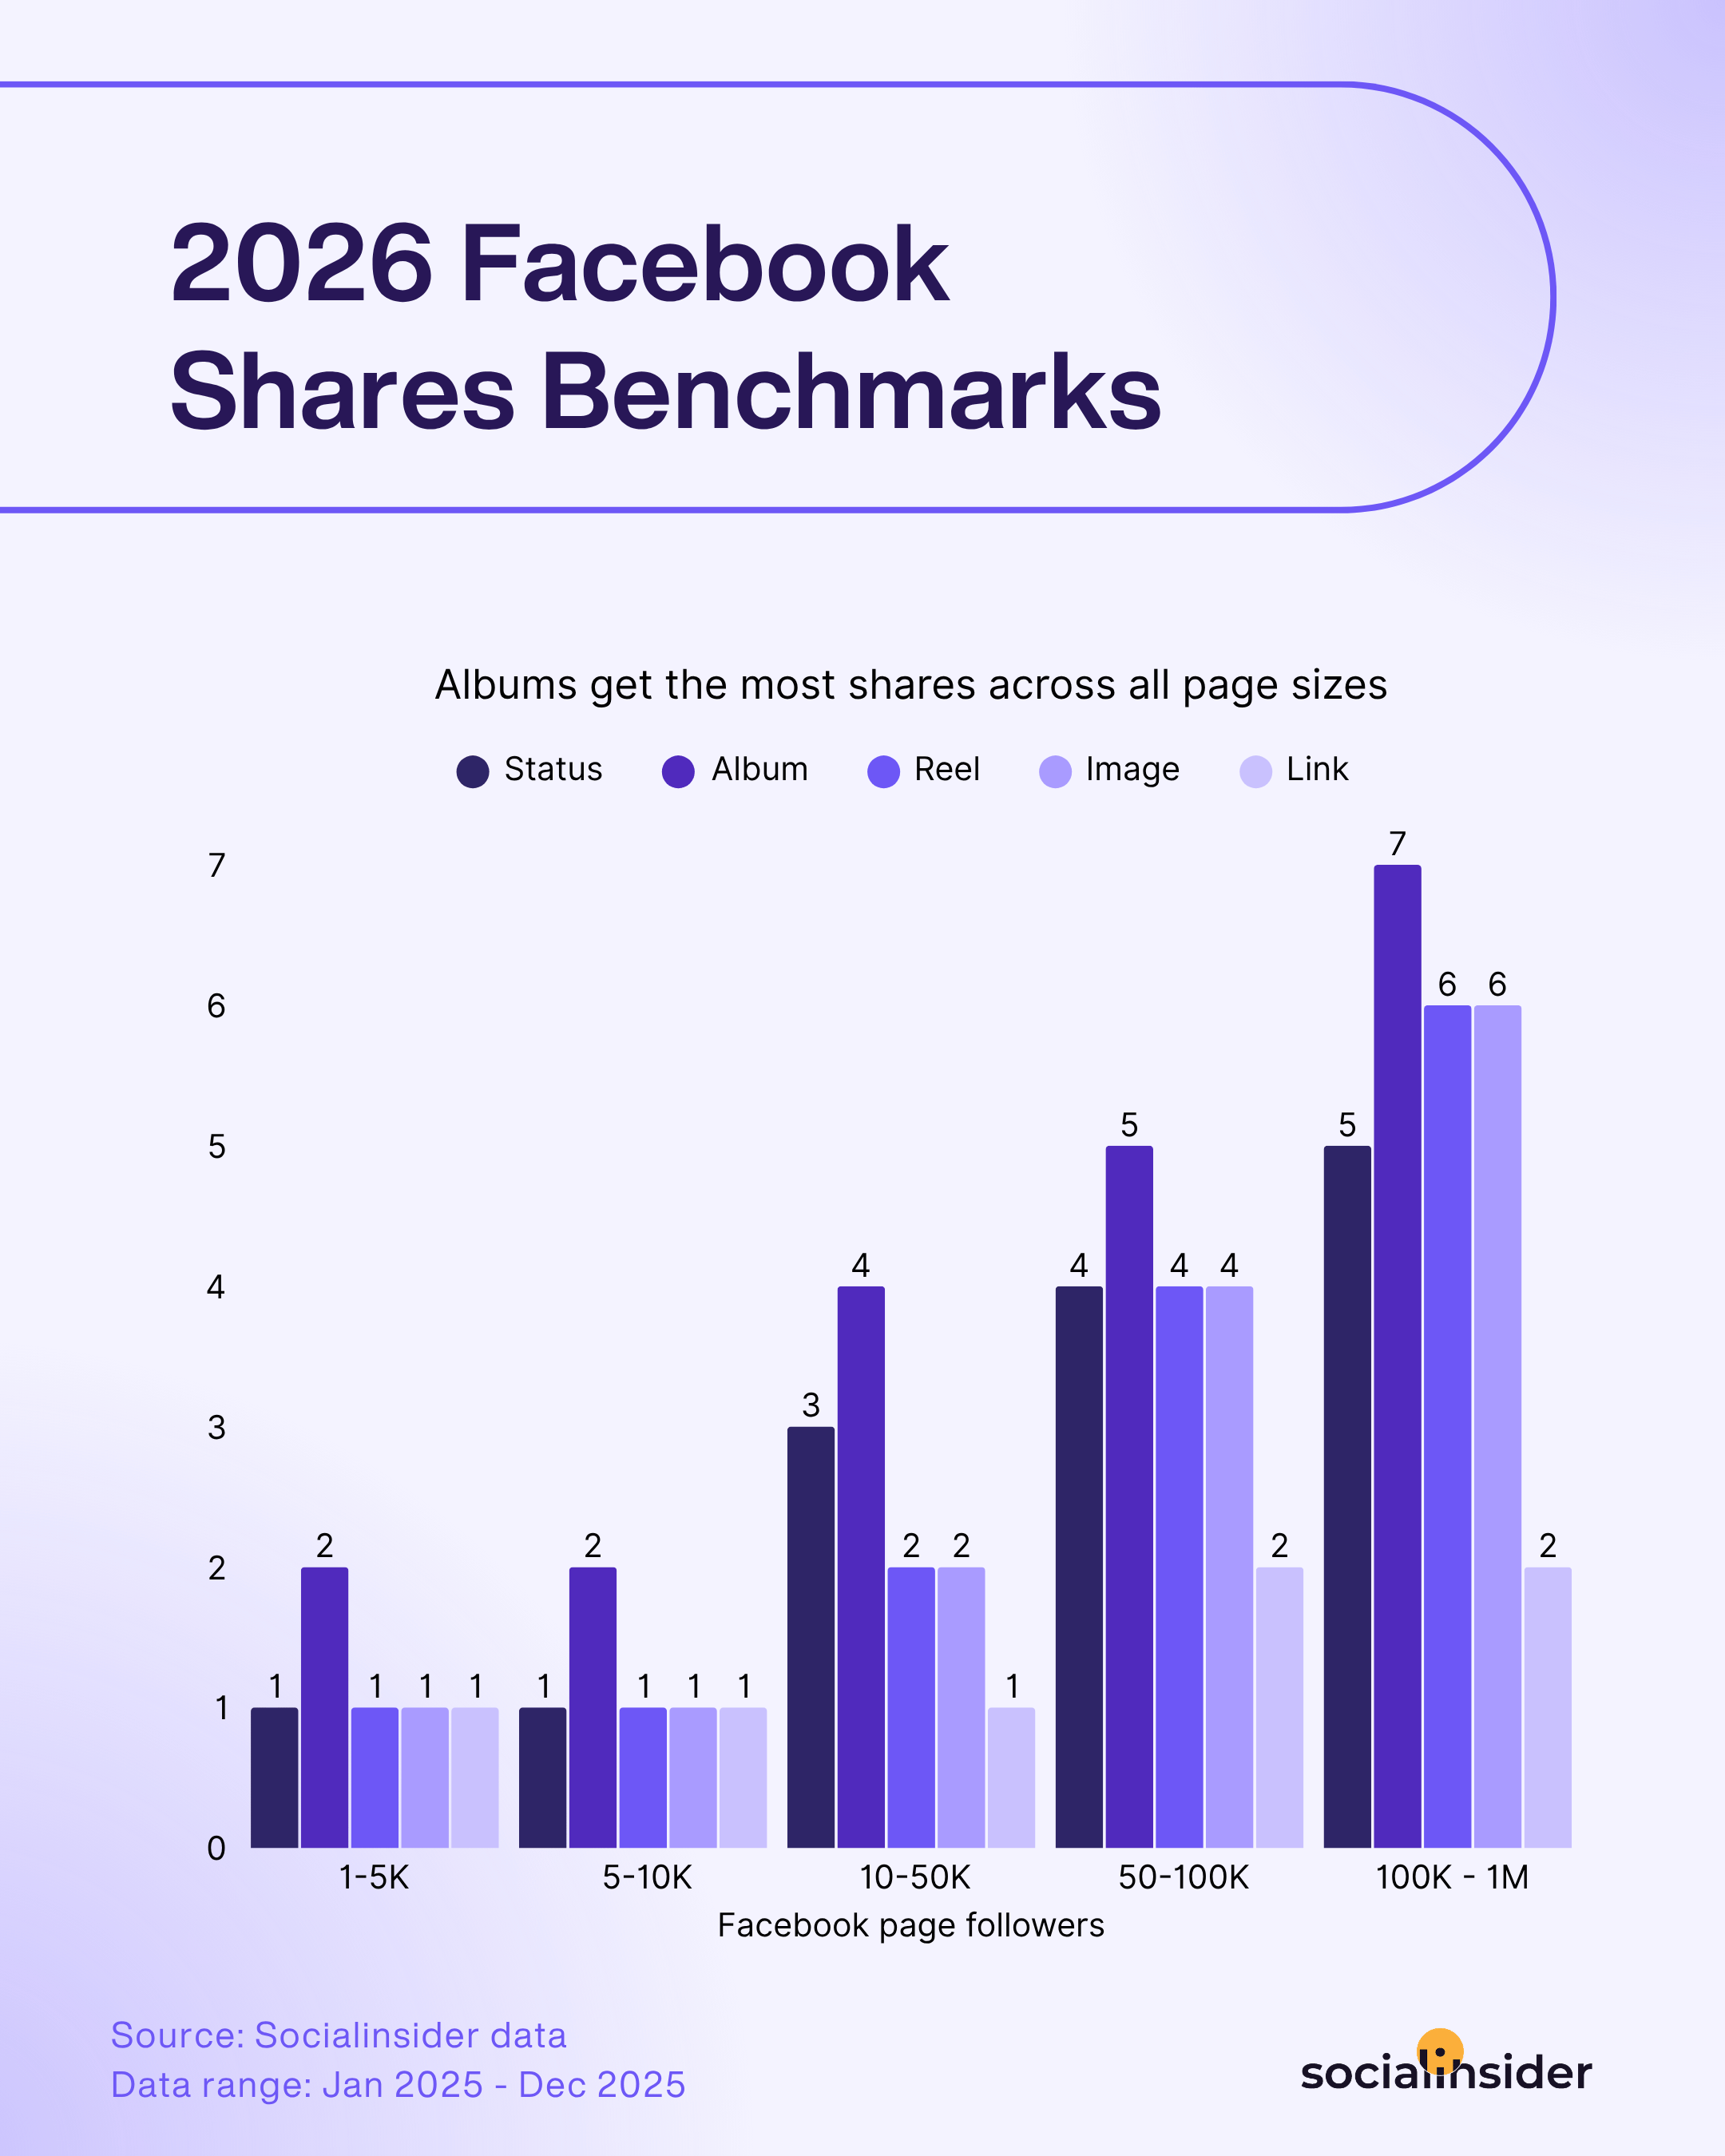
And when I looked at the average shares on Facebook across different content formats, one trend became very clear to me - that albums generate the highest number of shares across nearly every page size.
At first glance, that might seem a bit surprising. Many marketers assume that highly shareable content mostly lives in short-form video or quick visual posts. But albums have a unique advantage: they allow brands to package multiple visuals into a single, cohesive story.
Instead of presenting just one image, albums give audiences more context—whether it’s a product showcase, an event recap, a step-by-step process, or a curated collection of visuals. That richer storytelling format often makes the content more useful and, ultimately, more shareable.
Albums outperform other formats on reach because they extend attention in a way most posts don’t. Each swipe is a signal, another moment of active engagement, and those signals compound. Instead of a single interaction, albums create a sequence of micro-interactions that tell the algorithm this content is worth continuing to surface.
They also increase dwell time. People don’t just glance and move on, they explore. And in a feed where attention is fragmented, that extra time spent matters.
At the same time, albums multiply relevance. With multiple images, there are more entry points for different viewers, which increases the likelihood that someone stops, engages, or returns. - Heather Brinckerhoff, Vice President Social media and Digital Content, Great American Media
Strategic tactics to increase your Facebook shares
- Create “save and share” content. Educational posts, tips, and visual guides are more likely to be shared because people see them as useful resources.
- Use albums to tell a visual story. Instead of posting one image, group related visuals together—such as product variations, or event highlights.
- Encourage sharing subtly. A simple line like “Share this with someone who might find it useful” can increase the likelihood of distribution.
Average Facebook views
Views are one of the clearest indicators of how far content actually travels on Facebook. While engagement metrics show how people interact with posts, views reveal something slightly different—how much visibility a piece of content manages to generate.
And in a feed that’s becoming more crowded every year, visibility matters. The more people who see a post, the greater the opportunity for engagement to follow.
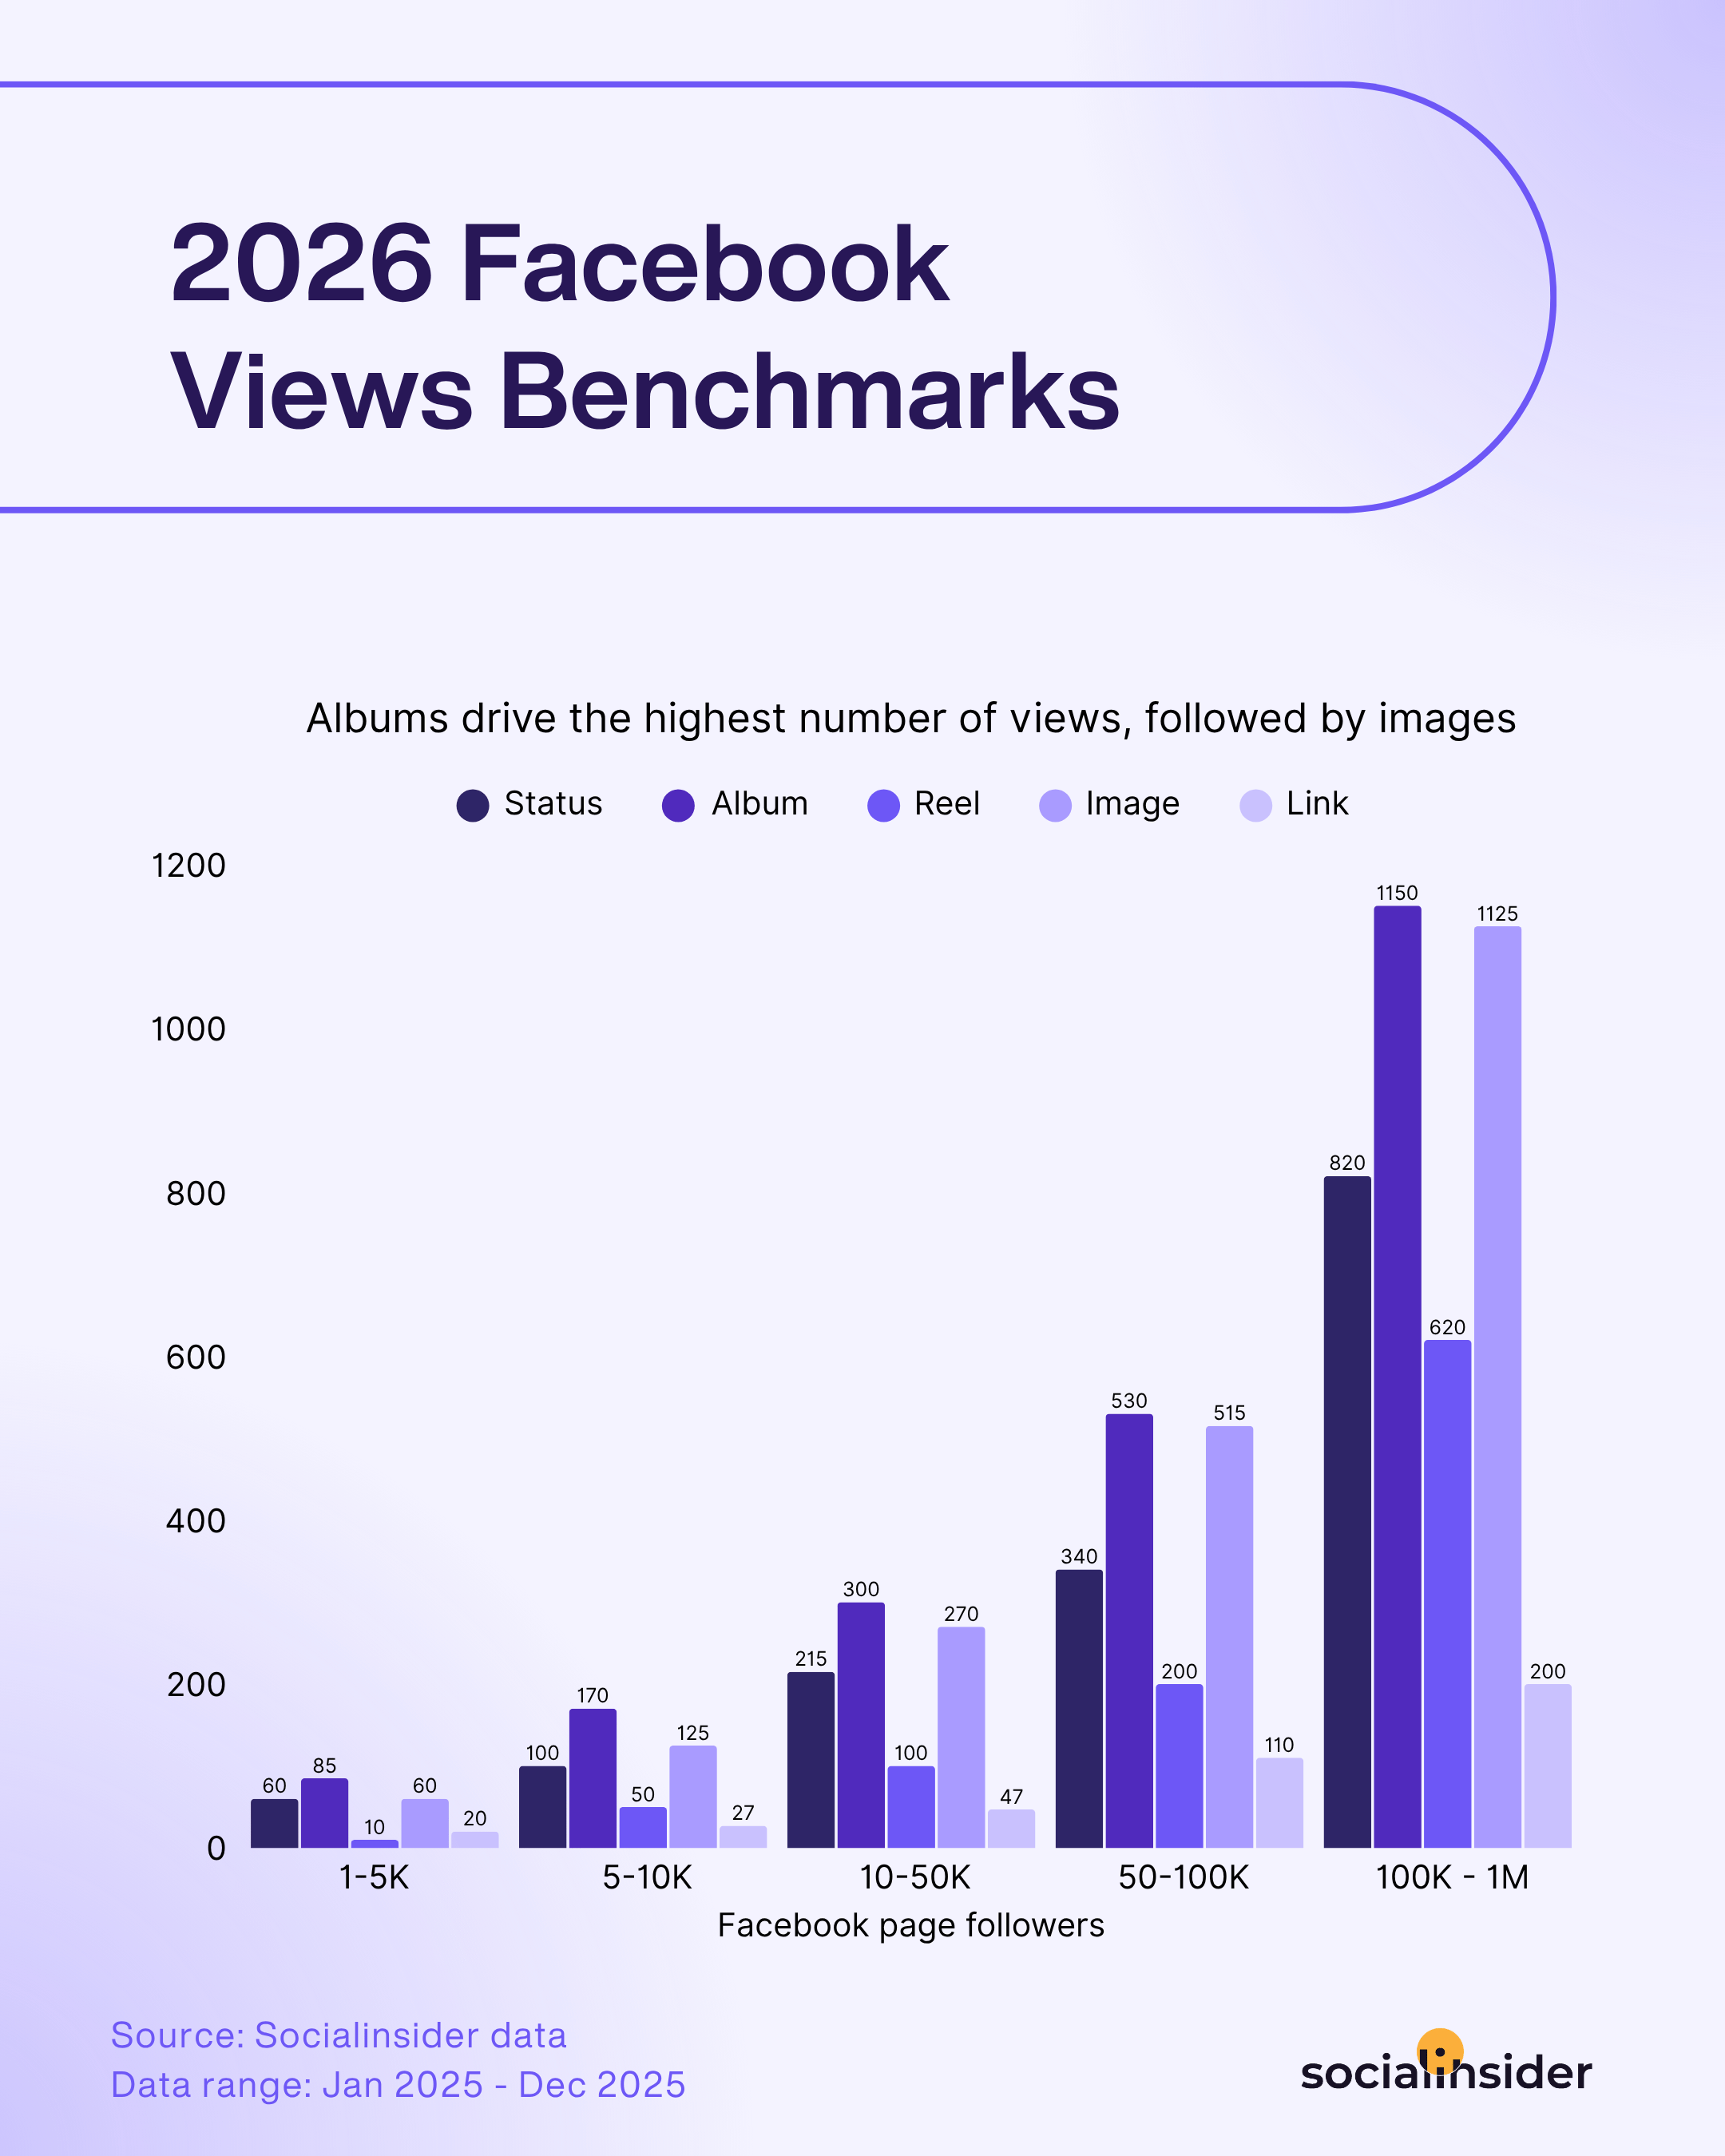
Looking at the average views on Facebook across different types of content, a clear pattern begins to emerge. Albums consistently generate the highest number of views compared to other formats.
This trend holds across pages of all sizes and highlights something interesting about how people consume content on the platform. For marketers, this insight reinforces an important strategic point: formats that encourage deeper interaction often gain more exposure.
Strategic tactics to increase your views on Facebook
- Use “before vs. after” sequences. Transformation-style albums (results, redesigns, campaign outcomes) tend to capture attention and generate higher viewing behavior.
- Repurpose carousel-style content from other platforms. Content designed for LinkedIn or Instagram carousels often performs well when adapted into Facebook albums.
- Use recognizable visual patterns. Consistent design styles or templates help followers instantly recognize your content in the feed, increasing the likelihood they stop scrolling.
- Promote album posts internally. Encourage team members or brand advocates to engage with the post early to help boost initial distribution.
Facebook posting frequency benchmarks
Posting frequency on Facebook has always been a bit of a balancing act. Post too rarely and it becomes difficult to stay visible in your audience’s feed. Post too often, and there’s a risk of overwhelming followers or diluting the impact of each piece of content.
That’s why looking at posting frequency benchmarks for Facebook can offer useful context.
And when comparing the latest data with the previous year, one change becomes obvious: brands are posting less frequently, reducing their publishing volume by 22%, to an average of 39 posts per month.
One of the reasons brands have reduced their posting frequency is because they are shifting their focus to visual platforms like Instagram and TikTok. With the rise of 9:16 video content and social media channels becoming full-blown media channels, brands are adapting to platforms that prioritize those features. Plus, as many brands shift to targeting Gen Z audiences, the future of purchasing power, which means their focus follows where these audiences doom scroll. - Mariya Spektor, Director of Social Media and Consultant
For a long time, links were a common format on Facebook. Brands frequently used them to drive traffic to blog posts, news articles, product pages, or external resources. But over time, the platform’s dynamics have changed.
Today, Facebook tends to prioritize content that keeps users within the platform rather than sending them elsewhere. As a result, posts that redirect audiences to external websites often struggle to generate the same visibility and engagement as native content formats.
That shift appears to be influencing brand behavior as well.
Instead of relying heavily on links, many brands are now leaning more into formats that encourage in-platform interaction.
Strategic tactics to optimize your posting strategy on Facebook
- Prioritize native content formats. Focus more on formats that keep audiences on the platform, such as status updates, albums, images, and Reels.
- Test different publishing rhythms. Experiment with posting patterns to find the frequency that works best for your audience.
- Monitor performance regularly. Reviewing posting frequency alongside engagement metrics helps identify which formats truly resonate with your audience.
There’s no one-size-fits-all approach to posting frequency. As Facebook’s algorithm becomes more sophisticated, success is increasingly driven by relevance rather than volume, meaning brands are adapting their approach.
The most effective frequency balances audience insight with having something meaningful to say. Some brands post multiple times a day because they’ve built a strong understanding of what their audience wants, while others post 3-4 times a week to maintain their quality and authority.
It also varies by context, local pages for example, can sustain higher frequency due to more engaged communities. - Daisy Castle, Social Media Manager, TUI
Facebook follower growth benchmarks
Growing a Facebook audience has become increasingly challenging over the years. In the early days of the platform, gaining followers was relatively straightforward—pages could grow quickly as more people joined the network and discovered new brands.
Today, however, growth tends to happen at a slower and more strategic pace. Many brands are competing for attention in an already crowded ecosystem, and audiences are more selective about which pages they choose to follow. That’s why tracking metrics like the Facebook follower growth rate has become essential for understanding how pages expand over time.
When peeking at the Facebook audience growth rate data, I discovered something interesting: that mid-sized Facebook pages are currently the most successful at driving sustained audience growth.
How so?
Well, smaller pages often struggle with visibility. Without a large existing community or strong distribution, it can take time for their content to reach new audiences consistently.
At the other end of the spectrum, very large pages frequently reach a different type of plateau. When a page already has hundreds of thousands—or even millions—of followers, maintaining rapid growth becomes naturally more difficult. The larger the base audience, the harder it is to sustain the same percentage increases over time.
Mid-sized pages, however, sit in a unique position. They’ve already built enough visibility and credibility to attract new followers consistently, while still having plenty of room to grow.
Mid-sized pages have momentum without bureaucracy. They're big enough to have figured out what works but small enough to still move fast and take risks. The pages under 10K are still testing everything. Mid-sized pages are in the sweet spot. They know their audience, they can still experiment, and they haven't been swallowed by corporate process yet. Growth happens when you can still be nimble. - Carolina Barbosa, Senior Social Strategist
And to conclude, if we were to look at the bigger picture as well, we could sum up that while 2024’s overall growth rate on Facebook was 12.20%, in 2025 this number doubled, reaching 23.20%.
Strategic tactics to accelerate your follower growth on Facebook
- Encourage followers to invite others. Community-driven growth can help expand audiences organically.
- Engage actively with comments and discussions. Active community management makes pages feel more dynamic and worth following.
- Leverage trending conversations in your industry. Participating in relevant discussions can introduce your page to new audiences.
Methodology
The Facebook data used for this analysis consisted of 25M Facebook posts published between January 2024 - December 2025 by 130,683 Facebook pages that had an active presence during the mentioned timeframe.
The average Facebook engagement rate is calculated by summing all the reactions, together with the comments and shares received on the posts published by a page in the selected time period and divided by the number of fans, then multiplied by 100 to get a percentage.
Average comments per post represents the number of comments a post receives, on average.
Average shares per post stands for the average number of saves a post receives on average.
Average views per post represents the number of views a post receives on average.
Average posts per month stands for the average number of views a Reels get, on average.
The average follower growth rate is calculated as the number of followers you gained divided by the number of followers you started with and multiplied by 100.
NOTE: This study contains 2025 values, presented as 2026, because, at the time of publication, there wasn't enough data for analysis, with the year just starting. That is why we bring quarterly updates, as the year unfolds and more data is available.
Get in-depth Facebook competitive insights
Run an insightful Facebook competitive analysis and get content optimization insights!
Ready to improve your social media strategy with real-time insights?
Get strategic insights, analyze the social performance across all channels, compare metrics from different periods and download reports in seconds.