Top Facebook Metrics To Track to Make Informed Business Decisions
See the most important Facebook metrics to track to gain powerful strategy optimization insights.

Feeling overwhelmed every time you need to make an executive Facebook analytics report? Been there. Facebook metrics are many, and it’s quite easy to get lost in all this data, let alone make sense out of it.
To turn those numbers into insights, you need to understand what each Facebook metric means and why you're tracking it in the first place.
In this article, I've broken down the Facebook metrics that actually matter — what they mean, when to track them, and how to use them to build smarter strategies. Let’s dig in.
Key takeaways
-
You don’t need to track every metric. Tracking everything at once makes it impossible to draw conclusions. Align your core metrics with your current objectives and track only what’s important.
-
Balance metrics tracking according to your goals. Follower count and likes are still important, but not sufficient on their own — make sure to evaluate them alongside more meaningful metrics like engagement rate.
-
Connect metrics to ROI where possible. Facebook has organic value. Try to connect the dots between organic efforts and ROI to speak stakeholders’ language.
-
Read metrics in context. Numbers alone don’t mean much. Intrepid your Facebook metrics in the context of your own previous performance, competitor analysis, and industry benchmarks.
What types of Facebook metrics should you track?
Facebook metrics can be too much when you're staring at the Meta Business Suite dashboard full of numbers.
But the good thing is, you don’t need to track all the social media metrics simultaneously. Just the ones that fit your current goals.
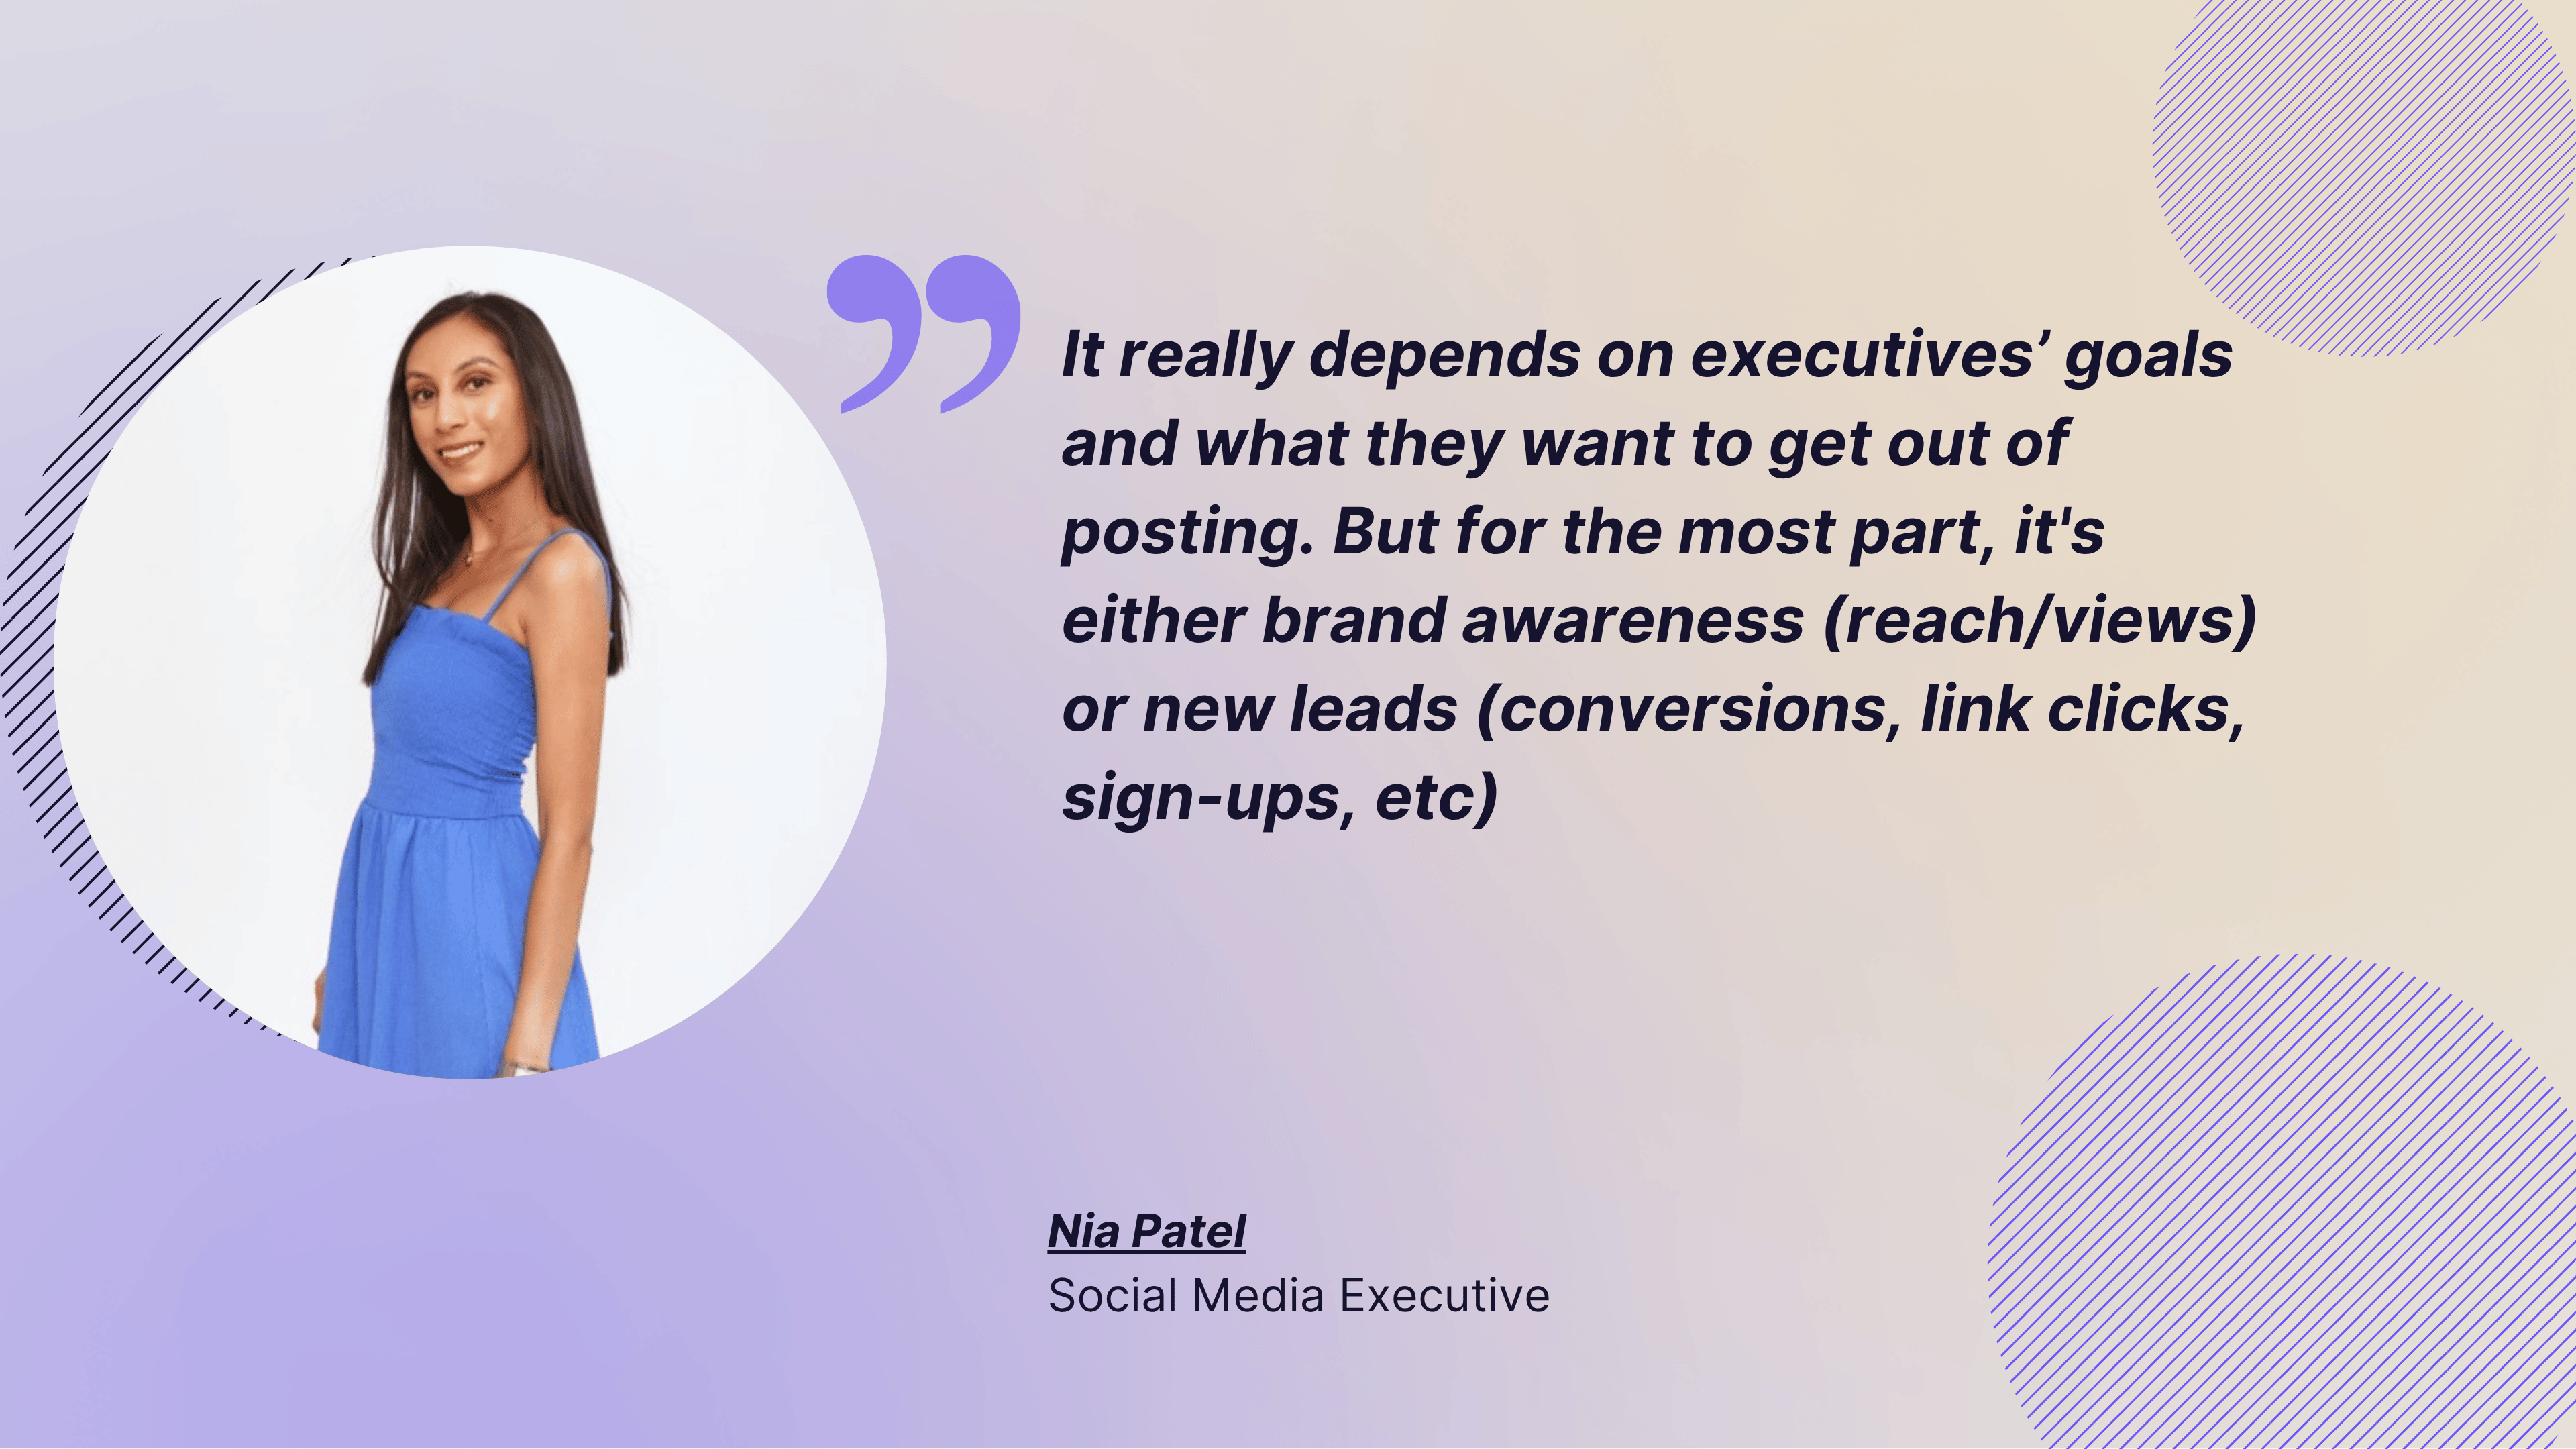
Here's what Nia Patel told me when I asked her about the most important metrics for her when reporting to executives:
It really depends on executives’ goals and what they want to get out of posting. But for the most part, it's either brand awareness (reach/views) or new leads (conversions, link clicks, sign-ups, etc).
And I agree — it totally depends on the goals. When you’re choosing the metrics you want to track, focus on those that follow your specific buyer journey and fit your current objectives.
For example, if your goal right now is brand awareness, your core metrics would be reach, views, and follower count. But if your focus is on conversions and the bottom of the funnel, you’ll care more about engagement rate, click-through rate, and link clicks.
What are the main Facebook metrics categories that will help you make informed decisions?
You can divide the Facebook metrics into several main categories based on what they're tracking. These categories align with different goals and stages of your customer journey.
Understanding these categories helps you navigate faster and choose what to track based on what you're trying to achieve.
Let’s break down the core categories of Facebook metrics:
Facebook reach and visibility metrics
These metrics tell you how visible your content is: who's seeing it and how often. They're your first line of insight into whether your Facebook content is making it in front of people.
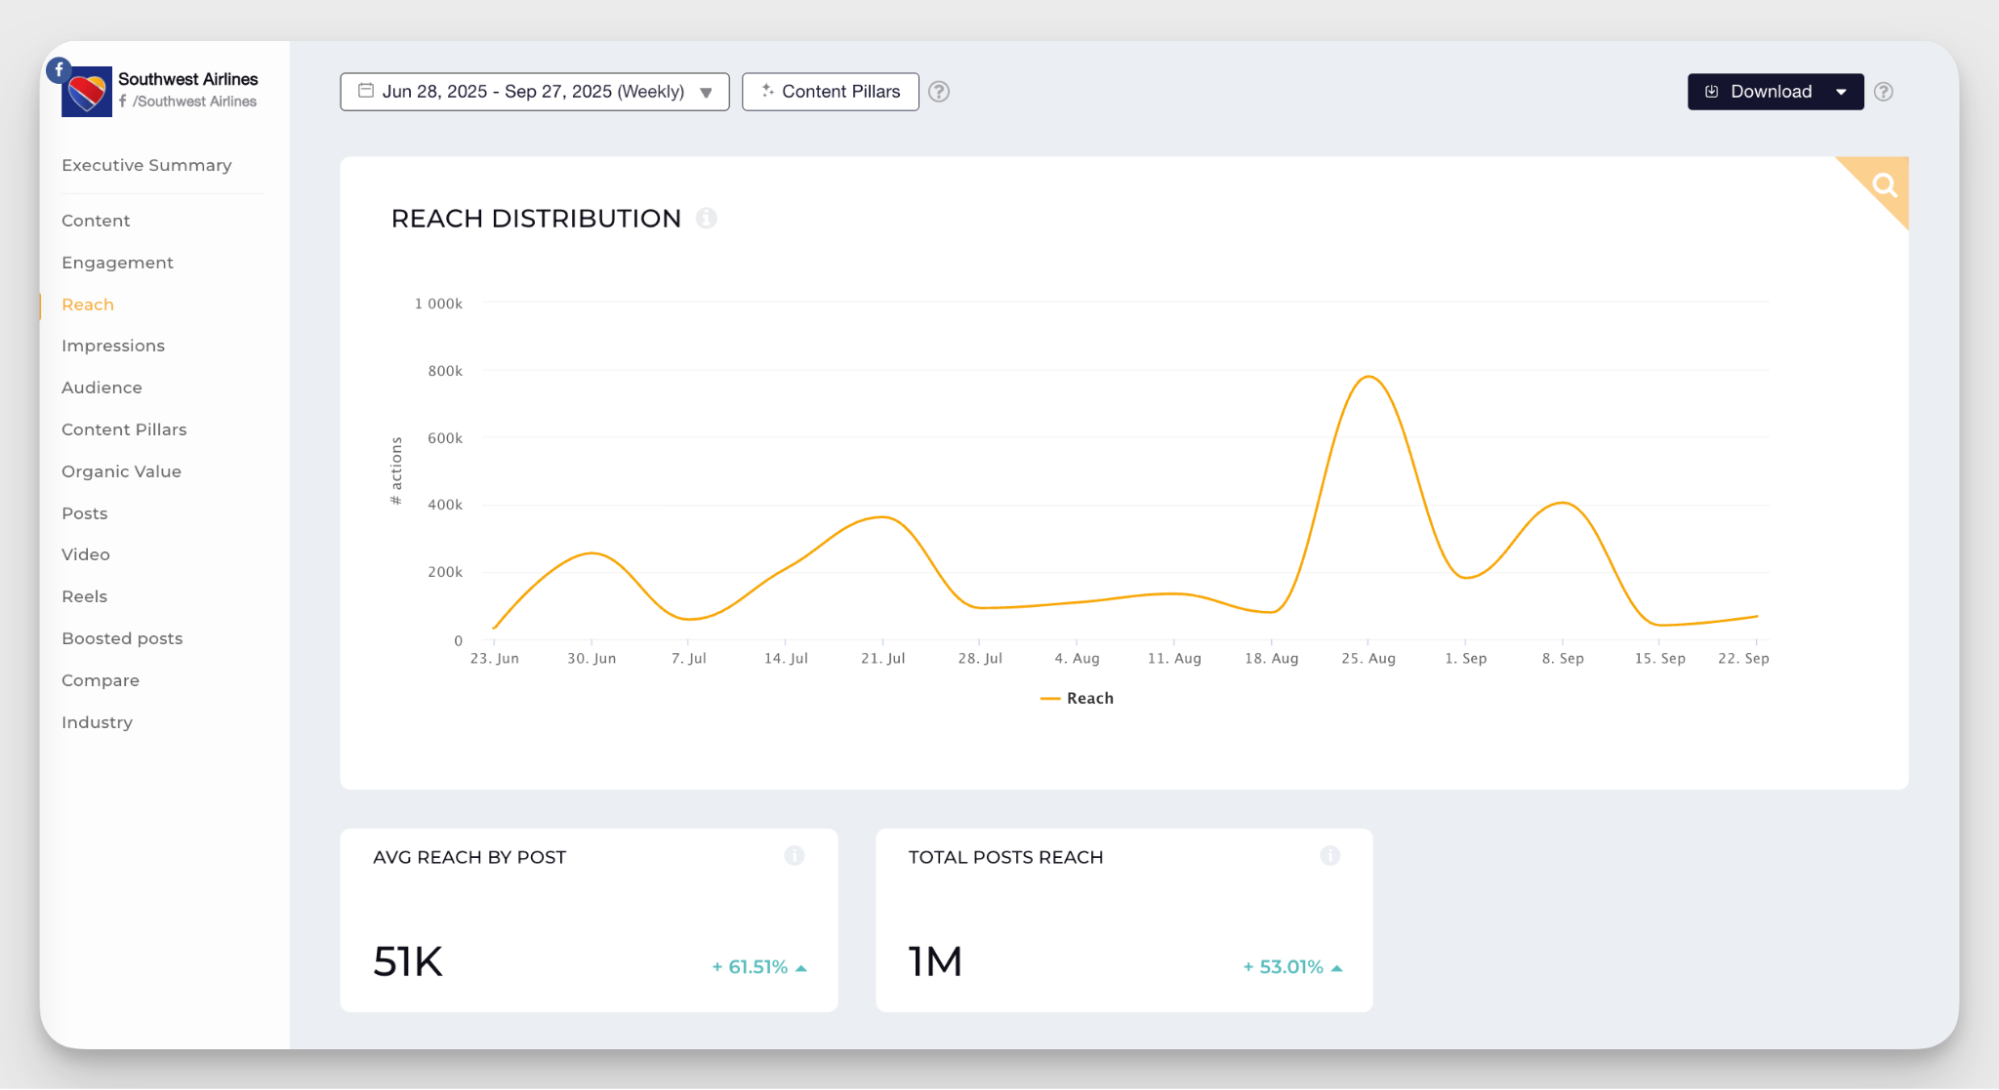
Reach
Facebook reach shows how many individual people have seen your content. The difference between reach and impressions on Facebook is that reach counts each person only once, no matter how many times they saw your post.
Like most metrics, reach doesn't work alone. It pairs with other Facebook metrics to give you a fuller picture. But it's especially useful when you need to calculate the approximate volume of your potential audience.
I pay closer attention to reach when running brand awareness campaigns. If I'm trying to introduce a brand to new people, I need to know how many individuals actually saw it compared to before the campaign started. Did we expand our footprint, or are we just talking to the same crowd?
When you’re after new people, go for reach.
One thing to keep in mind: many platforms — Facebook included — estimate reach rather than track it exactly. The numbers can shift slightly over time as the platform refines its calculations.
Impressions
Impressions on Facebook measure how many times your content has been seen in total. Unlike reach, impressions include every time someone scrolled past your post, whether it's the same person seeing it twice or ten different people seeing it once.
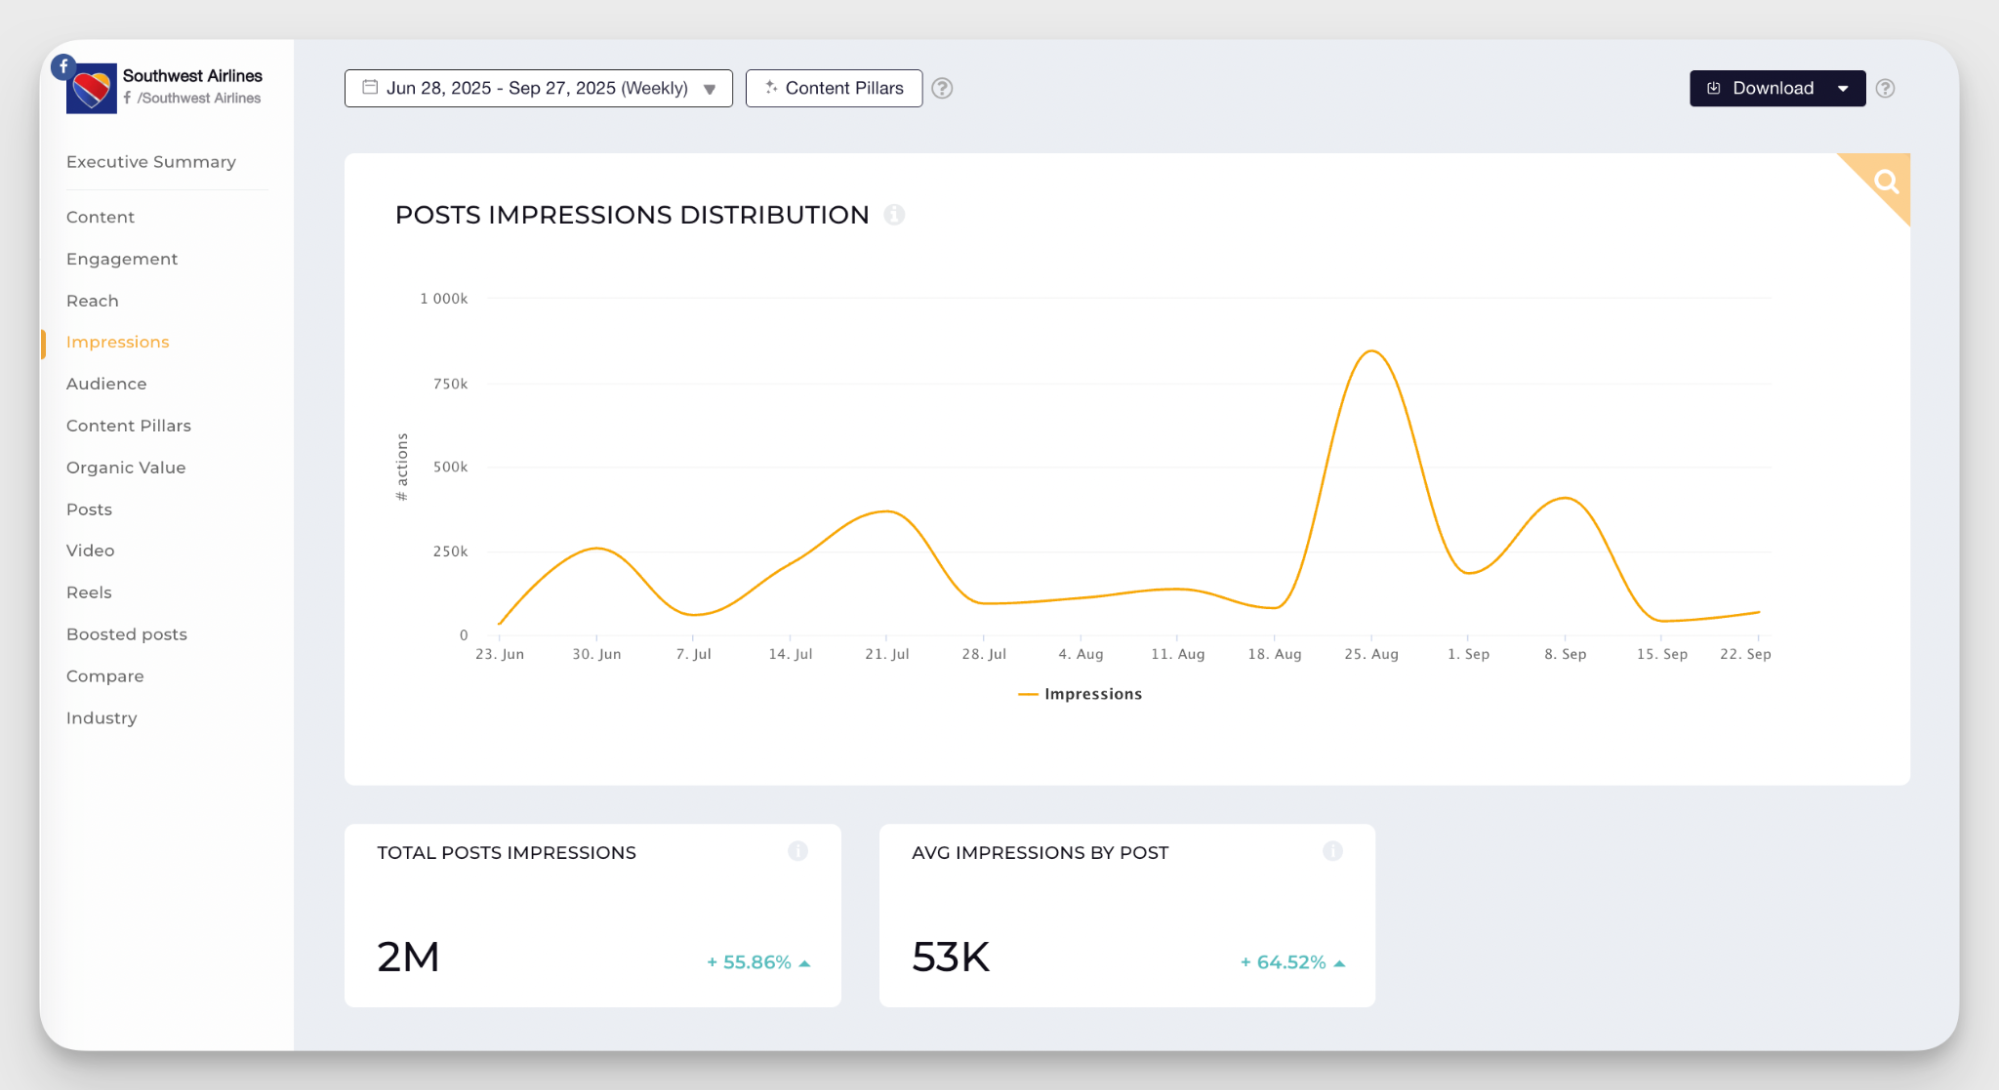
The difference between reach and impressions on Facebook is that while reach tells you about audience size, impressions tell you about frequency. And sometimes, frequency matters more.
For example, when I'm running a campaign with a specific message I want to stick, like a limited-time offer or an event reminder, I track impressions. Seeing the same post multiple times increases the chance people will remember it or finally take action.
Mentions
Mentions happen when someone tags your Facebook page in their post, comment, or story. It's a way for customers, partners, or other brands to engage in a dialogue with you.
Tracking mentions gives you insight into how people talk about your brand when you're not the one starting the conversation. I find mentions especially important when managing reputation or community engagement.
If you're running a campaign encouraging user-generated content, or if you've just launched something new, watching mentions helps you spot opportunities to join conversations or address concerns before they escalate.
Facebook audience metrics
Reach and impressions tell you how many people see your content. Audience insights tell you who those people are and whether your follower base is growing or stagnating.
Audience demographics
Facebook helps you analyze your audience with demographic data, such as age, gender, and location. You can also see insights into when your audience is most active.
This data gives you context about who's on the other side of the screen. Coming up with marketing personas is fun, but real data tells you how to tailor your content to resonate.
I once worked with a client who assumed their audience was primarily women aged 25–34 because that's who bought their product in-store. But Facebook analytics showed their engaged audience is slightly older — women 45–54 were the most active group on the page. Turns out, they were buying for their younger relatives. That insight shifted the entire content strategy.
Follower growth
Follower growth is straightforward: is your Facebook page gaining followers, losing them, or staying flat?
Many social media managers call this a vanity metric alongside likes, but I think that's too dismissive. Follower count often matters to stakeholders, and the platform's algorithm tends to favor accounts with healthy growth.
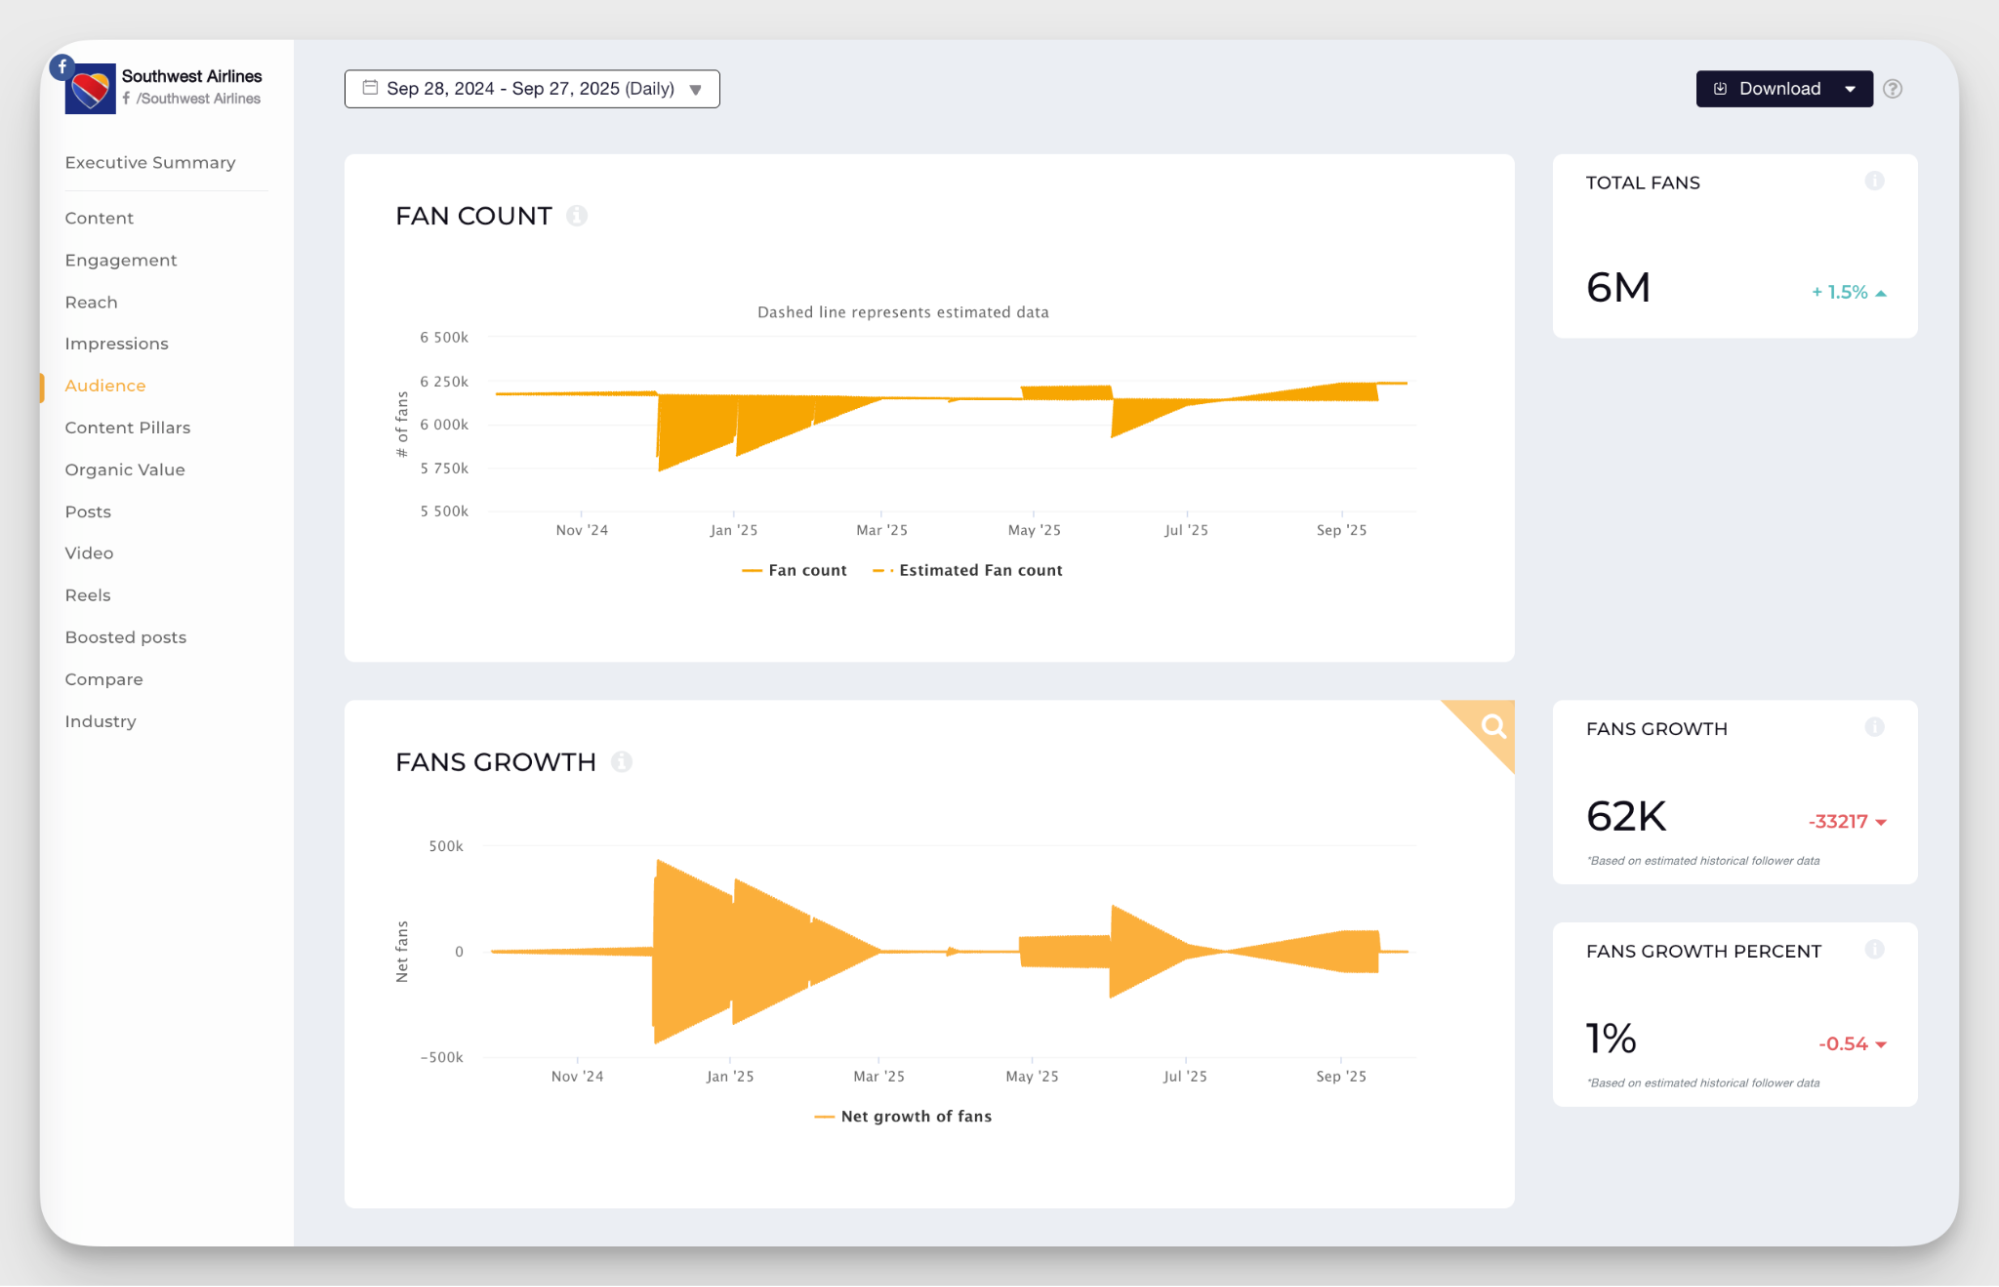
More importantly, follower growth reflects whether people find your brand worth following, and that's the first step in moving them down the funnel.
I track follower growth for two main reasons. First, to measure organic growth. If followers are steadily increasing, it means content is resonating and people want more.
Second, to evaluate campaigns. Did that ad spend bring new followers? Did the influencer partnership lead to a spike? Growth tells you whether your efforts are expanding your audience or just spinning wheels.
I always keep follower growth on my radar. It's not a self-sufficient metric, but it's an important signal that sits behind almost everything else you do on the platform.
Facebook core engagement metrics
Engagement metrics are the signals that tell you if your content is resonating. This group of Facebook metrics shows whether people interact with your content or just scroll past.
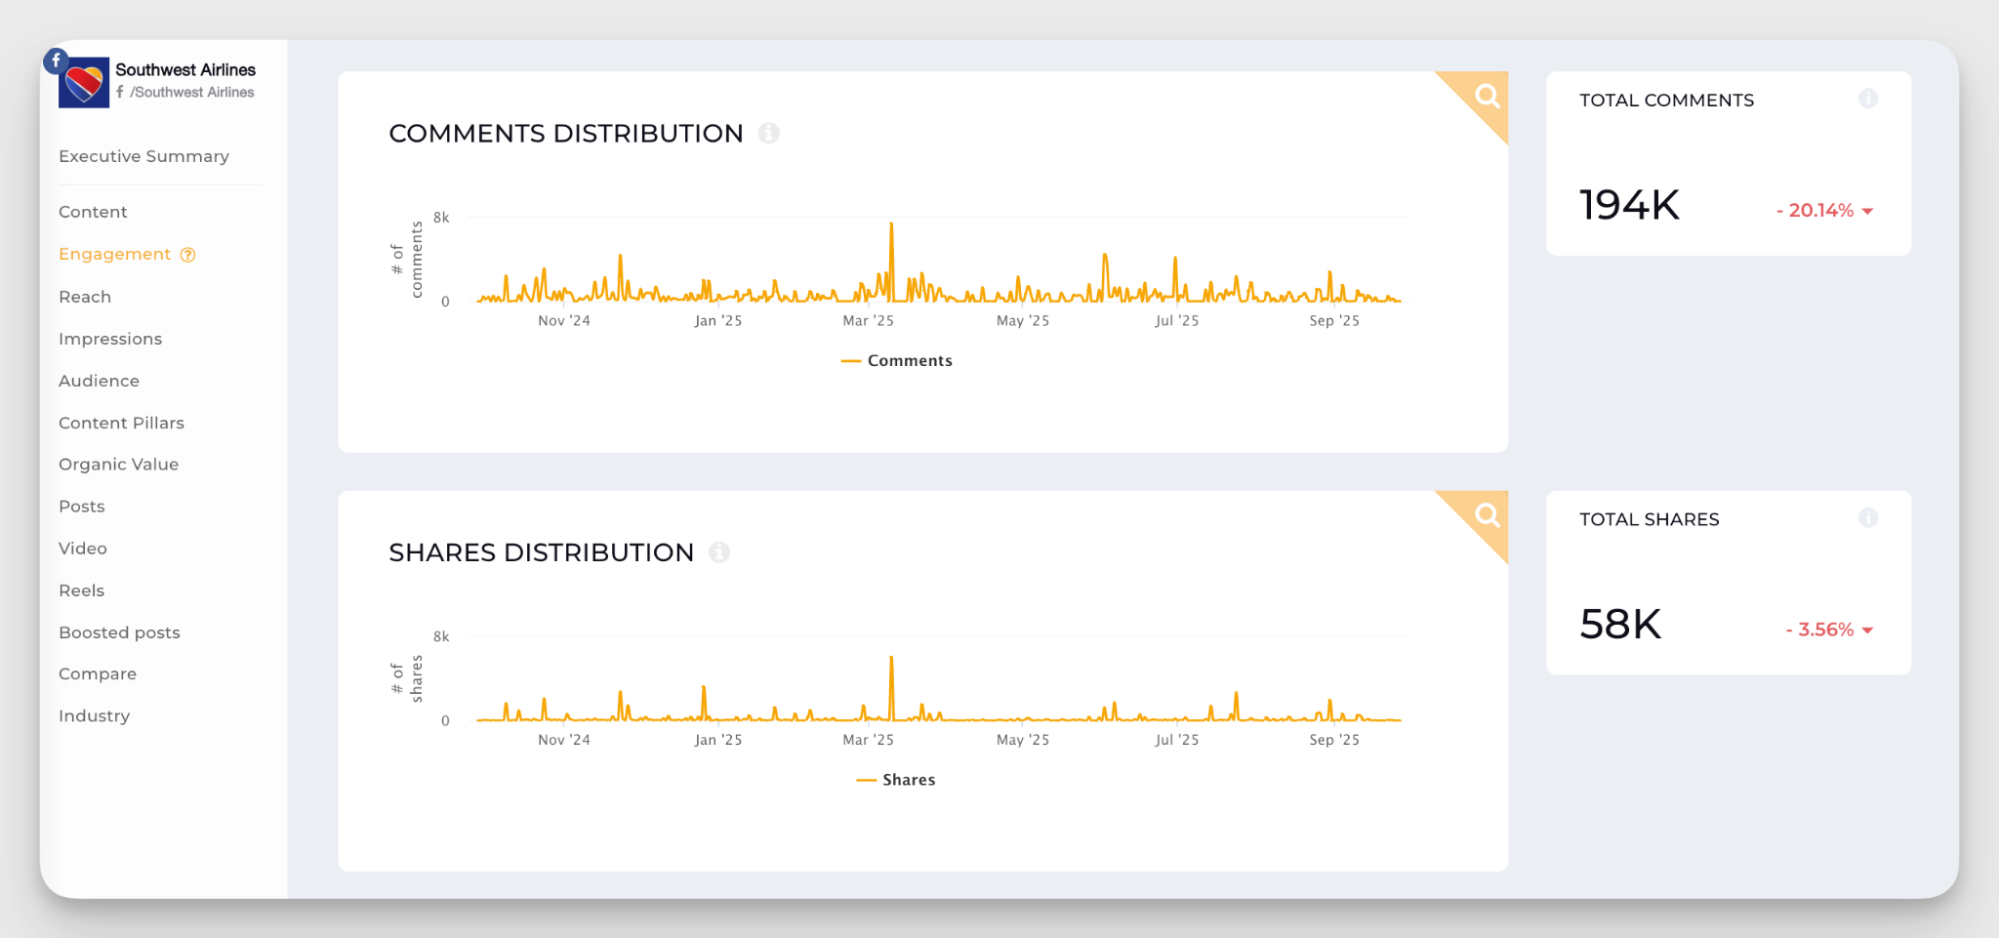
Likes, comments, shares
The holy trinity of social media engagement metrics, these are your general markers of engagement.
Likes are likes — they show the simplest appreciation, comments indicate someone took the time to respond, and shares mean your content was valuable enough for someone to pass along to their own audience.
On its own, a like doesn't mean much. But together, these actions add up to something more important: your engagement rate. And that's where the real insight lives.
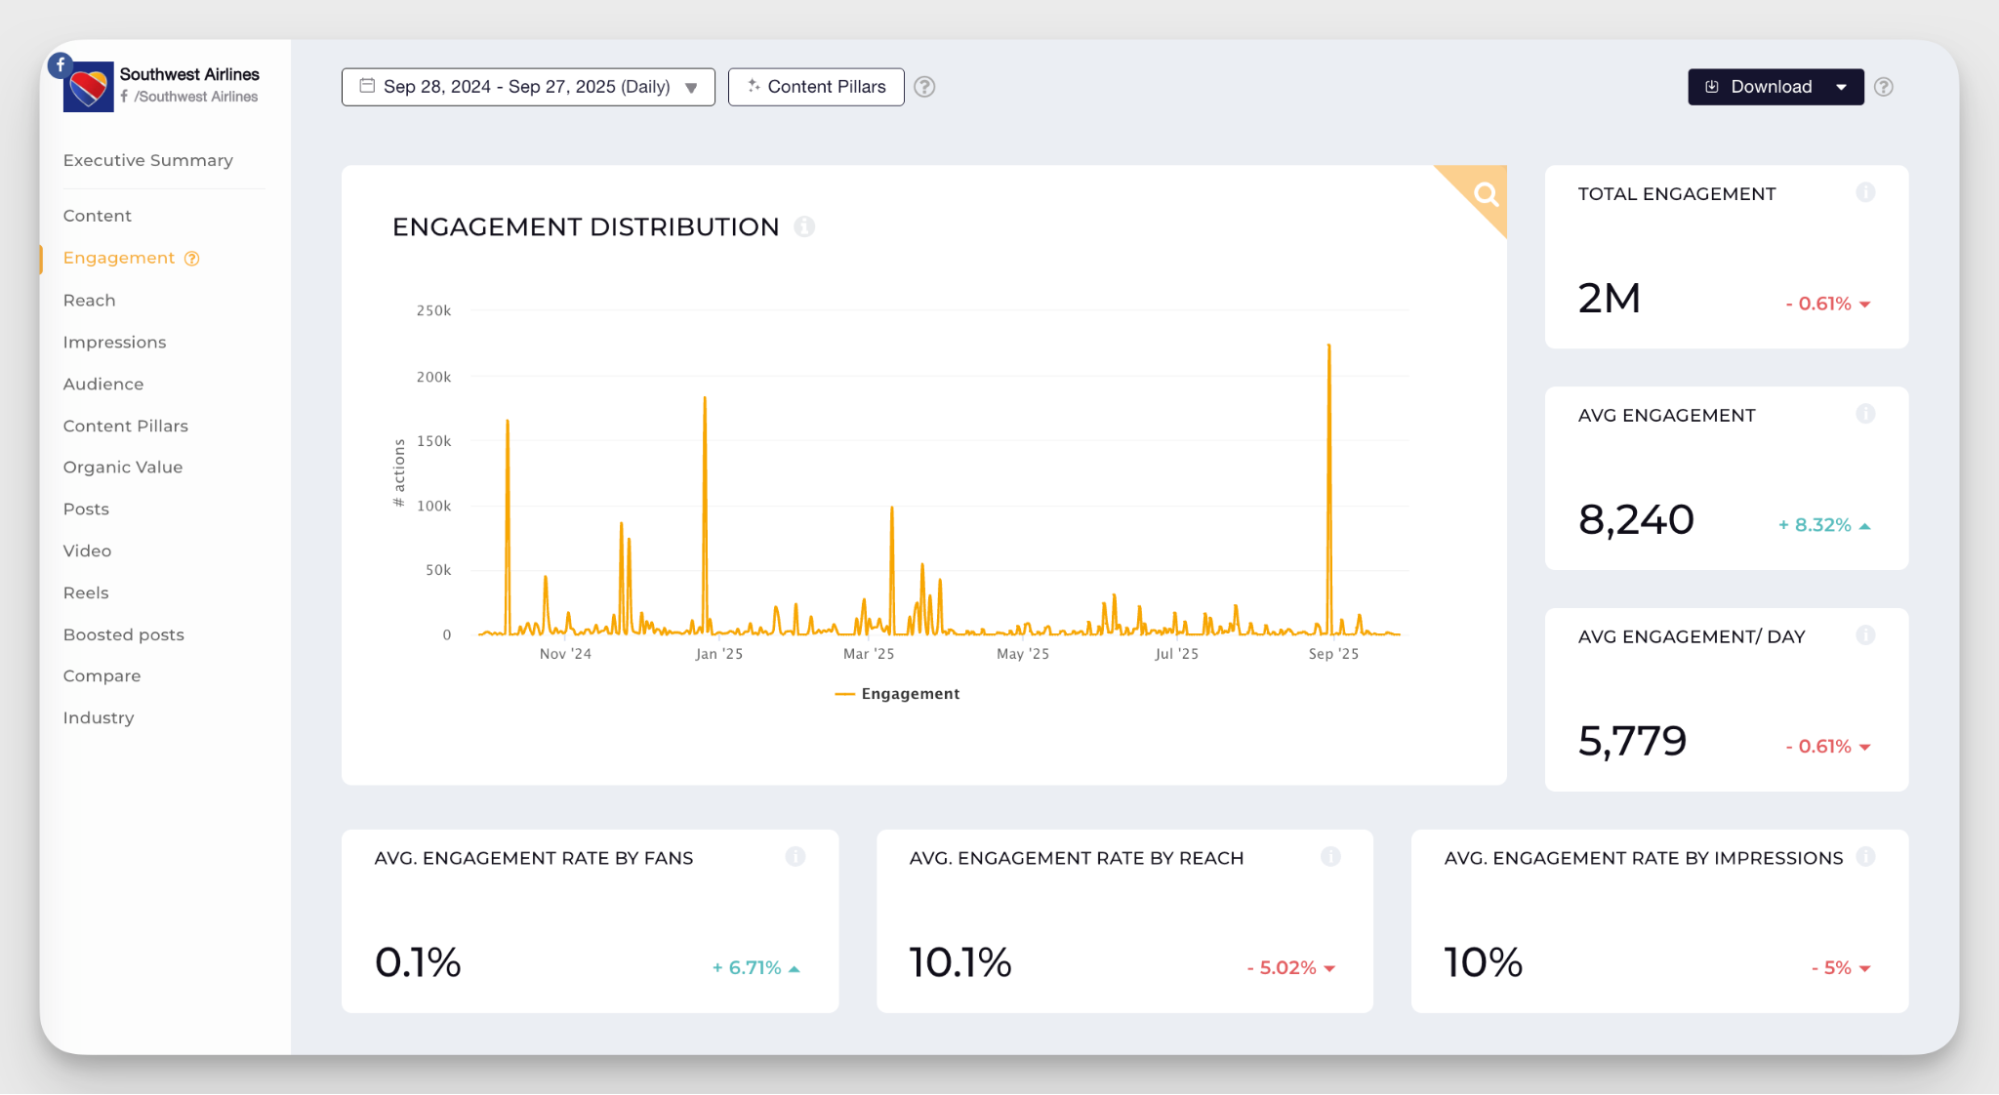
Engagement rate
Engagement rate on Facebook is one of the most useful metrics you can track.
But here's the thing: there are different ways to calculate it, and the version you use depends on what you're trying to measure.
Engagement rate by followers shows how much your current audience interacts with your content. It's calculated by dividing total engagements (likes, comments, shares) by your follower count.
I use this when I want to understand how well I'm retaining and activating the people who already follow the page. If you're focused on deepening relationships or moving your existing audience down the funnel, this is your metric.
But engagement by followers might not be enough if your goal is growth.
Engagement rate by reach divides engagements by the number of people who saw the post. This one tells you how well your content performs with everyone it reaches, not just your followers.
I track this when evaluating broader campaigns, boosted posts, or content aimed at attracting new audiences.
In my work, I personally prefer to have engagement by reach as my baseline and calculate other engagement rates if a particular campaign requires it.
Additional engagement metrics for powerful insights
Core metrics are enough to fulfil your KPIs, but sometimes, you need to dig a little deeper to get a better insight. When talking about reading into your metrics, Jazz Starling said:
Have KPI's set, but pay attention to details. Look at what works and what doesn't, and make room to point out some interesting results in other metrics. It can be useful in the strategy. Quantity is good, but quality is key to many questions the clients bring to the table.
Basic engagement metrics give you the headlines for your executive reporting. These additional engagement metrics are not exactly KPI-worthy, but they help you read between the lines and spot patterns to shape a smarter, more efficient content strategy for Facebook.
Content format performance
Not all content formats perform equally. Text posts, images, videos, and carousels can resonate differently on Facebook. Breaking down performance by type helps you see what works with your particular audience.
The key here is looking beyond total likes or comments. Check the engagement rate for each format. A video might rack up more likes simply because you post more videos, but images could have a higher engagement rate per post.
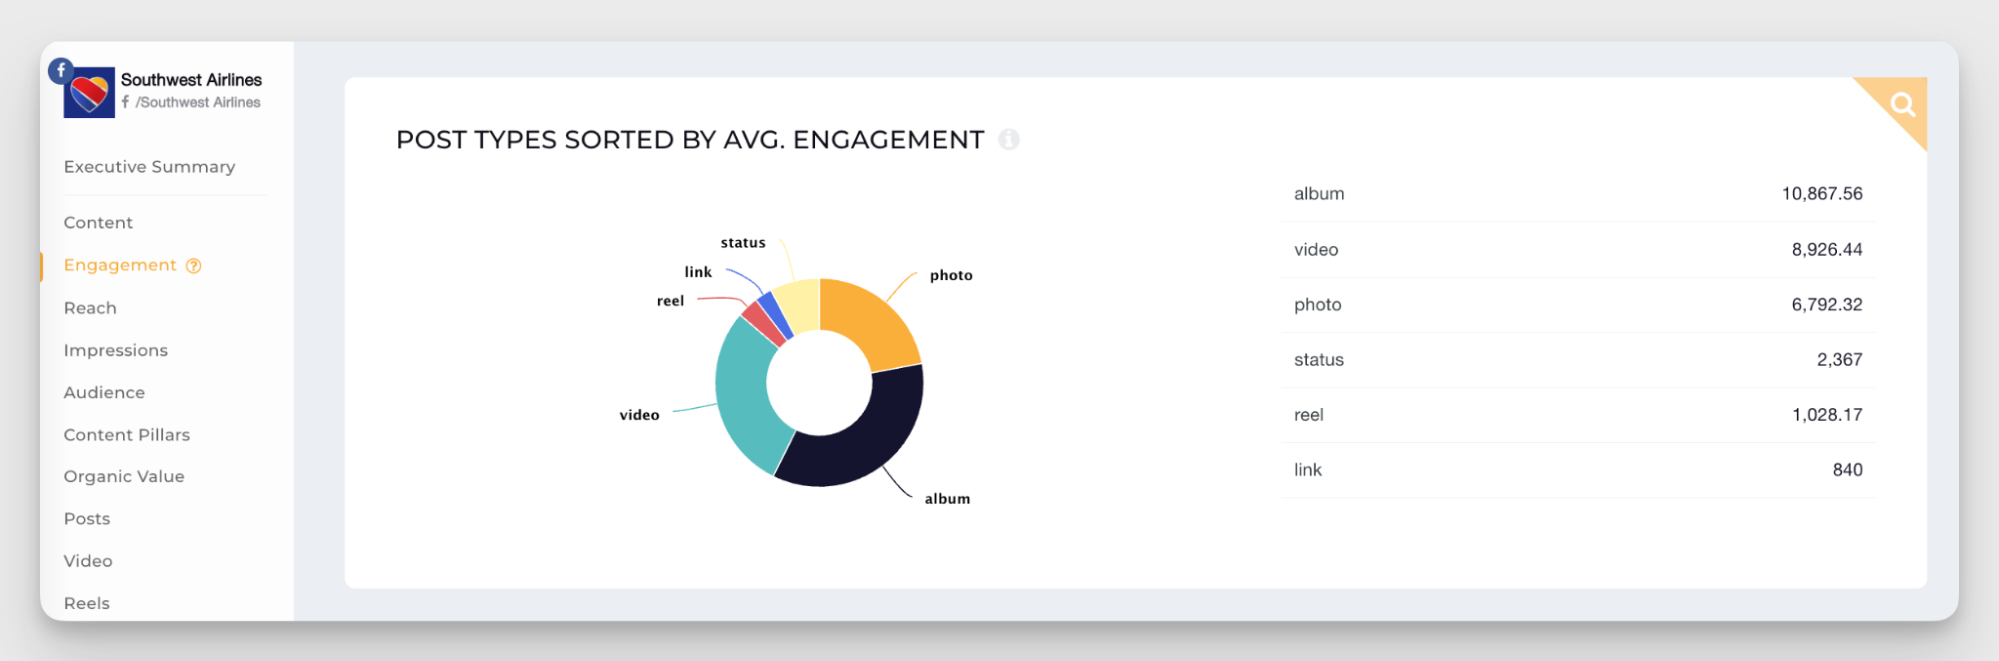
Meta's native analytics don't make this easy to track. But Facebook analytics tools like Socialinsider digest it for you so you can spot trends without manually sorting through every post.
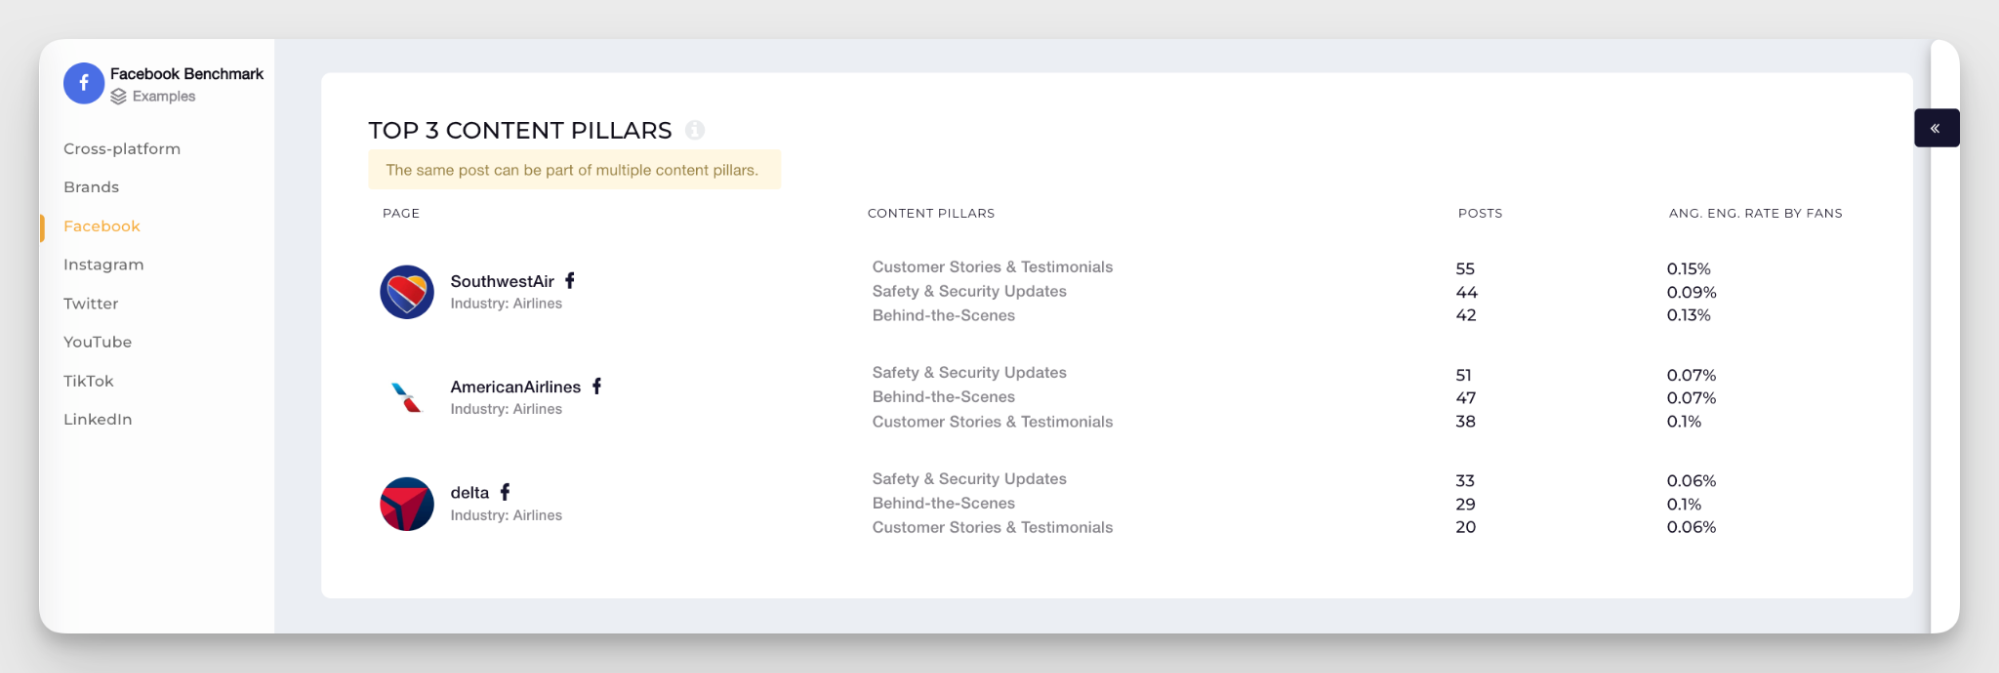
Best-performing content pillars
Content pillars are the recurring topics you come back to — the themes that structure your content strategy. Grouping posts by pillar helps you plan better and read your social media analytics more clearly.
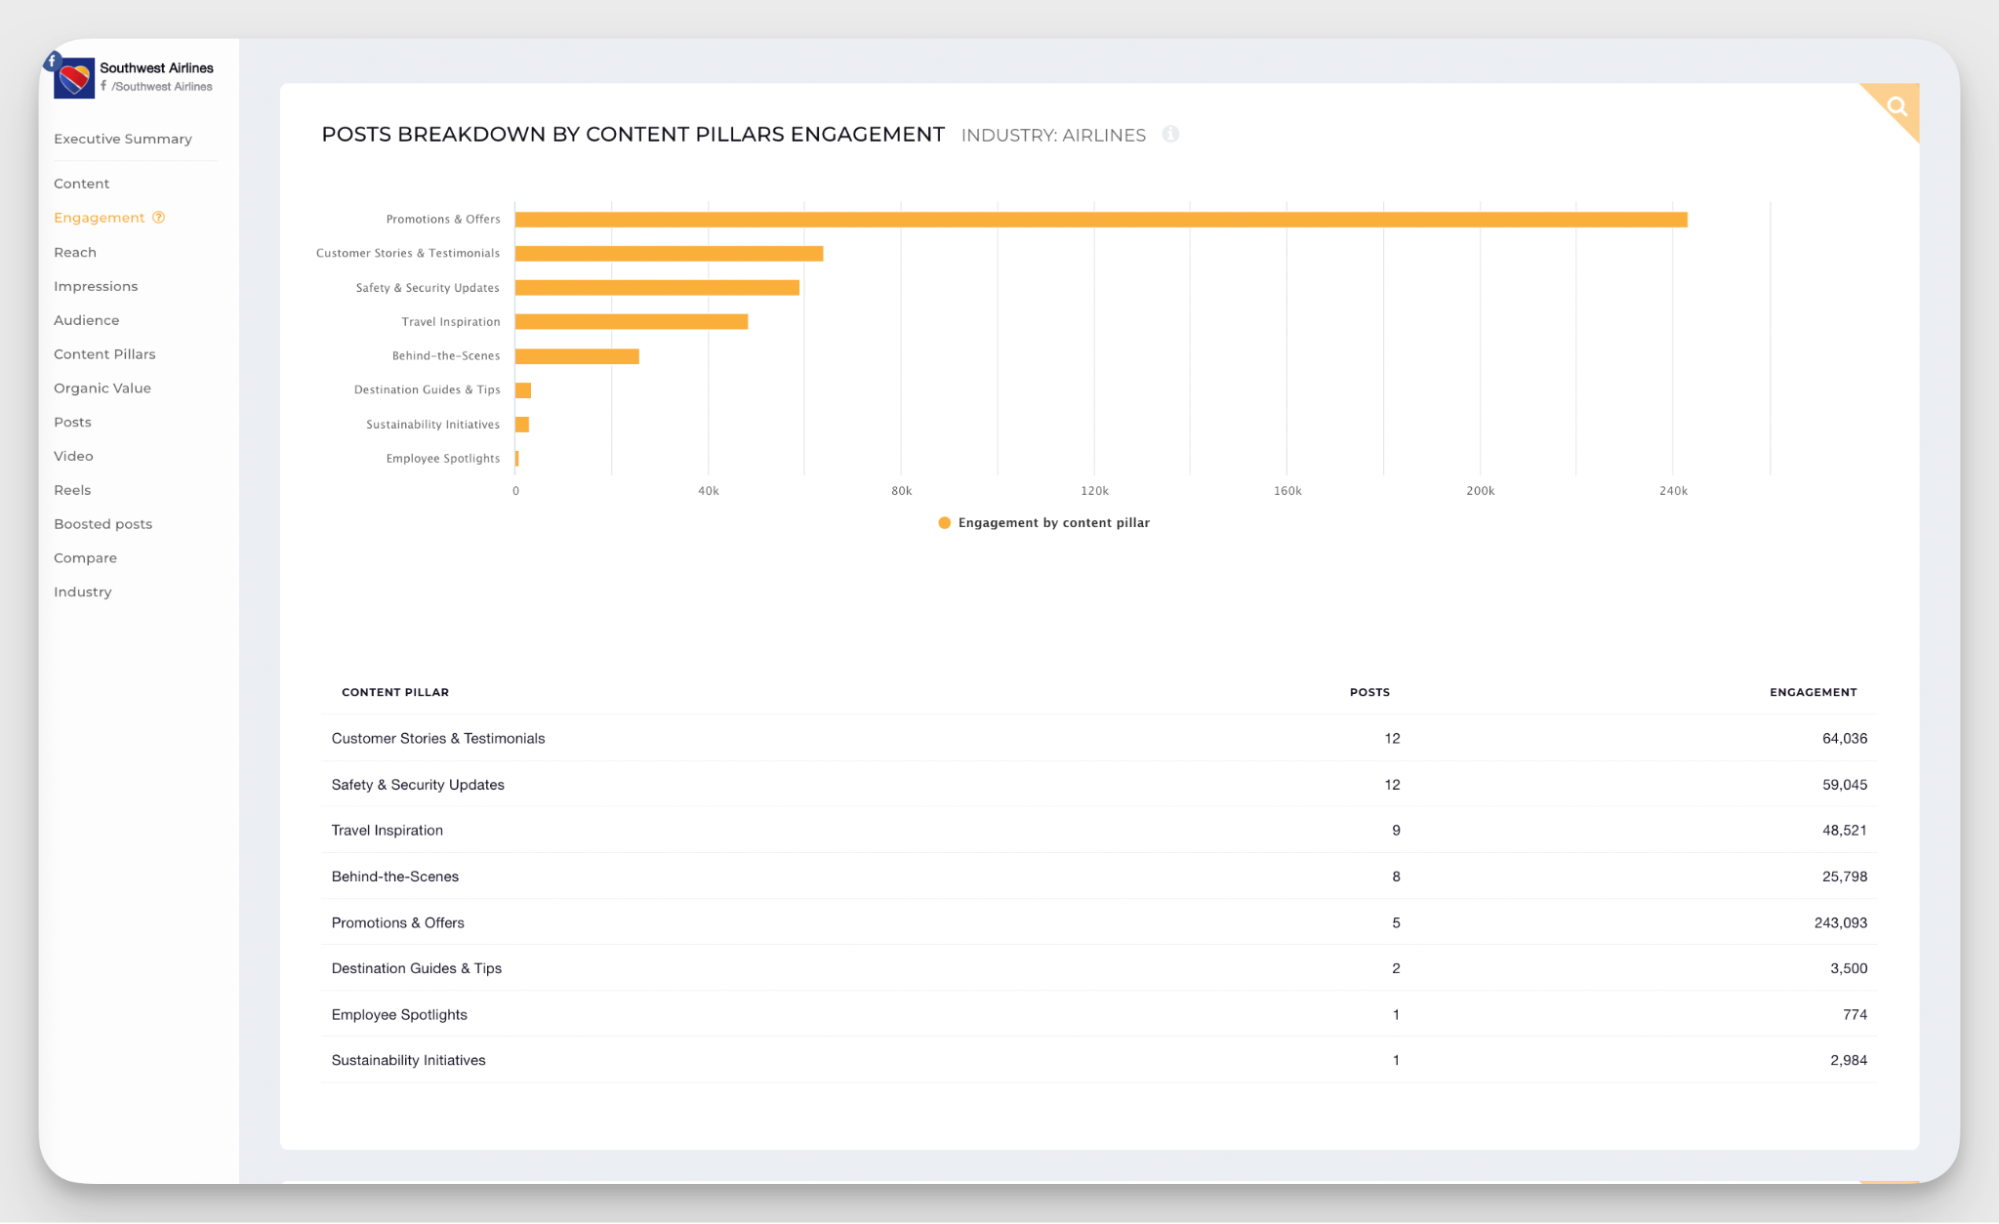
Tracking which pillars perform best on Facebook doesn't mean you abandon everything else and double down on one topic. But it does help you allocate effort more strategically and make use of a data-driven marketing approach.
I had a client who was convinced their audience loved behind-the-scenes content. It was a big part of our social media strategy. We spent a lot of time and effort from a small team creating detailed production videos.
But when we broke down performance by content pillar, behind-the-scenes was middle of the pack. At the same time, user-generated content, which we barely touched, was significantly outperforming everything else.
That data shifted our entire approach. It also saved us hours of unnecessary production work.
Comment sentiment analysis
No social media content analysis is complete without a sentiment check. A hundred comments sounds great until you realize half of them are complaints, bots, or people arguing in your comment section.
Sentiment analysis helps you understand the actual tone of your engagement. Are people excited, frustrated, confused, or just spamming? This context matters, especially when you're reporting results or deciding whether a post truly succeeded.
Facebook conversion metrics
Conversion metrics are crucial for proving social media ROI and the impact social media has on business.
When Katie Murphy talks about her clients, she notes:
Some clients care only about brand awareness, while others are only bothered about leads and conversions.
But social media doesn't have to be only one or the other. A balanced strategy ensures both goals are ticked. You're just prioritizing one over the other depending on where you are in your marketing cycle.
If you're leaning toward the conversion side right now, here are the core metrics to track.
Organic traffic and lead generation metrics
Conversions don't only come from paid ads — they can be organic, too. Facebook allows you to attach links to your posts (even if the algorithm isn't thrilled about it), and you can still measure traffic and leads from organic content with a bit of precision.
Link clicks
Link clicks tell you how many people clicked on the link in your post. You can see this metric directly in Facebook Insights under individual post performance.
It's a straightforward measure of whether your call-to-action is compelling enough to get people off the platform and onto your website or landing page.
Conversion rate from Facebook traffic
This tells you what percentage of people who clicked through from Facebook completed a desired action — signing up, downloading something, or making a purchase.
You'll need to track this through your website analytics (Google Analytics, for example) by filtering traffic sources to Facebook. Divide conversions by total Facebook clicks, and you've got your conversion rate. This metric helps you see if Facebook is sending quality traffic or just browsers.
Lead quality from Facebook
Not all leads are equally useful. Lead quality measures how many of your Facebook-sourced leads are moving through your sales funnel.
You can track this by tagging Facebook leads in your CRM and monitoring how many turn into qualified opportunities or customers.
If Facebook is driving volume but not quality, I’d say it might be time to rethink your targeting or messaging. Or even change the traffic source completely — one of my clients had to switch from Facebook to Reddit because, despite Facebook having tons of clicks, very few of them actually converted into a prospect.
Customer Lifetime Value (CLV)
This one can be a little tricky to calculate, especially if you’re not in retail, SaaS, or another quantifiable field. Customer lifetime value estimates the total revenue a customer will generate over their relationship with your brand.
To calculate it, multiply the average purchase value by purchase frequency and customer lifespan. Then compare CLV for customers acquired through Facebook versus other channels.
If Facebook customers have a higher CLV, it justifies more investment in the platform, even if upfront acquisition costs are higher.
Facebook paid advertising metrics
Paid conversions are usually easier to track than organic ones. As long as you're aware of competitive benchmarks, like how much a user is supposed to cost in your industry, you can measure the success of your social media campaign rather quickly.
However, remember that setting KPIs for paid campaigns depends heavily on your budget, creative quality, and most importantly, the competitive landscape. What works in one niche might flop in another.
Click-Through Rate (CTR)
CTR measures how many people clicked your ad after seeing it. It's calculated by dividing total clicks by total impressions, then multiplying by 100. You can find this metric in your Facebook Ads Manager.
A strong CTR means your ad creative and messaging are resonating. If your CTR is low, the problem is usually in the hook or the visual — people aren't compelled to click.
Cost Per Click (CPC)
CPC tells you how much you're paying each time someone clicks your ad. Facebook calculates this automatically in Ads Manager by dividing total ad spend by total clicks.
Lower CPC means you're getting more traffic for your budget. If CPC is climbing, it could mean your audience is saturated, or your ad relevance score is dropping, so it’s time to refresh your ad creatives.
Cost Per Mille (CPM)
CPM is the cost to show your ad to 1,000 people. It's calculated by dividing total spend by impressions, then multiplying by 1,000.
I usually use CPM for awareness campaigns where you care more about eyeballs than clicks. High CPM means competition for your audience is fierce, or your targeting is too narrow.
Cost Per Acquisition (CPA)
CPA measures how much you're spending to acquire one customer or lead. Divide total ad spend by the number of conversions. This metric can also be found in the Facebook Ads Manager report.
This is one of the most important metrics to evaluate how effective your social media marketing is because it directly ties spend to results. If CPA is higher than your profit margin, the campaign isn't working properly.
Return on Ad Spend (ROAS)
ROAS tells you how much revenue you're generating for every dollar spent on ads. It's calculated by dividing revenue from ads by total ad spend.
For example, a ROAS of 3:1 means you're making $3 for every $1 spent. This metric is critical for understanding the profitability of your whole endeavor. Even if CPA looks good, if ROAS is weak, your pricing or product margins might need tweaks.
Advanced Facebook metrics that will help you optimize your strategy
That’s a lot of numbers already, right?
But as I mentioned before, you don’t have to track all of your Facebook metrics at once. To choose the right metric for each case, it’s important to understand what we’re tracking and why.
Here are several additional Facebook metrics that are a little more specific. They won't always make it into your executive social media report, but they're incredibly useful if your goal is building a better Facebook strategy overall.
Facebook video metrics
Video is taking over all social media platforms, and Facebook is no exception.
Understanding video metrics is essential if you want to integrate video into your strategy effectively and know whether it's actually working for you.
Video engagement and average engagement per video
Video engagement measures how people interact with your video content — likes, comments, shares, and reactions. Average engagement per video gives you a baseline for how your video content performs compared to your other posts.
Engagement rate is important here, but I also recommend keeping an eye on shares. Shares mean people thought your video was worthy of putting on their own feed or sending to friends. That's a strong signal if you're looking for organic growth.
Want to dive deeper into video performance? Check out our guide on Facebook Reels Analytics for more detailed tracking.
Video views and average views per video
Video views tell you how many times your video was played. Facebook counts a view after just a few seconds of watch time. Views count will answer the question, “Is your hook good enough to capture attention?”
It's important to distinguish views from impressions. Facebook's "Views" metric counts the number of times a video was played. Impressions, on the other hand, count every time your content enters someone's feed, even if people scrolled past it. Views indicate actual attention, while impressions measure potential exposure.
Average views per video help you understand if the video format is consistently grabbing attention or if only certain videos are doing the job. If your average is low but a few videos spike, you've got some winners to study.
Top videos
Identifying your top-performing videos helps you double down on what works. Look at the hooks that grabbed attention, the formats that held it, and the topics that drove the most engagement or shares.
Not all of your content has to go viral, but if some videos are performing better than others, use them as a playbook for future content. Take into account things like hooks, topics, the length of the video, and captions. Anything can be the decisive factor, but hooks usually hit the hardest.
My tip — don’t be too worried about being repetitive. Facebook loves original videos, but if you see that a particular hook or topic works every time, lean into it and find new ways to apply it.
Facebook group metrics
If you manage a Facebook group, these metrics help you understand whether your community is growing and, more importantly, whether it's really active.
Group member growth
This Facebook metric tracks how quickly your group is gaining (or losing) members over time.
Steady growth means your group is attracting new people, but growth alone doesn't tell the full story. Pair it with activity levels and engagement rate to see if those members are engaging with your social media content.
Active members vs. Total members
Total members might look impressive, but active members are what actually matter.
Facebook defines active members as people who've engaged with the group in the past month — posting, commenting, or reacting. You can find this breakdown in your Group Insights.
If your active member percentage is low, it means people joined but aren't sticking around or participating. That's a signal to rethink your content or engagement tactics.
Competitive Facebook metrics
Competitor analysis is one of the most important ways to give context to your efforts. It helps you set realistic social media KPIs, understand the landscape, and identify gaps in your strategy.
Bear in mind that competitor analysis on Facebook is not a one-time thing. It has to be held consistently to ensure you’re still in the right context. Doing the research manually is quite a hefty process, but competitive analysis tools like Socialinsider do the heavy lifting for you.
Engagement and growth rate comparison
This metric helps you understand whether your growth and engagement are competitive. Is 100 new followers a month good or bad? You won't know unless you see how actively your competitors are growing.
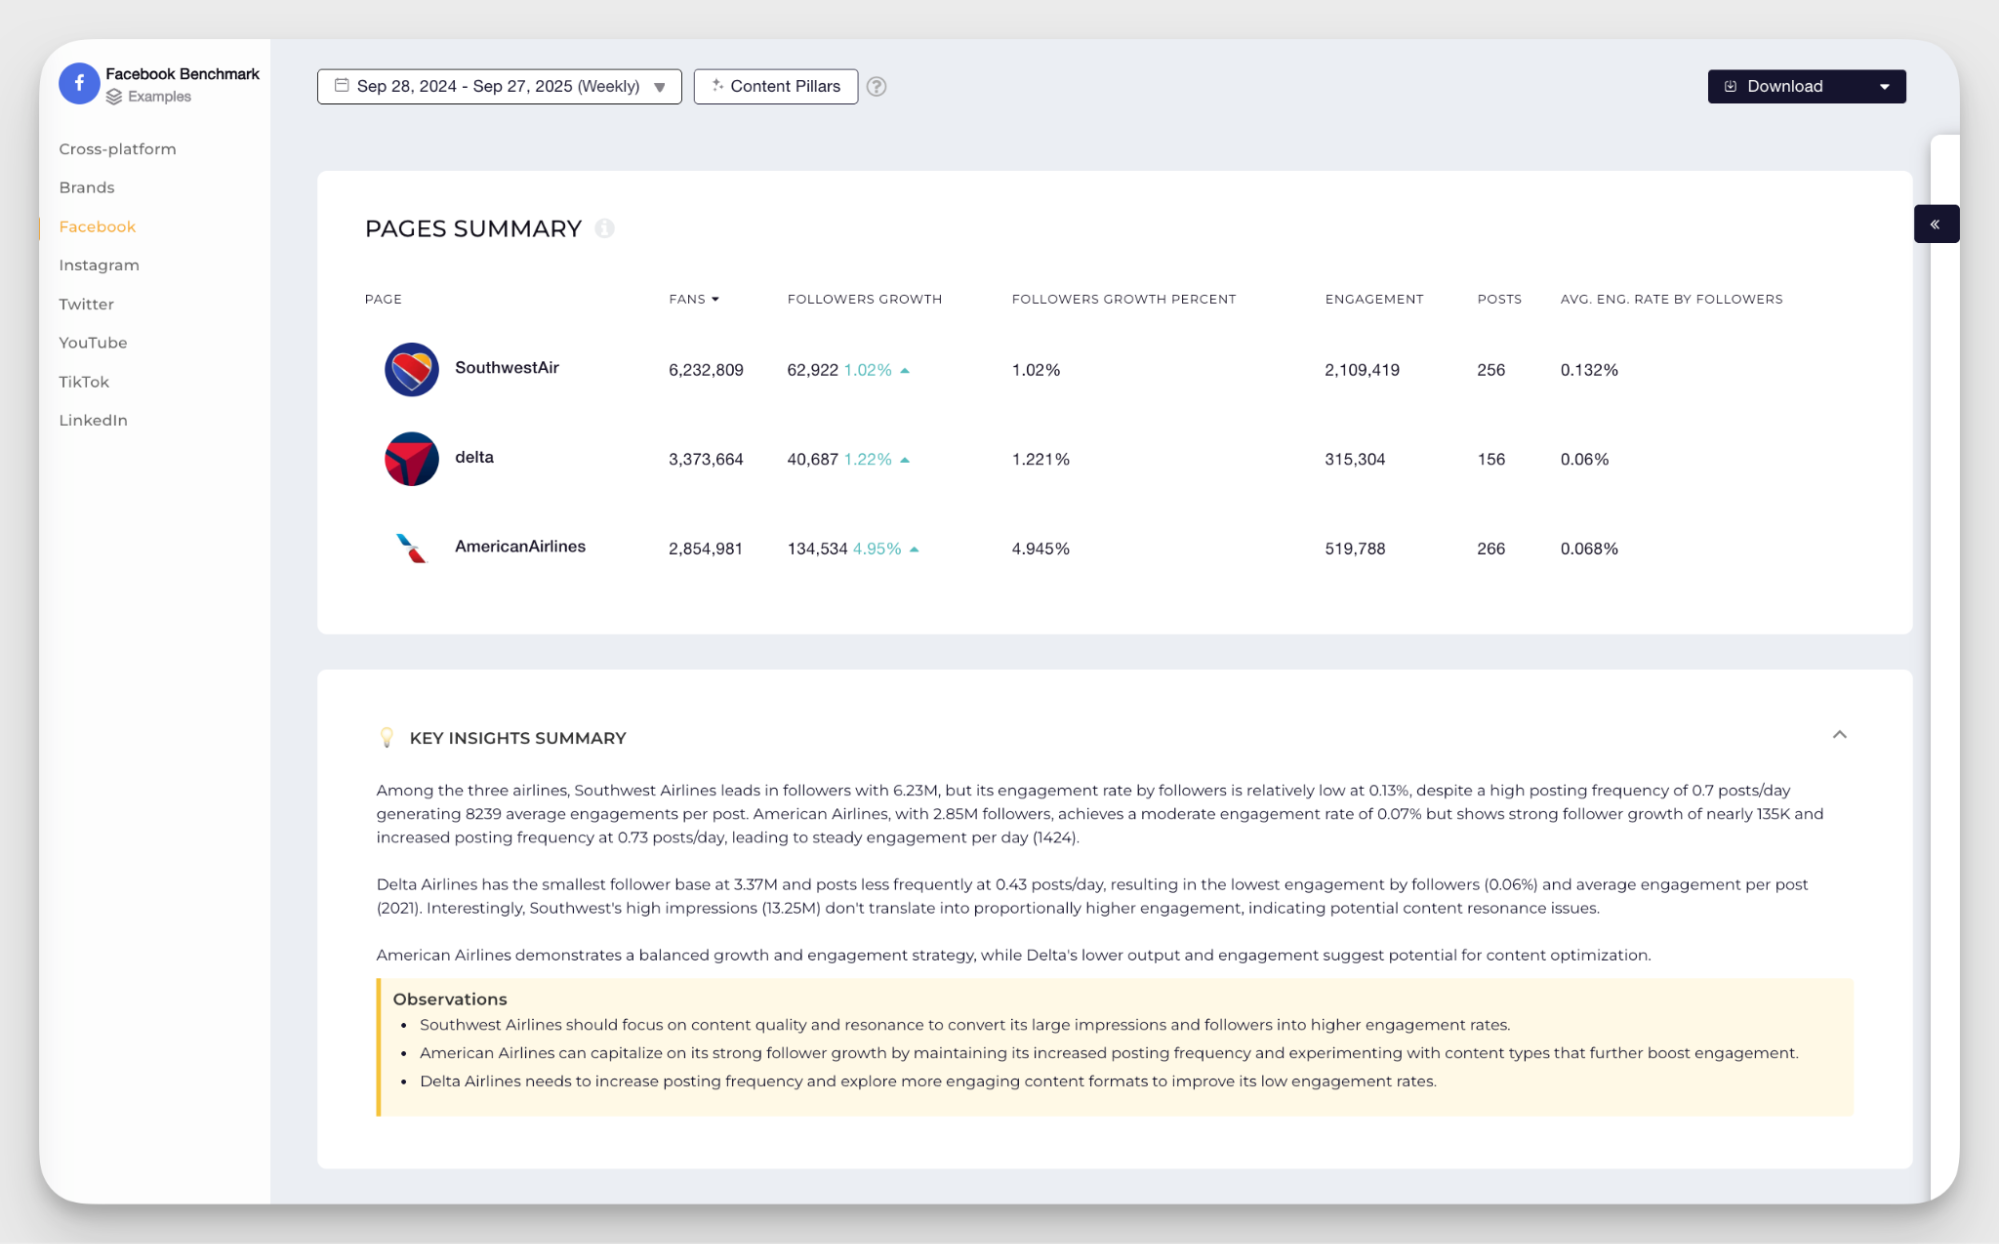
Industry benchmarks are helpful, but direct competitor research gives you more concrete data. In Socialinsider, you can add competitor profiles to your dashboard and compare engagement rates and follower growth side by side. This shows you where you stand and whether you need to push harder or if you're already ahead of the competitors.
Content gap analysis
Content gap analysis helps you fortify your strategy by showing where you're falling behind or where your competitors are dropping the ball.
Socialinsider lets you compare the top content pillars, posting frequency, and average engagement rate for each content pillar across competitors. You can quickly spot if they're dominating a specific content pillar while you're barely using it.
When there's a gap, there's opportunity. This analysis becomes a source of inspiration and a strategic advantage. I like to cross-compare this data with the most used formats to see what type of content is most popular among our quite similar audience.
Competitor campaign analysis
Understanding how competitors handle campaigns gives you a clearer picture of what's working in your space.
You can analyze their posting cadence, messaging, and the reactions they're getting in the comments. It can either help you draw inspiration or dodge a bullet.
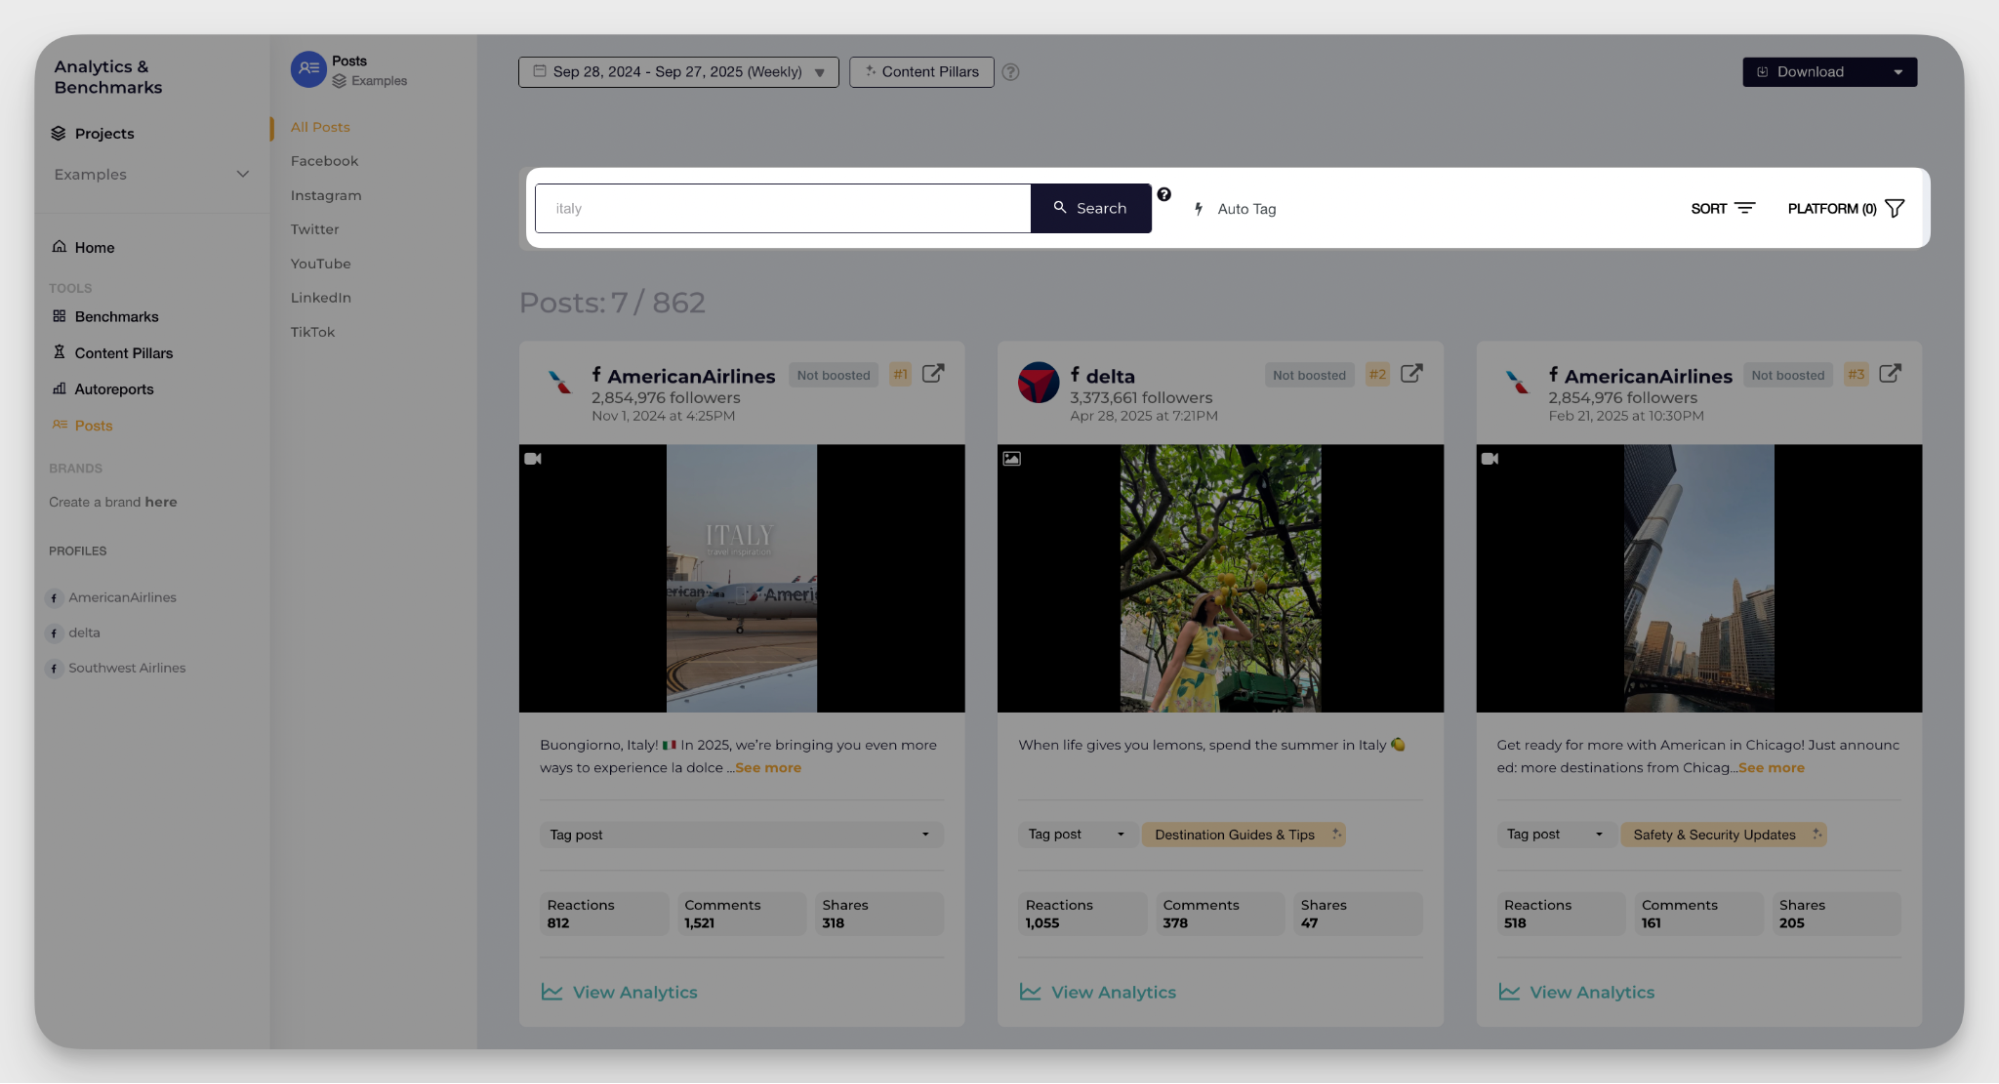
In Socialinsider, you can use auto-tagging to label competitor posts by campaign or content type. This makes it easy to track their campaign frequency, see which tactics are landing, and spot patterns in timing or creative approach.
Organic value analysis
Calculating the organic social media value is a pain in the brain. When there’s no UTM and ad budget, it’s quite hard to tie conversions to a particular post or calculate how much it eventually costs you.
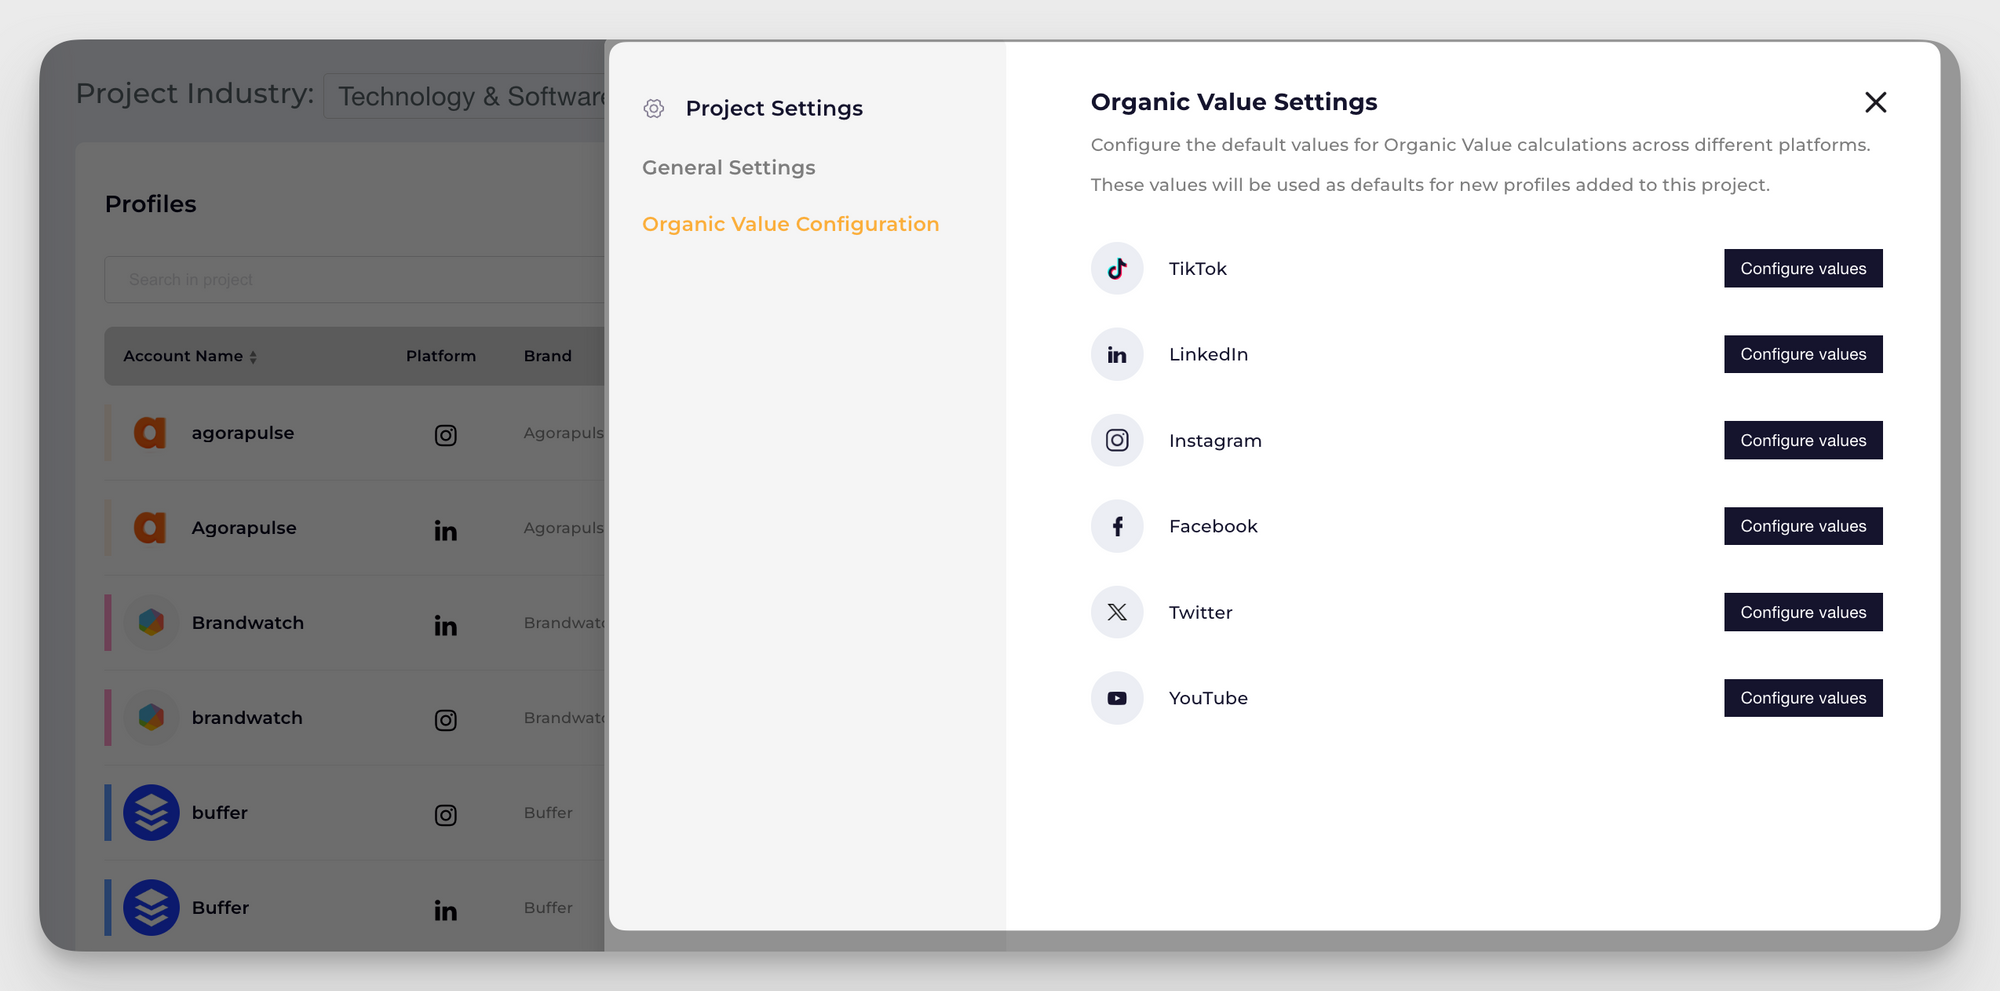
But Socialinsider has a feature that helps you estimate the organic value of your social media profiles, including Facebook. It estimates how much you would have spent on ads to achieve the same reach and engagement you're getting organically.
The default values are estimates based on industry standards, but you can always customize them to fit your particular case better.
This metric is incredibly useful when you need to justify social media investment to stakeholders who think only paid ads drive results. It puts a dollar figure on your organic work and shows the ROI of building an engaged audience over time.
This metric also helps you in your social media optimization efforts. If the organic value seems lower than expected, it might also be a signal to revamp your Facebook content strategy or invest more time into audience building.
How to turn the metrics into business insights?
We don’t track metrics for the sake of metrics — we do that to know what’s next. Here are my top five tips on how to translate your numbers into actions:
- Start with goals, not dashboards. Establish what your current goals are. Are you building awareness, driving traffic, or converting leads? Your goal determines which metrics matter.
- Look for patterns, not one-time wins. A single viral post is exciting, but it's not a strategy. Analyze trends over weeks or months to see what consistently works.
- Compare context, not numbers. A 5% engagement rate means little without context. Compare it to your past performance, your competitors, and industry benchmarks.
- Tie metrics to money. Executives care about ROI. Connect your metrics to revenue whenever possible. If you can draw a line from a metric to a dollar, you've made your case.
- Act on insights quickly. Data is only useful if you do something with it. If a content format isn't working, stop pushing it. If a competitor is ahead of you in video, test it yourself. The faster you act on what the metrics are telling you, the faster you improve.
Final thoughts
Facebook metrics can feel endless, but you don't need to track everything to build a strong strategy. What you need is clarity — understanding what each metric measures, why it matters, and which ones align with your specific goals.
Choose the right metrics for the moment, track them consistently, and use the insights to make better decisions.
Kseniia Volodina
Content marketer with a background in journalism; digital nomad, and tech geek. In love with blogs, storytelling, strategies, and old-school Instagram. If it can be written, I probably wrote it.
Analyze your competitors in seconds
Track & analyze your competitors and get top social media metrics and more!
You might also like


Improve your social media strategy with Socialinsider!
Use in-depth data to measure your social accounts’ performance, analyze competitors, and gain insights to improve your strategy.