Top 11 Twitter Metrics to Track in 2025
Explore key Twitter metrics that drive success. Understand your audience's behavior and refine your strategy to maximize your performance.


Being one of the oldest social media platforms, in an attempt to keep up with the latest social media trends, Twitter faced a long series of changes over the years. Especially lately, since its rebranding into X.
These constant changes, which are often translated into the adoption of new features, have led to an extended list of Twitter analytics data that marketers need to keep an eye on to understand their brand's performance on Twitter and identify improvement insights for their social media strategy.
This raises the question of what Twitter metrics are nowadays most important to track for a long-term Twitter marketing performance boost, which we'll dig into right away. Let's dive in!
Key takeaways
-
Performance metrics – Tracking followers’ growth, engagement, impressions, and video views helps you measure reach, interaction, and overall audience interest in your Twitter presence.
-
Content metrics – Monitoring top tweets, best performing content pillars, and the most engaging formats shows you what themes and formats resonate most with your audience.
-
Business & advertising metrics – Keeping an eye on Organic Value, CPR, and CPM helps you connect social activity to real business impact and optimize paid campaigns.
What are Twitter metrics, and why are they important?
Twitter metrics represent a series of KPIs that measure how your Twitter page is performing, allowing you to evaluate your strategy and discover if your current content plan is effective in achieving the goals you've set for your Twitter marketing efforts.
Twitter performance metrics are important because they offer you social media insights into how to optimize your content to get better result.
By overseeing your metrics on Twitter, you can gain a deeper understanding of the type of content that resonates with your audience, both in terms of messaging and formats, discover when is the best time to post, what hashtags are more effective, and so on.
Now that we've explained why your social media analytics on Twitter should be kept under observation, let's proceed to the data that is most important to track.
What Twitter metrics should you track?
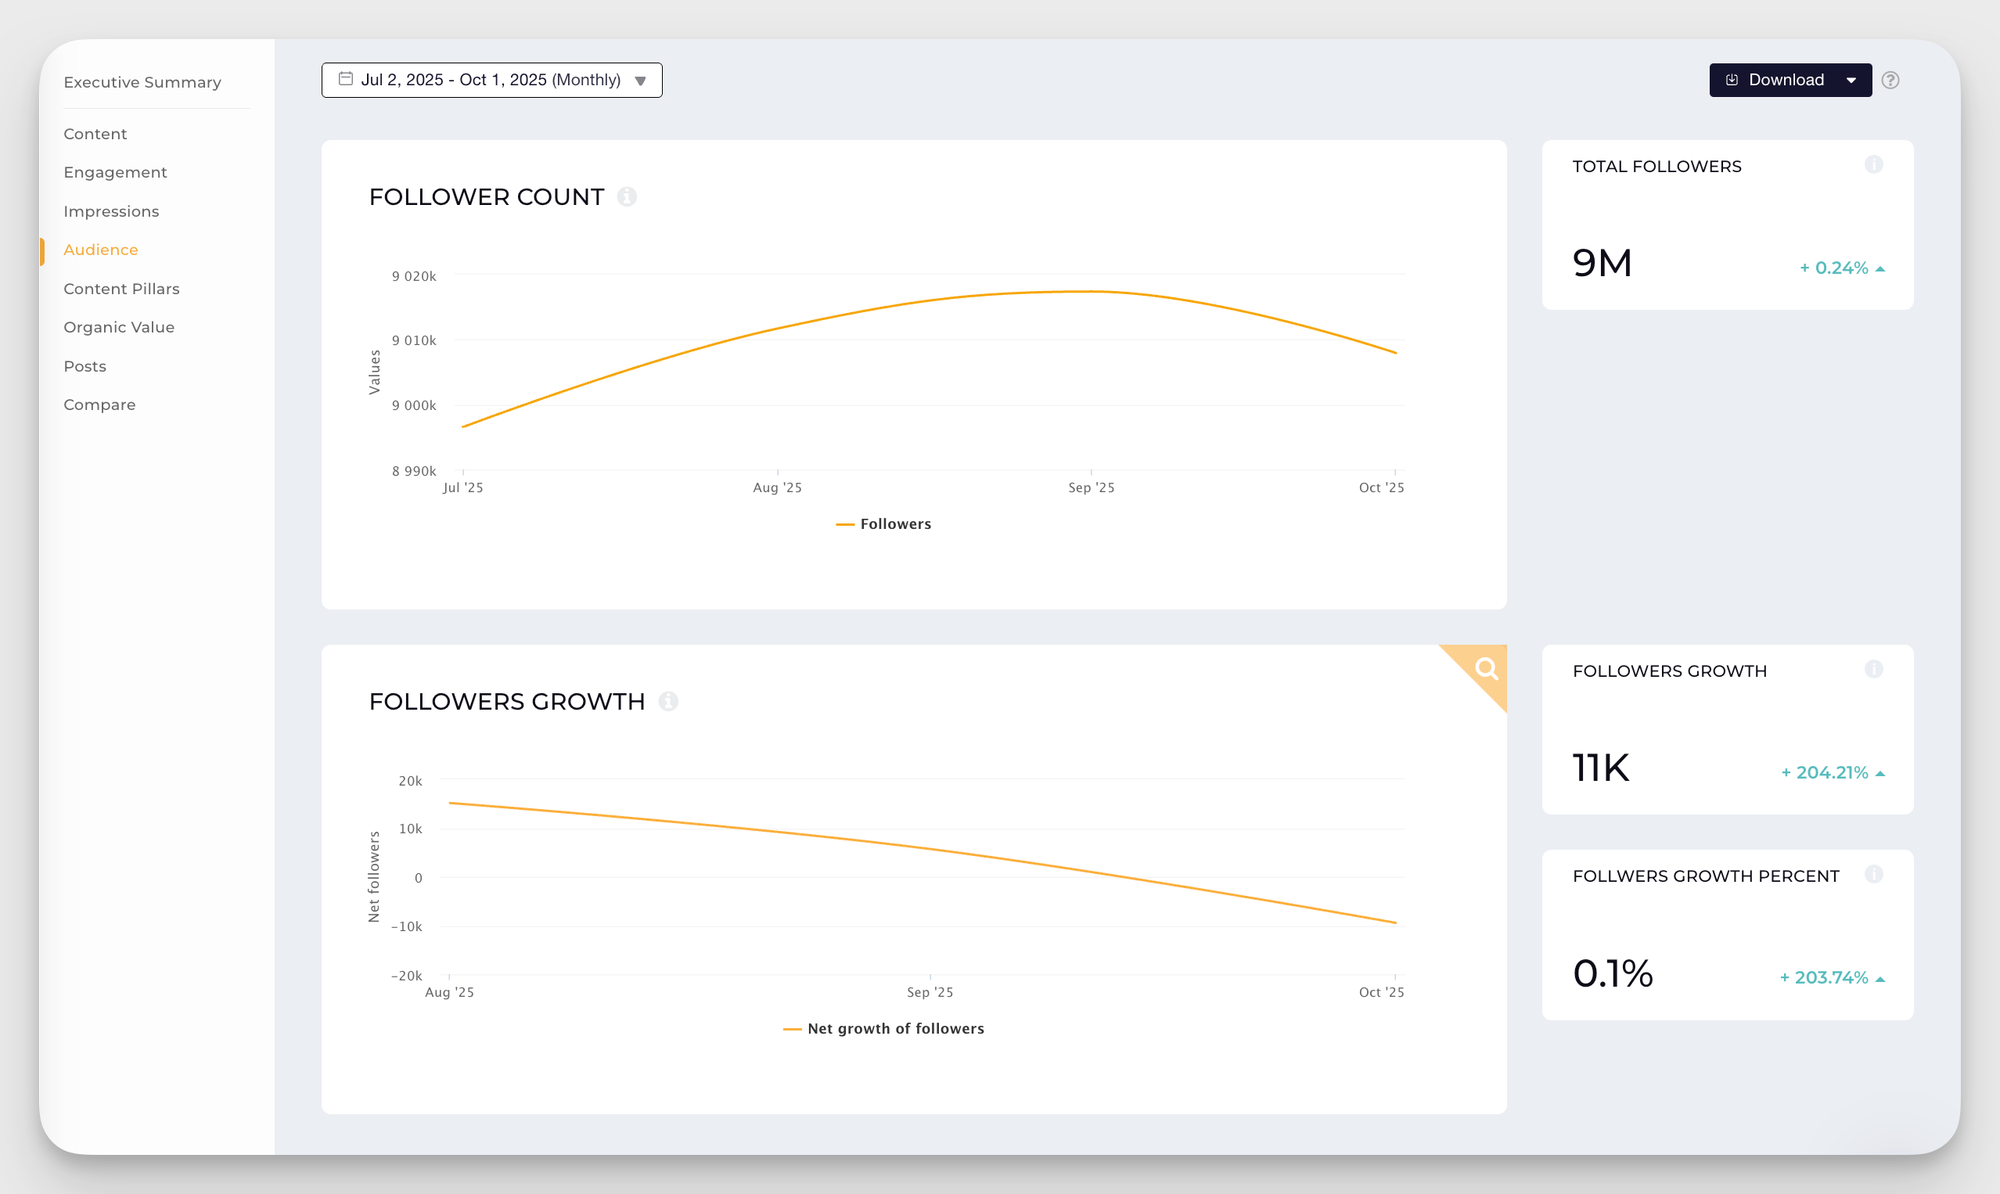
#1. Followers and followers’ growth
The followers’ growth metric is the number of followers that has changed over a period of time.
Similarly to your new followers, this metric should be tracked consistently when you're leveraging strategies focused on increasing your brand awareness.
If the number is positive, it means you’re on a good path and your audience is interested in your Twitter content.
On the contrary, if the number decreases, you should look into what content strategies drove that drop to avoid them in the future.
This type of Twitter analytics data is available via a third-party platform, such as Socialinsider, that enables performance insights from multiple angles.
#2. Twitter engagement and engagement rate
According to Twitter, engagement measures the total number of interactions a user has with a tweet.
This encompasses several ways someone could interact with a tweet, including clicking anywhere on the tweet, retweets, replies, follows, likes, links, tweet expansion, and more.
The engagement rate KPIs is one of the most popular social media metrics out there because it’s a good indicator of how likable your brand is. It’s often used to analyze goals related to brand loyalty.
Although it’s a versatile metric that includes several other metrics under its umbrella, the engagement rate is an even more powerful Twitter metric than the purely raw engagement number.
It is directly correlated with other important metrics (such as impressions or number of followers), depending on what you’re trying to measure.
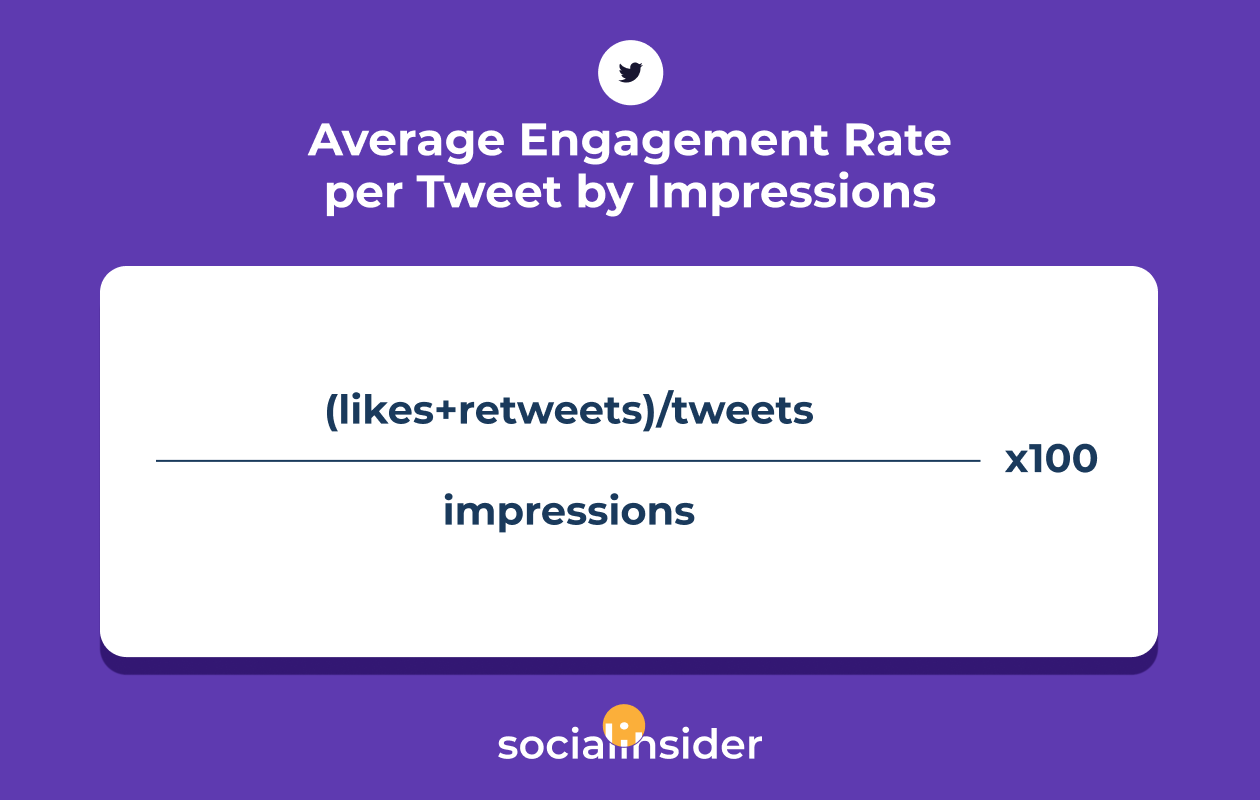
Twitter calculates the engagement rate per tweet by impressions: the number of engagements divided by tweets, all divided by impressions.
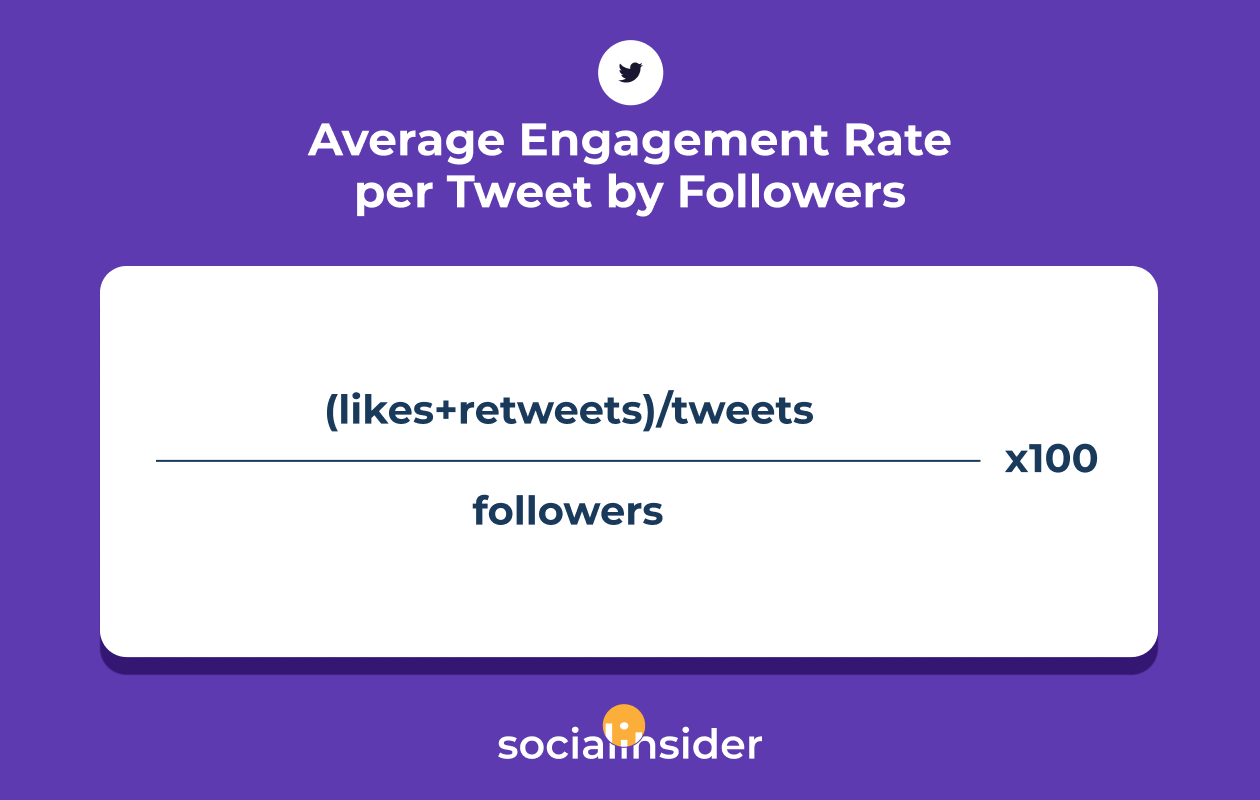
But you can also calculate the average engagement rate per tweet by followers on Twitter, depending on your social media goals. Here’s the formula:
#3. Retweets and replies
Although we kind of talked about these two Twitter metrics, as they are part of engagement as well, retweets and replies are some KPIs that can be analyzed as standalone data as well.
Retweets and replies represent Twitter metrics that highlight how valuable your Twitter audience finds your content.
When your Twitter followers invest their time into taking meaningful actions that foster a relationship with your brand, that's a great indicator that they appreciate your content and perceive your brand as being helpful, entertaining, or inspiring.
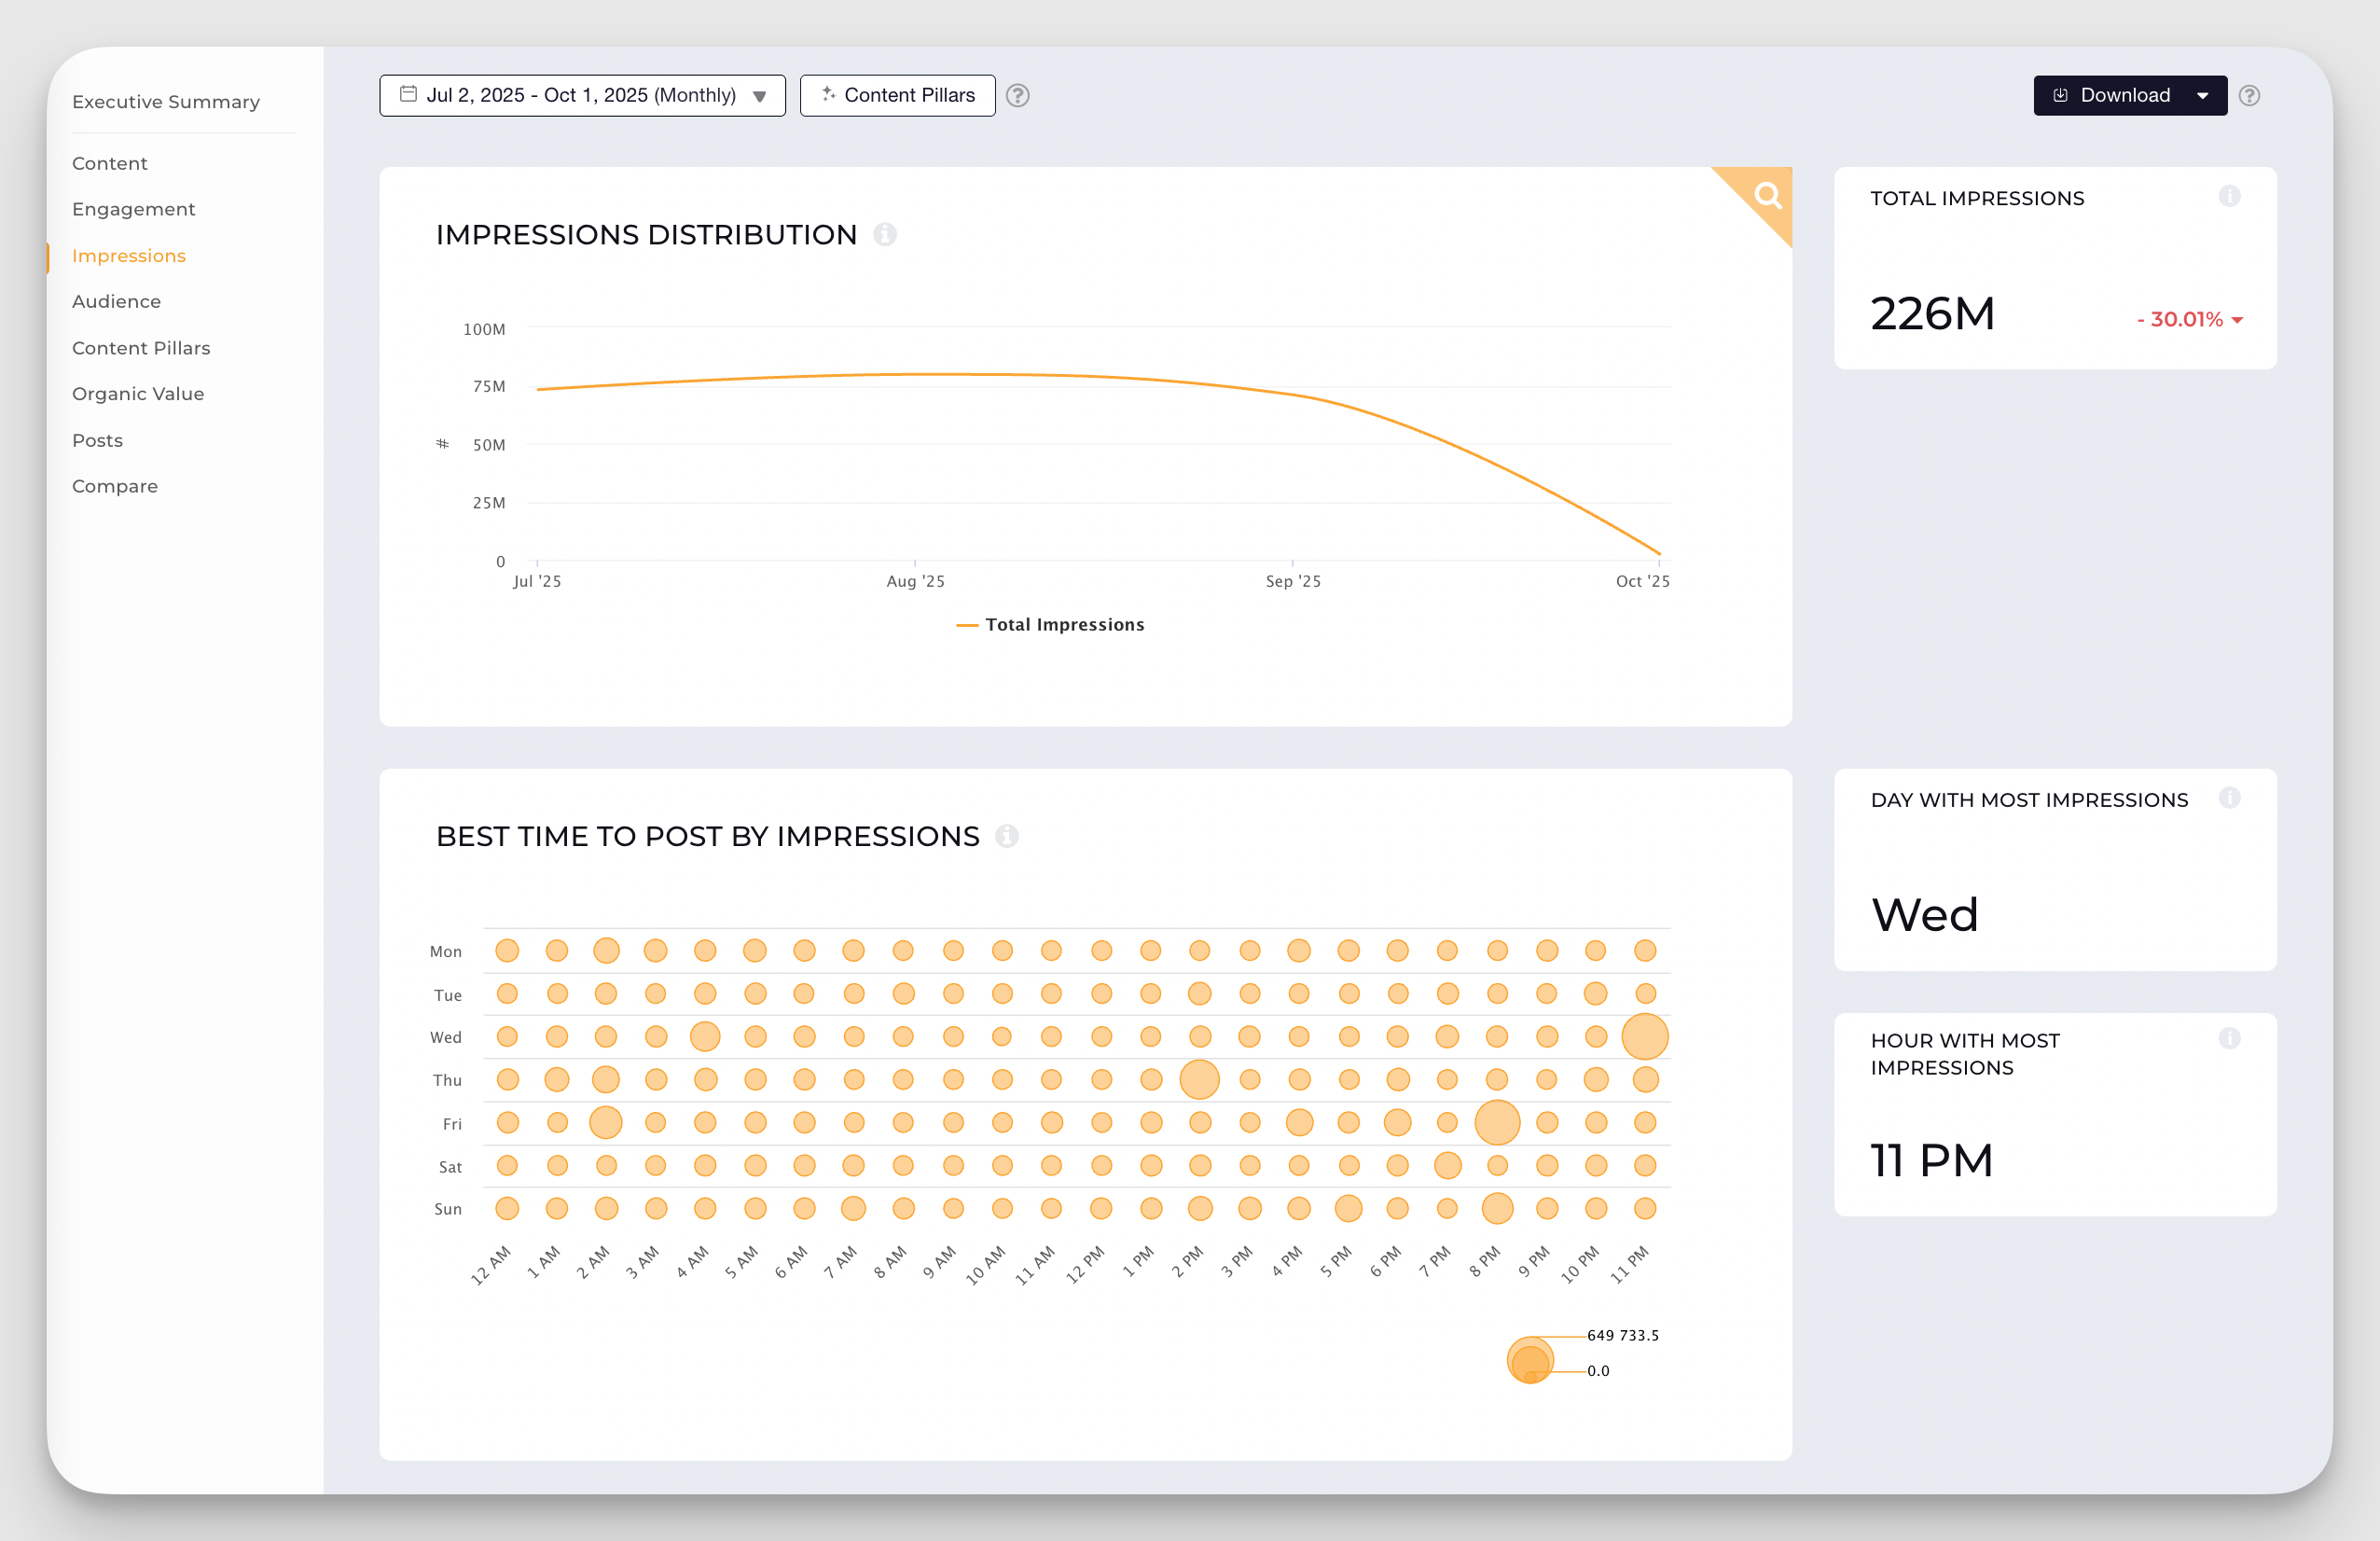
#4. Impressions
The Twitter impressions metric indicates how many times your posts were seen by the platform's users, including multiple views from the same person.
This type of Twitter analytics data offers insights into the type of content that the platform's algorithm considers to be of most interest to your Twitter audience, therefore displaying it multiple times in the users' feeds.
Seeing your content repeatedly will help your brand to become top of mind when your followers on Twitter are in need of the kind of products or services your business is providing.
If this particular metric is of interest to you, then we have some good news. Within Socialinsider, you have access to an extended list of KPIs related to impressions, such best time to post by impressions or impressions evolution.
#5. Video views
We all know that videos speak louder than words. Well, it is actually “a picture is worth a thousand words”, but you get the point.
With the growing popularity of videos on TikTok, YouTube Shorts, and Instagram Reels, Twitter needs to step in, and marketers started using this type of content more.
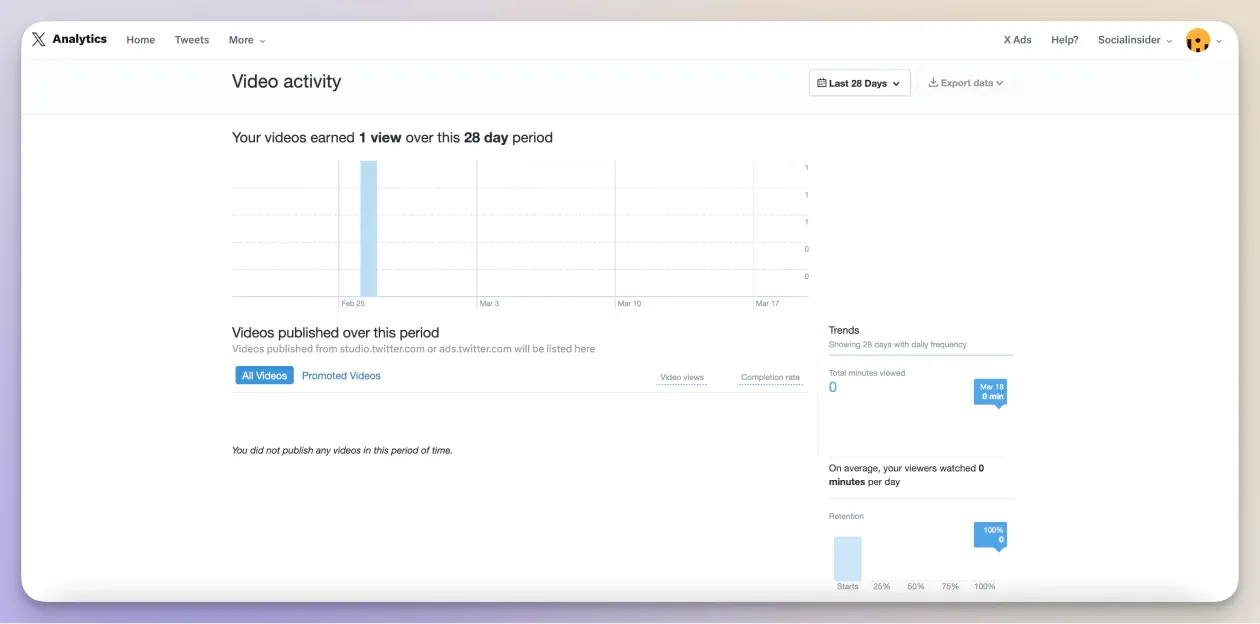
Video views measure how many people have seen your native video content when uploaded to Twitter. This Twitter metric is available within the platform's native analytics feature.
The video view metric on Twitter can tell you a lot about how your followers perceive your videos. A video view counts when at least 50% of the video is displayed on a user’s screen and played for a minimum of 2 seconds.
Some social media specialists claim that this metric is not always relevant since it does not guarantee that the Twitter user has seen your entire video and received the whole message you wanted to forward.
That is why Twitter also offers other Twitter video metrics like views to 25%, 50%, 75% and 100% of the video length.
Here is when we start talking about video retention rate.
#6. Top tweets
One of the most important questions you should ask yourself when diving into your Twitter analytics metrics should be, “What are my top tweets?”
The top tweets are your best-performing tweets (in terms of engagement or impressions) over a selected period.
Knowing what your top tweets are is a great starting point for your Twitter audit process because it can give you a sense of what your audience wants to see and engage with.
If you analyze your top tweets for an extended time - at least a couple of months - you’ll be able to observe social media trends and patterns among your audience that you can use to maximize your content strategy.
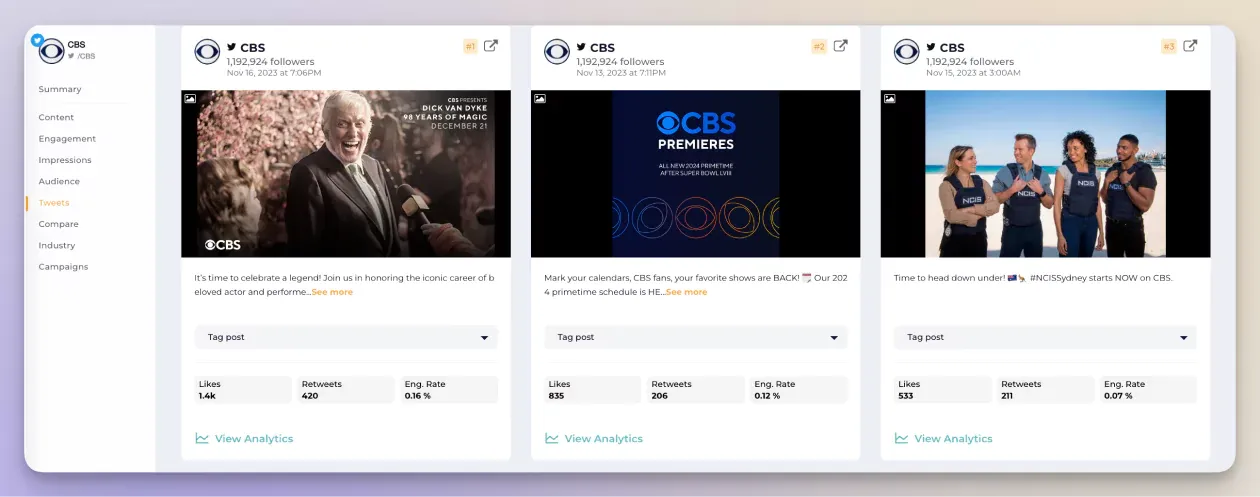
Using Socialinsider's Twitter analytics tool, your top tweets by engagement can be found in the Content section. A great advantage of leveraging a third-party app to look at your Twitter metrics is that it enables the posts analysis over a larger timeframe than the native platform.
#7. Best performing content pillars
To truly understand what drives engagement and growth on Twitter, you need to go beyond surface metrics and identify which content pillars (i.e. thematic categories or topics) resonate most with your audience. Tracking performance by pillar enables you to:
- Double down on what works (and reduce what doesn’t),
- Ensure content diversity while staying aligned with strategy,
- Detect shifts in audience preferences over time.
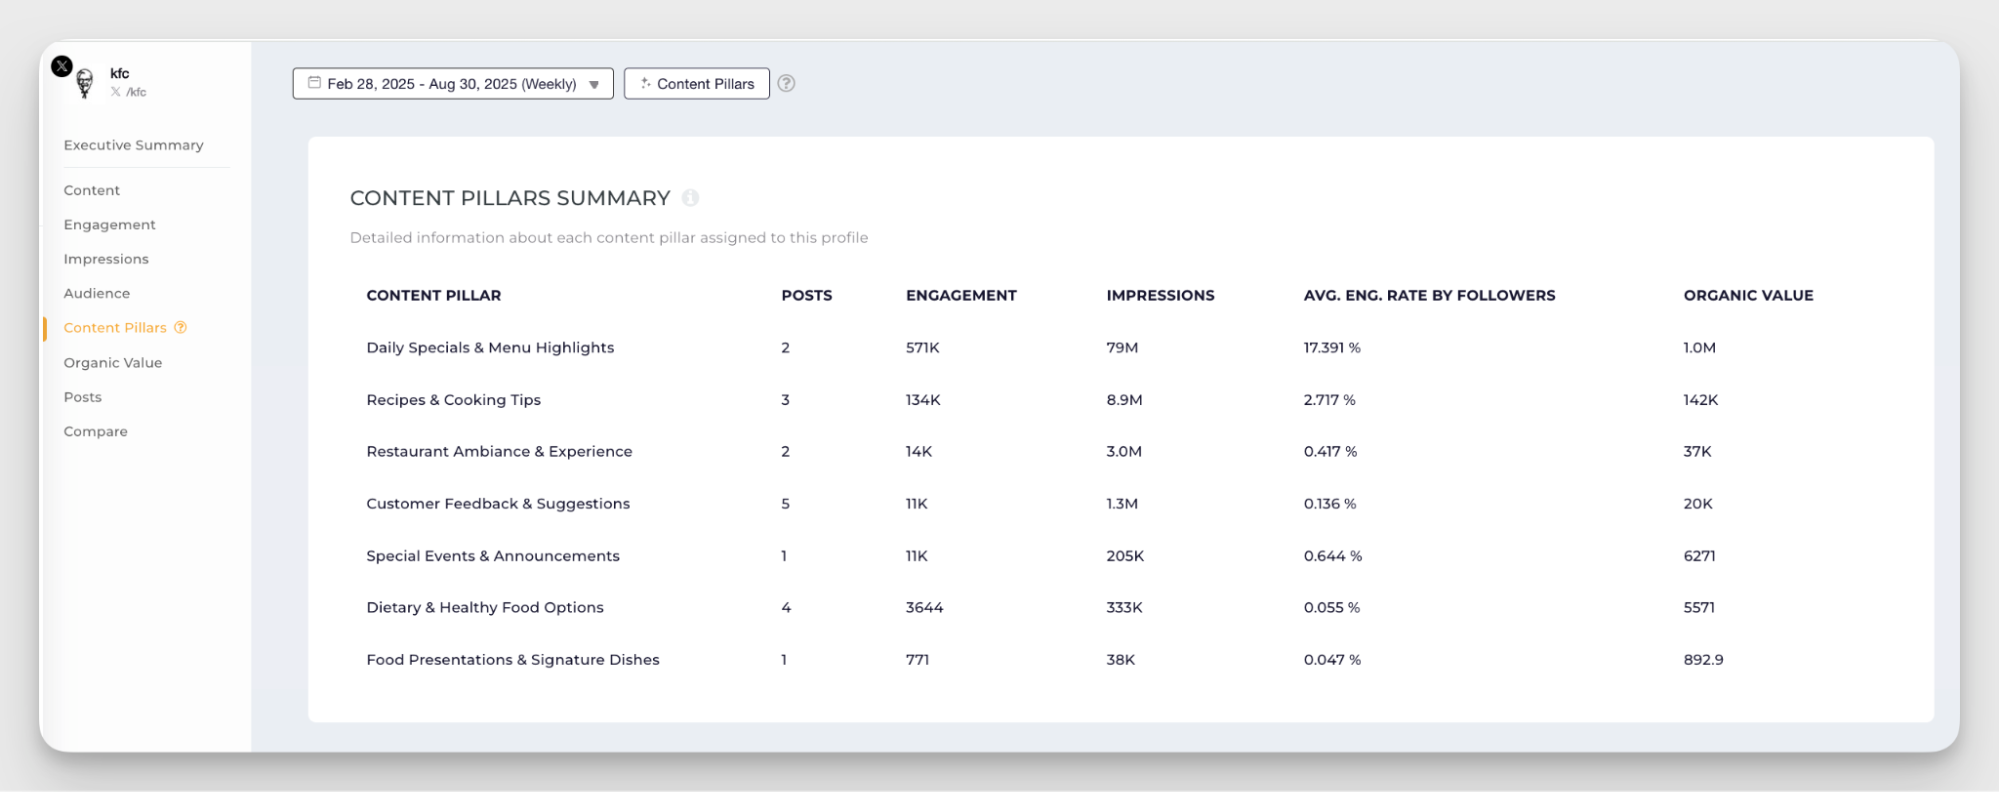
With Socialinsider, you can either use its AI-based content pillar segmentation by industry or you can create your own content pillars for specific campaigns, such as environmental talk, technological trends, and so on, depending on your company's specific communication approach.
#8. Most engaging formats
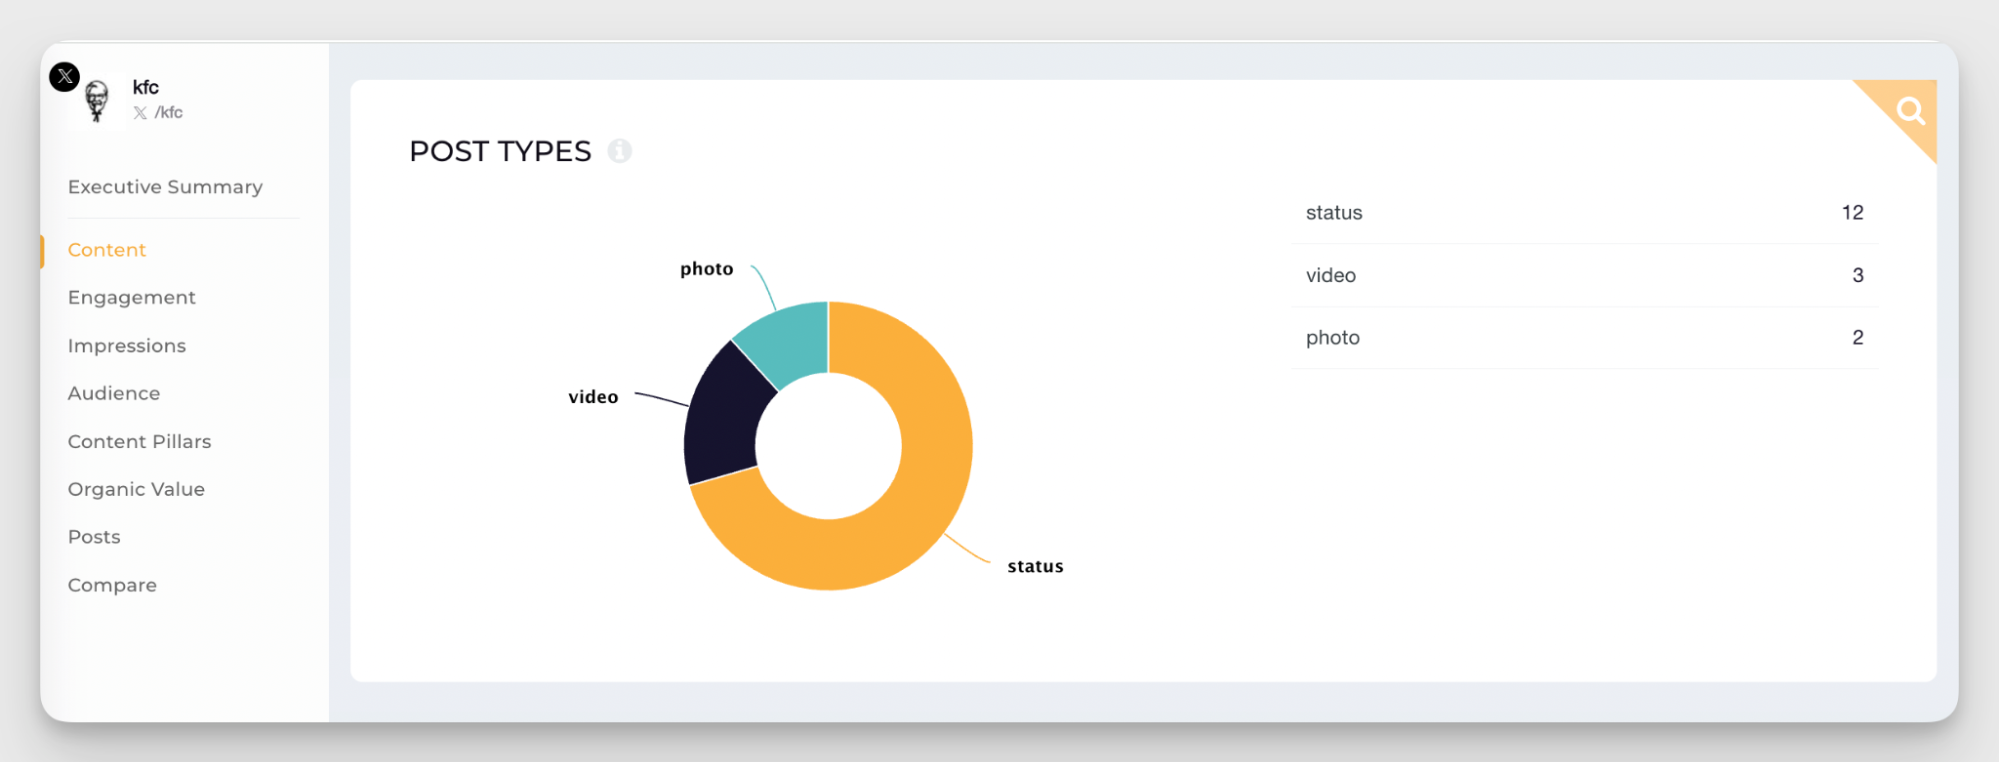
Even within the same content pillar, the way you present your message can make a huge difference in reach and interaction. To maximize impact, you’ll want to track engagement by format and lean into what works best for your audience.
Here are common formats you should test and measure:
- Text-only / plain tweets
- Quote tweets / replies / threads
- Image tweets / single image
- Carousel / multi-image tweets
- Native video tweets
- Polls / surveys / questions
- GIF / animation / memes / stickers
- Link / article tweets (with or without media)
What metrics to use for comparison
- Engagement rate per impression (or per follower)
- Absolute engagement volume (total likes, replies, retweets)
- Click-through / link clicks (for link-containing tweets)
- Video-specific metrics (views, completion, retention)
- Reply ratio / conversation rate (for formats meant to drive replies)
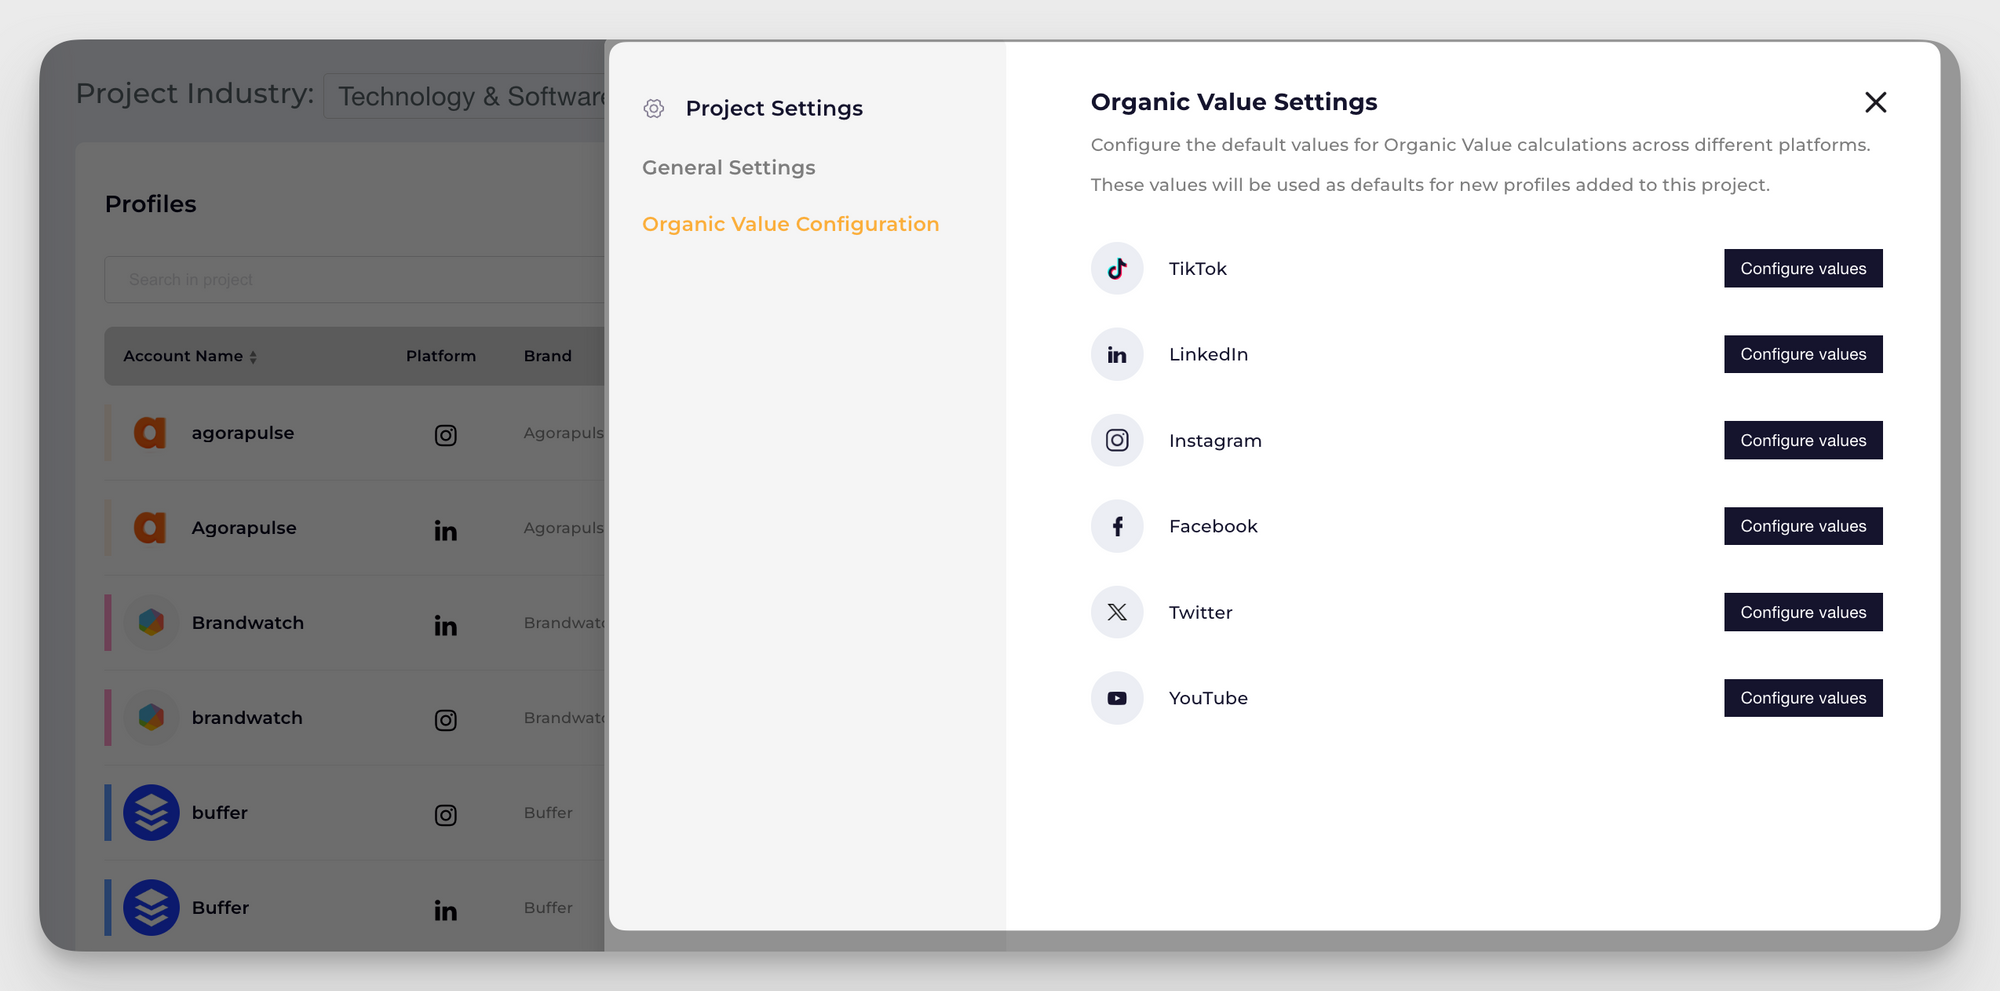
#9. Organic value
Organic Value is a metric designed by Socialinsider to quantify the business impact or “worth” of your organic (non-paid) Twitter activity. Rather than only counting interactions, Organic Value helps you estimate what those interactions are worth — for instance, in terms of exposure, potential impressions, or equivalent ad value. It converts engagement into a more monetary or value-based lens.
Why should you leverage it?
Many marketers ask: “All these likes and retweets are nice—but what’s it worth?” And well, organic Value gives an answer by estimating the value of your organic footprint.
And here's a tip Kassandra Quinn, Social Media Strategist at ModSquad had for me the last time we talked.
My number one tip is to focus on context, not just numbers. Metrics on their own can look impressive or concerning, but they don’t mean much until you explain why they happened and what to do next.
#10. Cost Per Results (CPR)
If, until now, we've only talked about metrics related to organic content, it's time to take a look at a metric that can give you insights into Twitter advertising.
The best Twitter metric to measure your campaign success when setting up a Twitter advertising campaign is called Cost Per Results, also known as CPR.
CPR is an overview metric that it's a bit more telling than engagements or impressions.
The Cost Per Results is calculated as the average cost of each relevant action that a user takes on one of your Twitter ads.
By running Twitter ads, you can reach your marketing and business goals quicker, and with the help of the CPR metric, you'll know which campaign is cost-effective.
If you discover that the CPR is higher than it should be in your Twitter ad campaign, then you'll probably need to make some adjustments.
#11. Cost Per Mille (CPM)
Cost-per-mille or cost per a thousand impressions, known also as CPM, helps you identify the amount of money you need to pay for 1,000 impressions.
This useful Twitter metric offers you insights about how much your ad campaign costs and what are the results of your paid efforts.
A marketing strategy that includes social media ads can really boost your brand’s potential.
And when the ad content is good, the followers will…well, follow. Make sure that when they see your ad, they will not go past it. If there is something that appeals to them, Twitter users will become curious.
Final thoughts
There you have it! A comprehensive list of Twitter metrics that can help you evaluate your Twitter performance.
Still, there is always more to include, especially if you’re a heavy user of Twitter advertising.
You should know by now that using Twitter as part of your social media strategy offers many business benefits.
FAQs about Twitter metrics data
#3. How is Twitter's engagement measured?
For its engagement formula, Twitter takes into consideration all clicks anywhere on the post (including links, avatar, username, post expansion and hashtags), altogether with any repost, replies, follows and likes.
Important to note is that some interactions weigh more than others, as follows:
- each like gets a 30x boost;
- each retweet gets a 20x boost;
- each reply gets a 1x boost.
Elena Cucu
Content & SEO Manager @ Socialinsider with 8 years of experience in marketing. I like to describe myself as a social butterfly with a curious mind, passionate about dancing and psychology.

Analyze your competitors in seconds
Track & analyze your competitors and get top social media metrics and more!
You might also like


![[What Data Says] Zero-Click Content for Social Media](https://blog-cms.socialinsider.io/content/images/2025/10/zero-click-content-cover.png)

Improve your social media strategy with Socialinsider!
Use in-depth data to measure your social accounts’ performance, analyze competitors, and gain insights to improve your strategy.