How to Calculate the Engagement Rate for All Social Media Platforms
Learn how to measure your engagement rate for each social media platform and see how you compare to your competitors


In many organizations today, social media has rapidly shifted from a “nice-to-have” to an essential business channel. And when that happens, the pressure lands quickly on the people responsible for showing what’s working, what’s not, and where resources should go next.
If you’re stepping into a role where social has suddenly become an important channel—or where leadership is now asking for real accountability—the first metric that helps you demonstrate clarity, control, and credibility is the engagement rate.
Think of engagement rate as the currency of social performance.
It’s what reveals whether your content resonates, whether your audience is paying attention, and whether your strategy is aligned with actual behavior, not just assumptions or vanity metrics.
In this article, you’ll learn:
- What engagement rate really measures
- Why it’s the fastest way to show value when social becomes a priority
- How to calculate it correctly across every major platform
- And how to use it to build trust with leadership, clients, or teams in your first weeks on the job
What is an engagement rate?
Engagement rate measures how actively people interact with the content you publish (likes, comments, shares, saves, clicks, replies, and more depending on the platform).
When social suddenly becomes an important channel inside a business, engagement rate becomes the quickest way to understand whether your content is resonating or falling flat. It gives you an honest read on audience behavior, which is essential when you need to make smart decisions quickly.
Why is it important to calculate your engagement rate on social media?
Marketers look at follower growth, reach, and impressions, but engagement rate is the metric that leaders pay closest attention to when they start taking social seriously.
Why?
Because engagement shows interaction, not just visibility.
When you’re in a role where leadership is asking for clarity or accountability, engagement rate:
- reveals which content actually works
- proves audience interest
- gives you a defensible, data-based argument for your recommendations
- helps you show immediate value in your reporting
Implementing social media best practices (such as consistent posting, high-quality visuals, and real community management) strengthens engagement and demonstrates progress quickly (you will see a boost in social media interactions).
For example, the education industry enjoys surprising amounts of engagement because organizations follow best practices, and this is easy to spot because the audience seems to really resonate with the content shared by educational institutions. We talk about this at length in our article about social media in education.
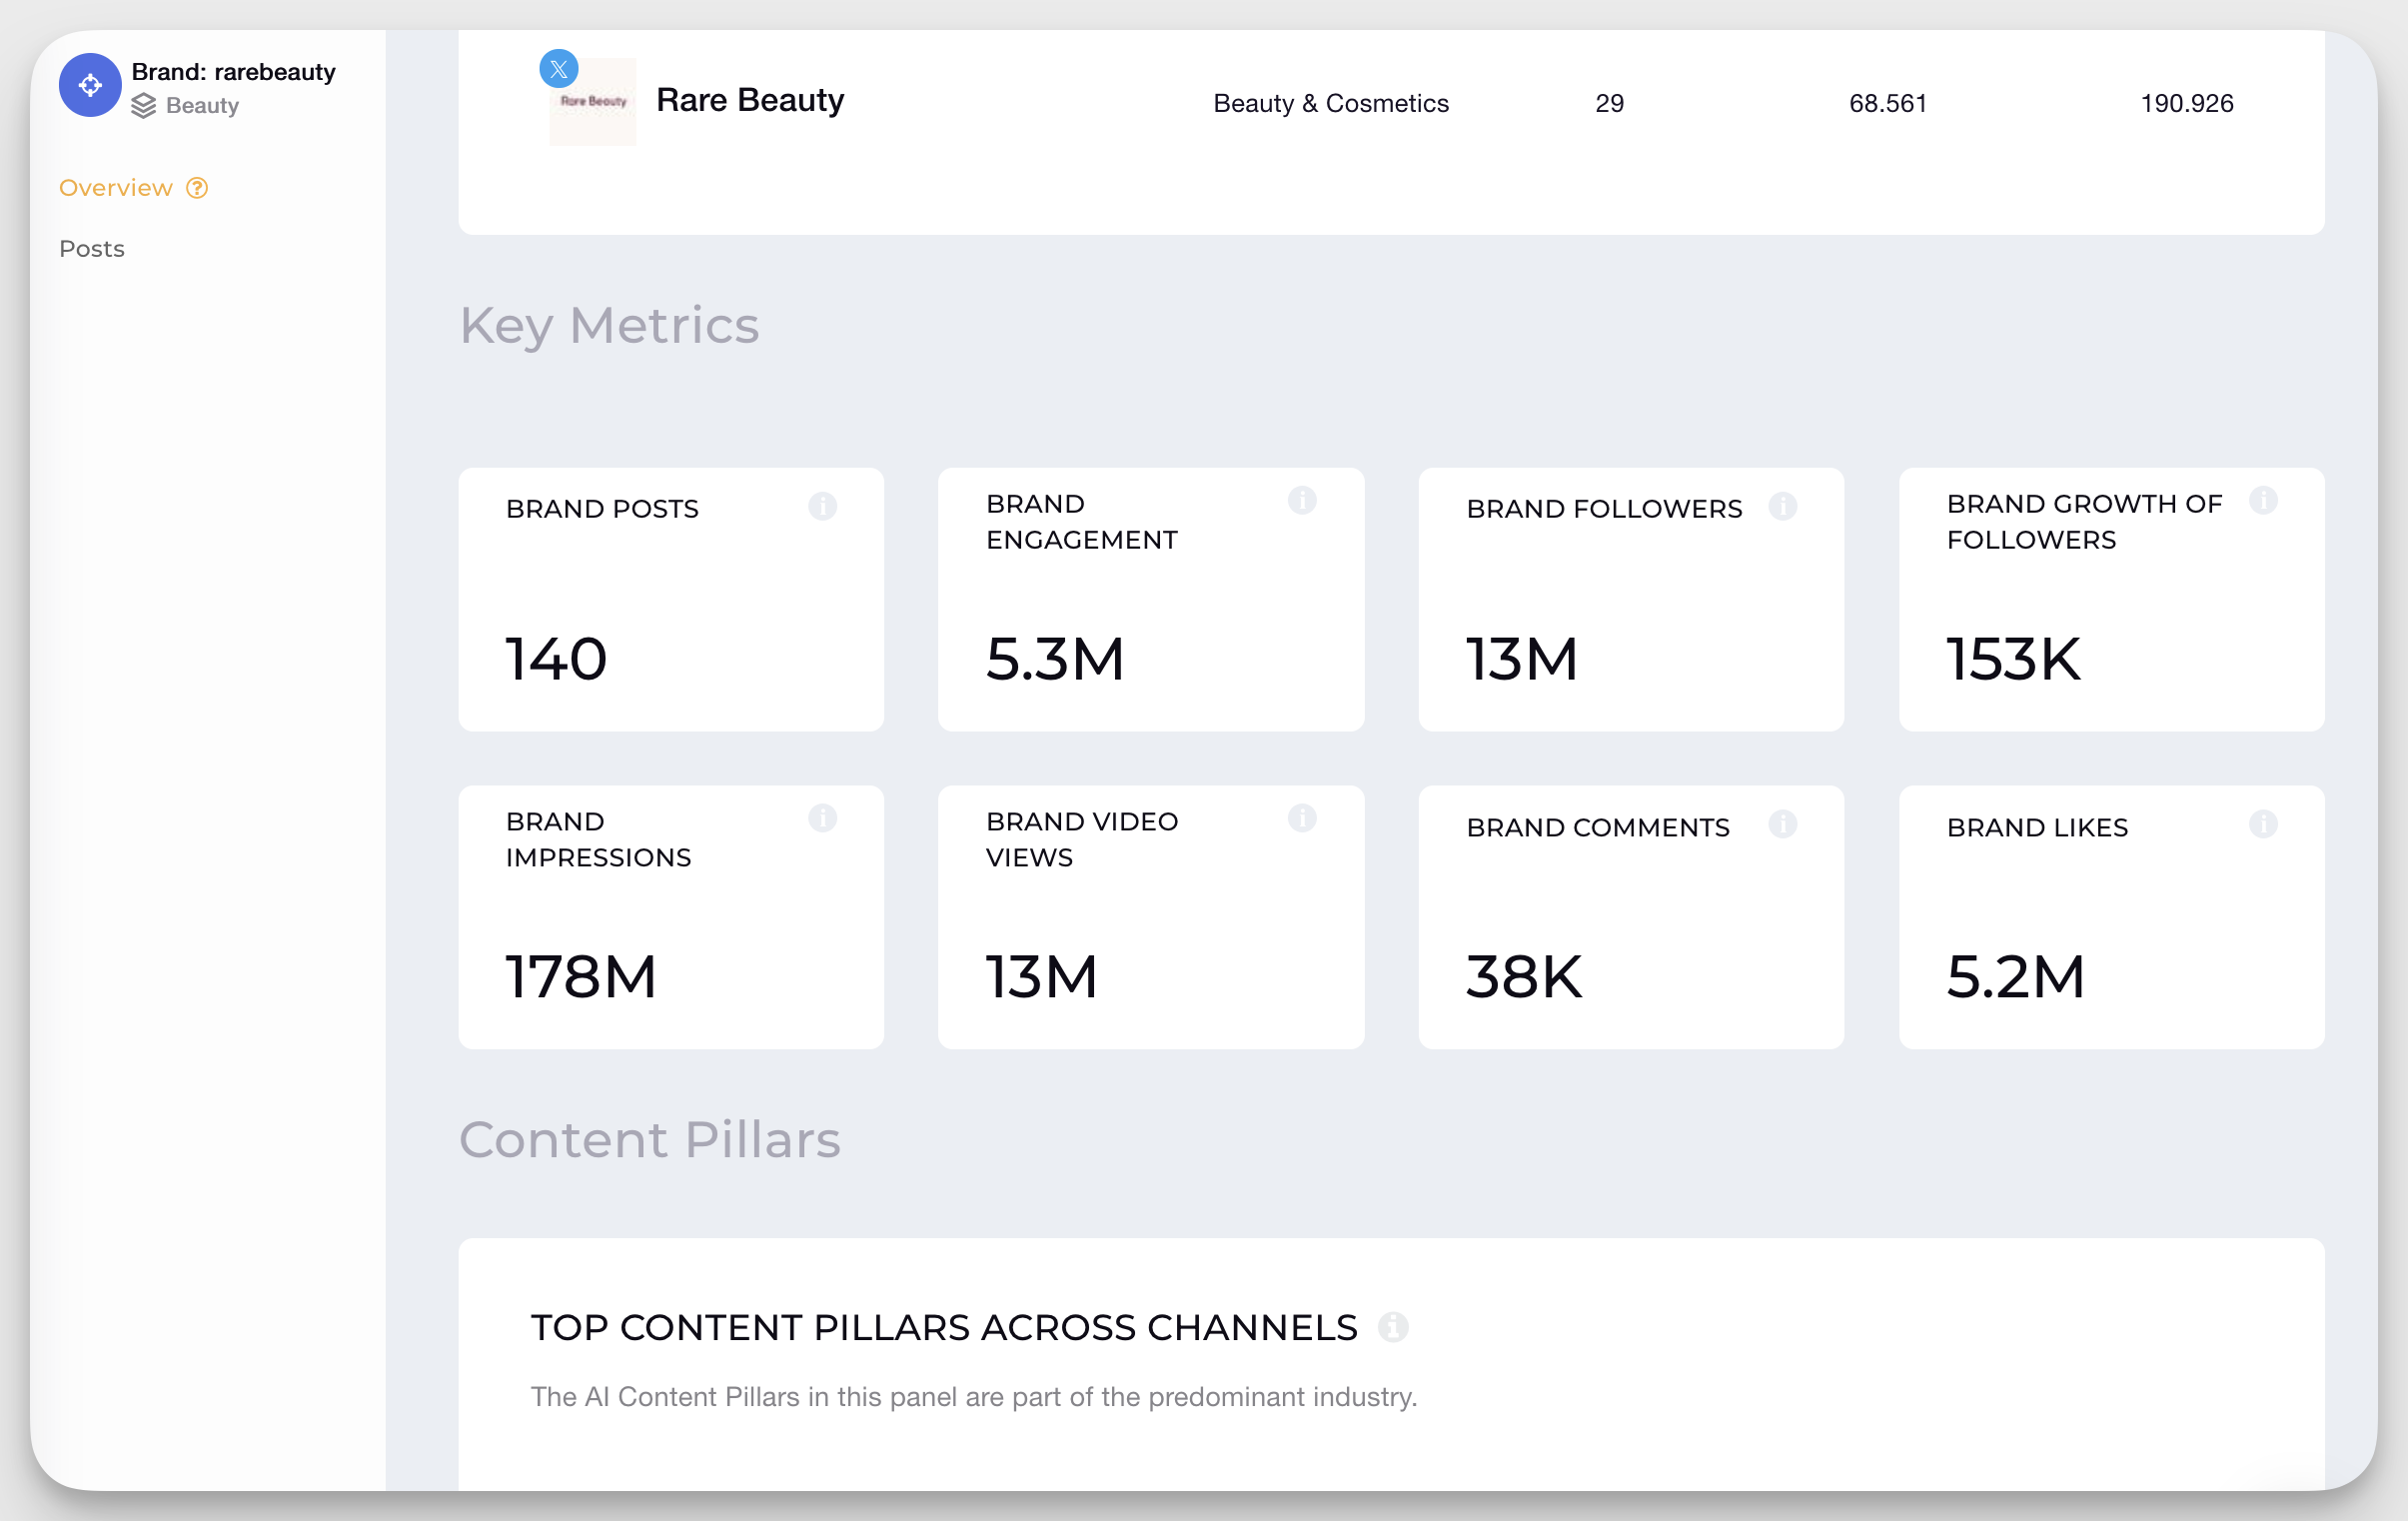
Here at Socialinsider, engagement stands at the center of our reporting philosophy, because it’s often the clearest, fastest signal of whether your content strategy is aligned with audience expectations.
When you’re responsible for proving that social matters, having clean engagement dashboards and competitor context helps you present insights with confidence, even if your organization had no prior analytics structure in place.
Given its importance in social media reporting, we always give engagement a top spot in our dashboards and feature it in our top metrics, as you can see for yourself in the screenshot below.
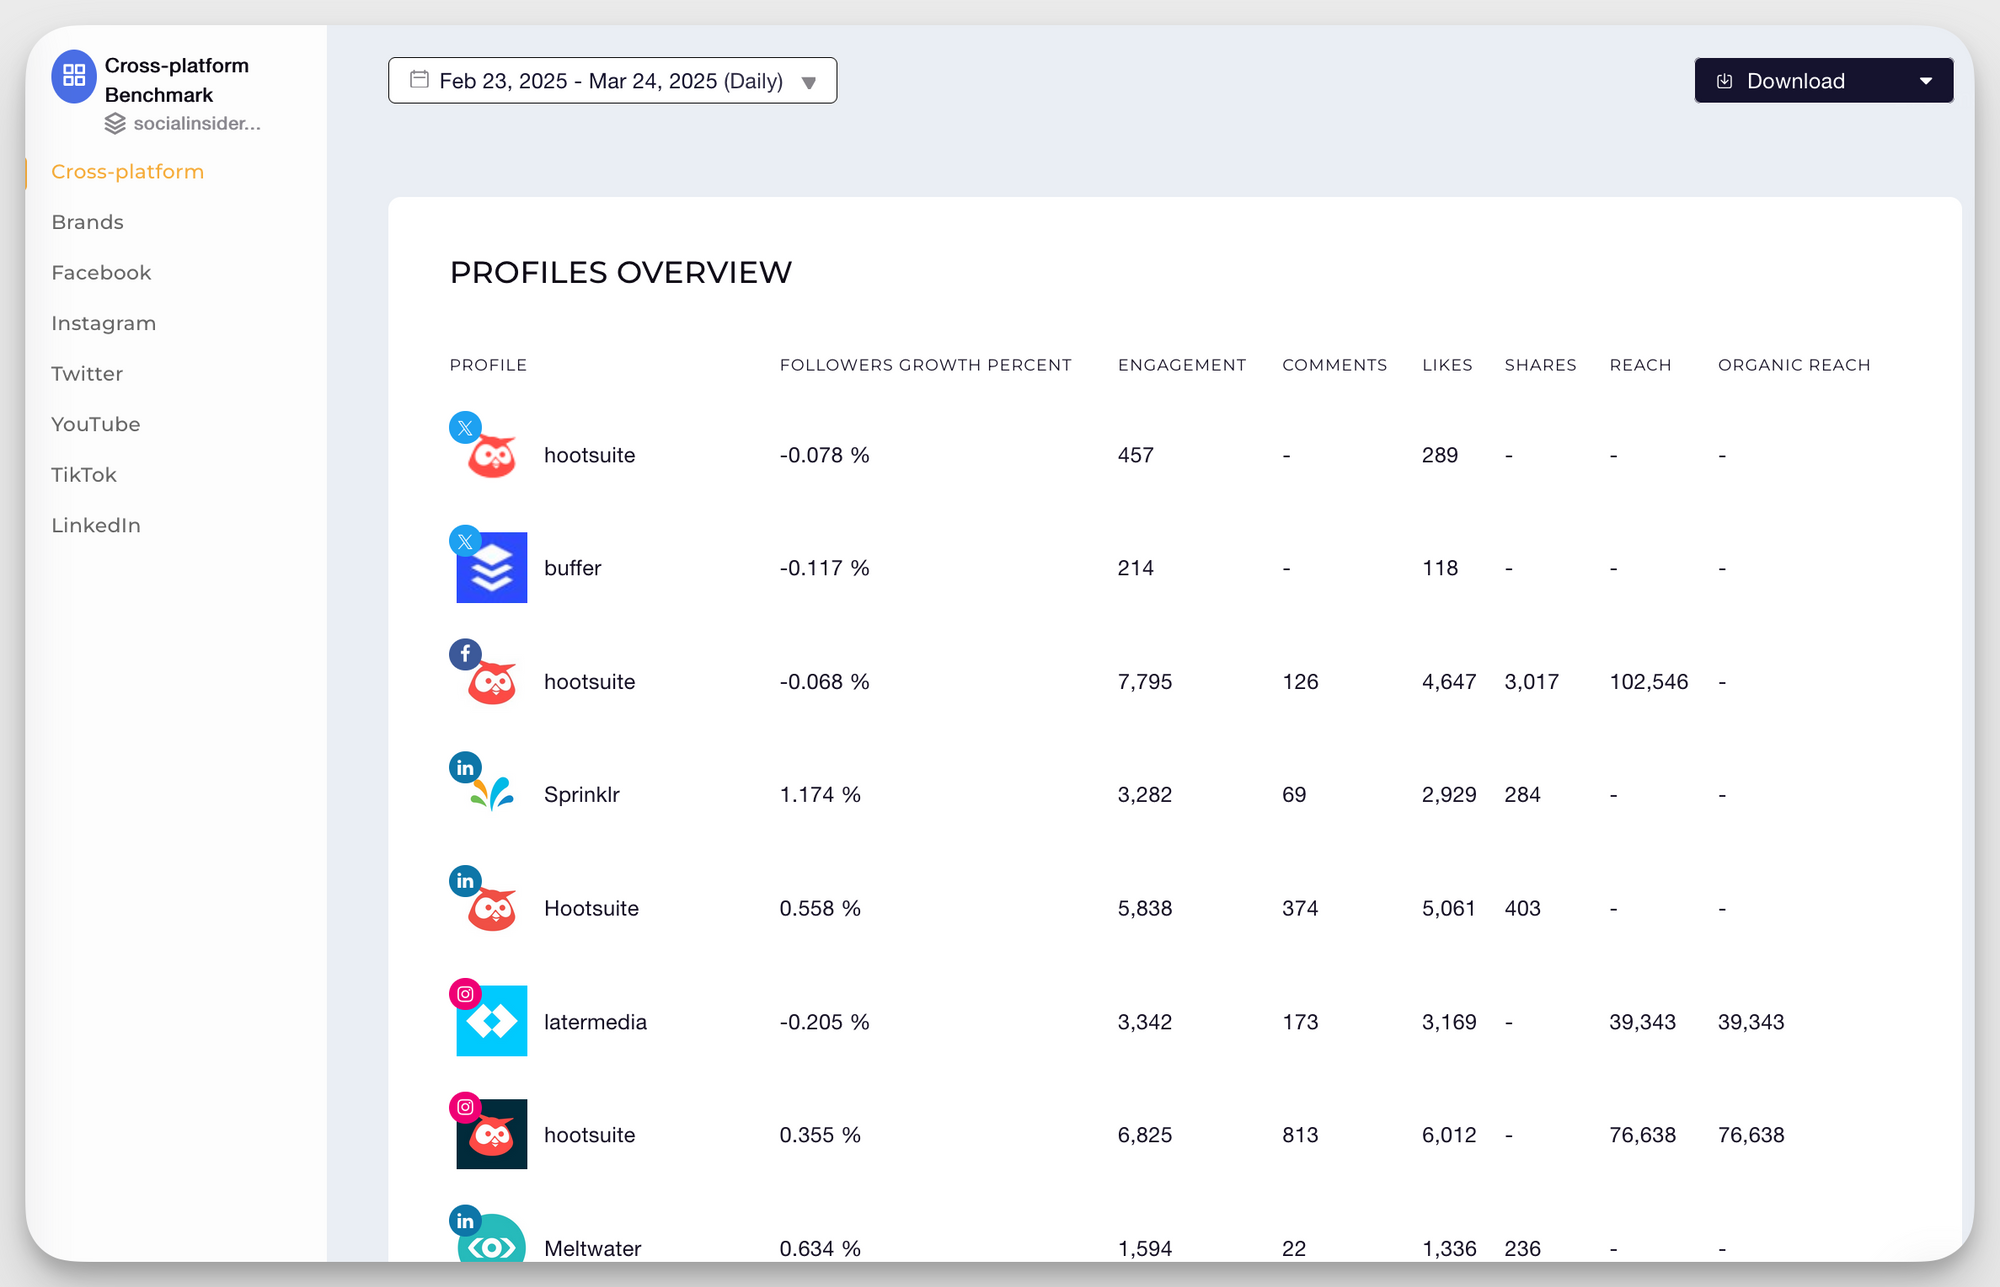
Engagement, in all its variations, also has a place in competitors analysis.
Through the Benchmarks feature in Socialinsider, you can always find competitive data for engagement highlighted in the Profiles Overview section.
When engagement becomes a KPI, tracking it across channels helps you prioritize where to invest your time, budget, and creative resources.
Here’s an example. On the cross-channel engagement dashboard, you may find certain platforms consistently outperforming others. When social becomes a strategic priority, this makes it easy to recommend where the business should double down.
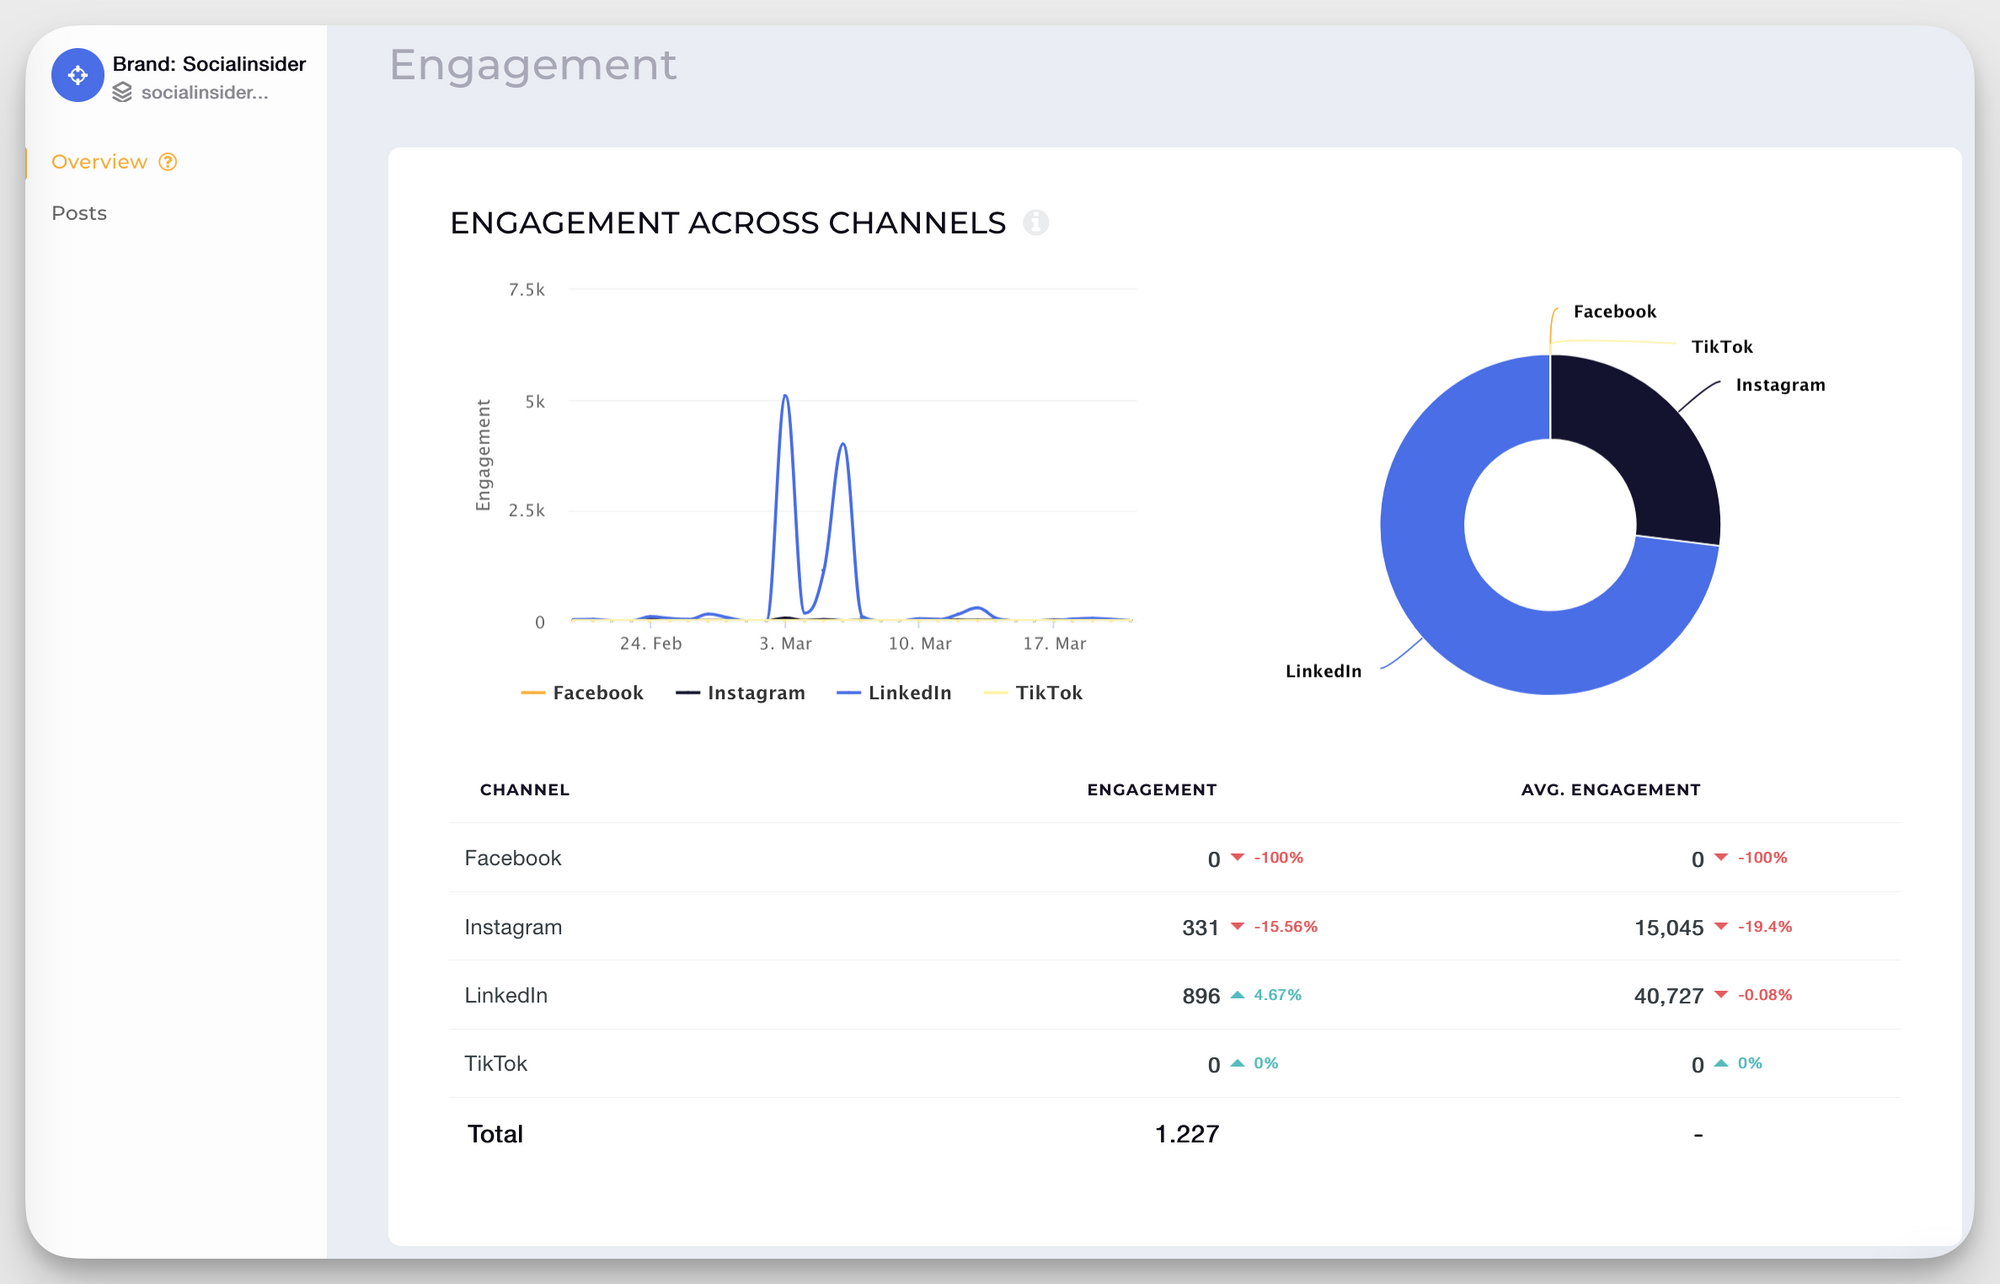
Judging by this data, LinkedIn has both the highest engagement and engagement rate out of the two platforms added, so it makes sense for this brand to focus its efforts on that channel for even better results.
Keep in mind: Relevant as it may be, by itself, engagement only counts the reactions you receive when sharing social media content (likes, comments, shares etc.) What it doesn’t do is take into consideration your audience size.
If you want to get a highly precise bird’s eye view perspective of how invested your audience is in the content you share, always check the engagement rate.

Get detailed social media analytics
Understand what are your best performing platforms and how each of them contributes to creating deeper relationships with your audiences.
Start your 14-days FREE Socialinsider trial!If you’re in a role where people are suddenly asking for reports, benchmarks, or explanations, knowing how to calculate engagement rate for each platform lets you speak the “language of social performance” clearly and confidently.
How to calculate your engagement rate for each social media platform
How to calculate your Facebook engagement rate
When social becomes an important channel, Facebook often remains a core platform for established audiences. That’s why calculating the Facebook engagement rate by followers and reach helps you present both a high-level view (followers) and a more precise assessment of content quality (reach).
And if you want to compare yourself to your competitors, then you should definitely look into what this metric is telling you.
Facebook’s definition of post engagement is the following:
The number of times that people engaged with your posts through reactions, comments, shares, and clicks.
Now, let’s turn to the algorithm that Socialinsider uses for Facebook:
The sum of reactions, comments, and shares received on the posts published in the selected time period.
And since the average value is the one that we’re interested in, here’s how Socialinsider calculates the average engagement rate on Facebook:
The average engagement rate per post by followers on Facebook is calculated as the total engagement (reactions, comments, and shares) divided by the number of posts the page published. The result is then divided by the number of followers, and all multiplied by 100.

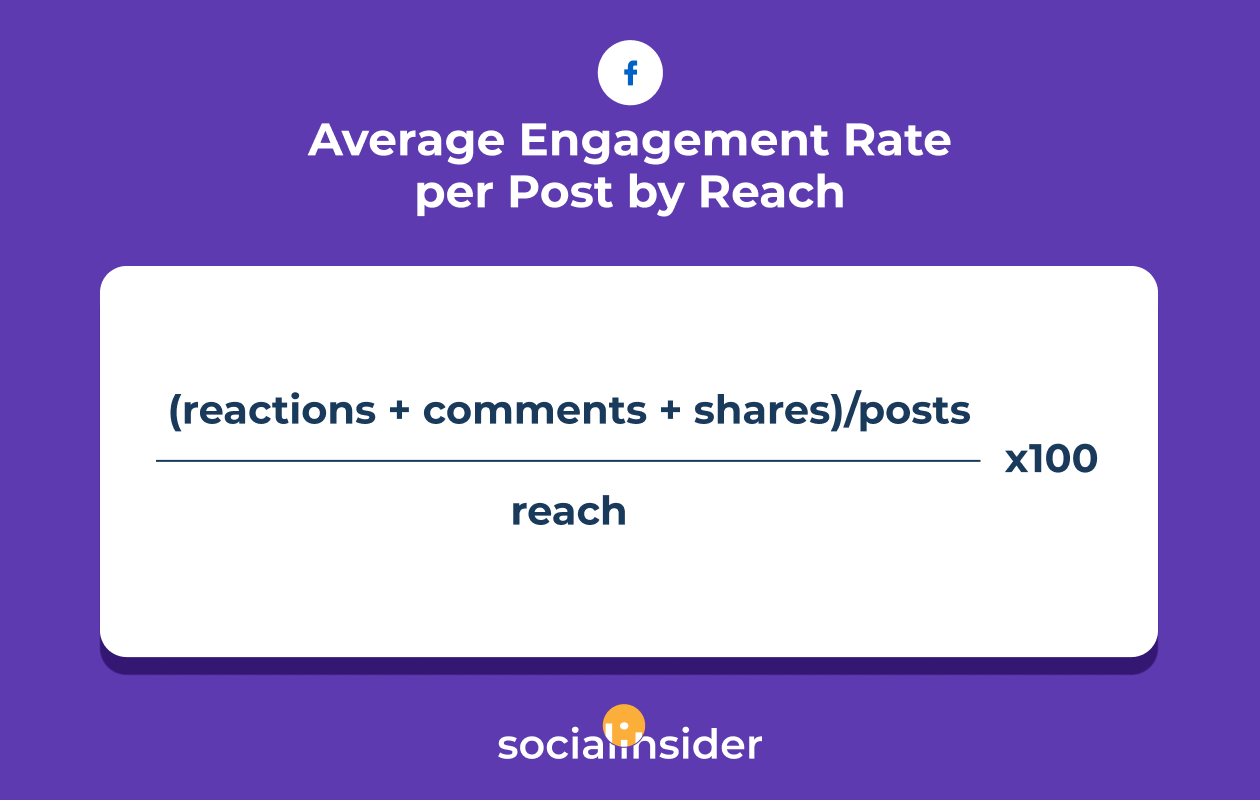
But, if you want a more in-depth look into your performance, you can always take a look at your average engagement rate by reach.
The average engagement rate per post by reach on Facebook is calculated as the total engagement (reactions, comments, and shares) divided by the number of posts the page published. The result is then divided by the total reach, and all multiplied by 100.
Keep in mind:
- Engagement = The sum of reactions, comments, and shares received for the posts published in the selected time period.
- Average Engagement = The engagement of the posts (reactions, comments, and shares) divided by the number of posts published in the selected period.
To get advanced insights about Facebook engagement beyond what Meta Bussiness Suite can offer, you need to explore some of the top Facebook analytics tools on the market.
Wanna know what your Facebook engagement rate is? Use our free Facebook engagement calculator.
How to calculate your Instagram engagement rate
Instagram is often the first platform leadership wants updates on when social starts receiving more internal visibility.
Clarifying the difference between engagement by followers (for competitor benchmarking) and engagement by reach (for performance precision) helps you deliver cleaner, more trusted reporting, especially when you’re building credibility early on.
That’s why you should consider both average engagement rate by followers and average engagement rate by reach, depending on the data that you want to report.
Instagram’s formula for engagement is the sum of likes, comments, and saves that you receive on the posts you publish.
However, Socialinsider doesn’t use this formula because Instagram API doesn’t offer access to the saves metric for competitors’ profiles. In this way, without adding the number of saves, you’re able to perform a quick social media competitors analysis and get insightful Instagram benchmarks.
Digging deeper, the average engagement rate will be defined as follows:
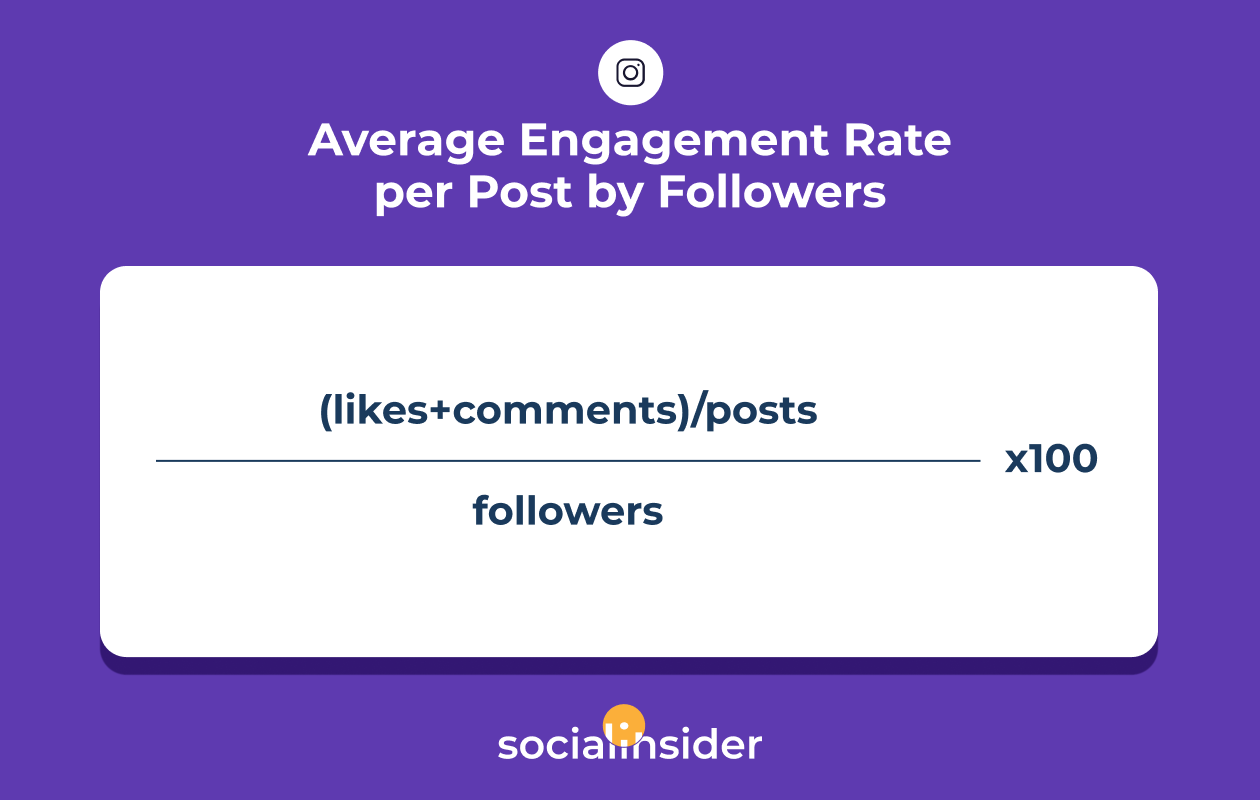
The average engagement rate per post by followers on Instagram is calculated as the total engagement (likes and comments) divided by the number of posts the profile published. The result is then divided by the number of followers, and all multiplied by 100.
The average engagement rate by reach will be indeed similar to what we’ve seen on Facebook.
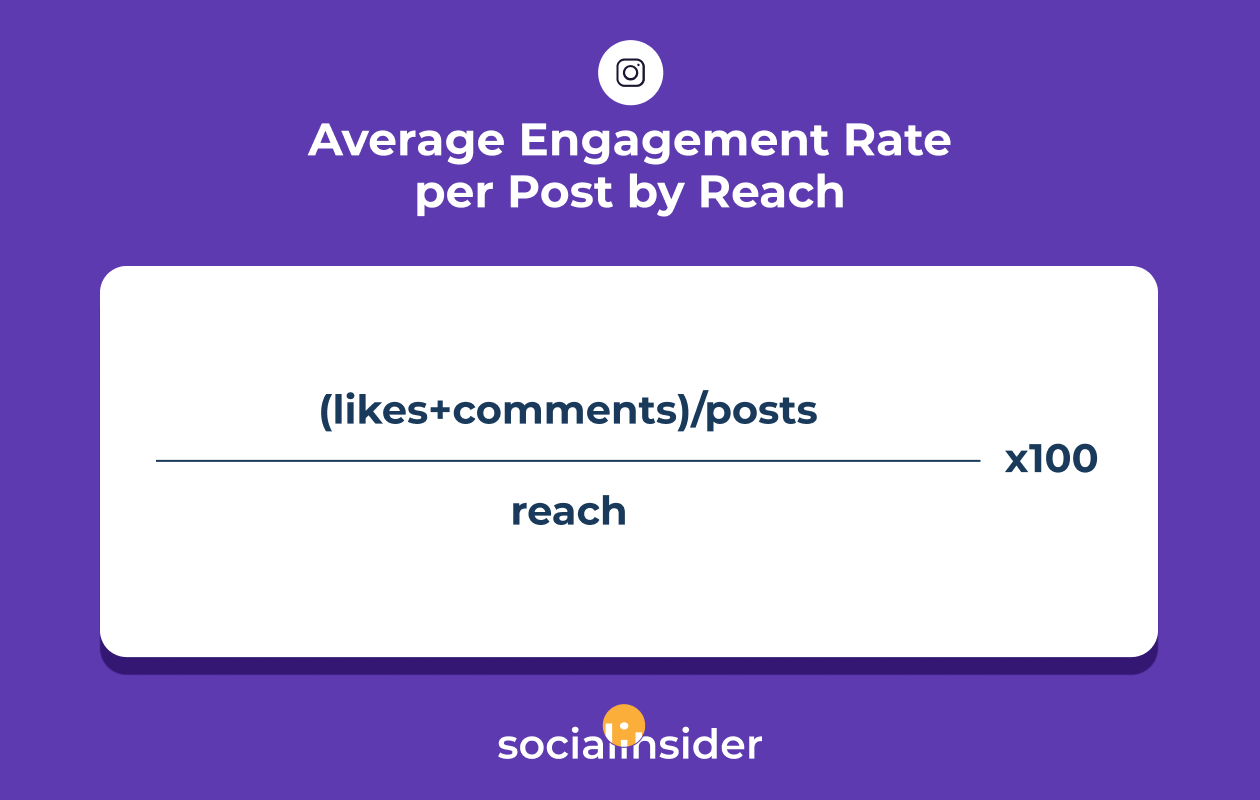
The average engagement rate per post by reach on Instagram is calculated as the total engagement (likes and comments) divided by the number of posts the profile published. The result is then divided by the total reach, and all multiplied by 100.
Keep in mind:
- Engagement = The number of likes and comments received for the posts published in the selected time period.
- Average Engagement per Post = The engagement of the posts (likes and comments) divided by the number of posts published in the selected period.
Wanna know what your Instagram engagement rate is? Use our free Instagram engagement calculator.
How to calculate your X (Twitter) engagement rate
X/Twitter engagement becomes especially important when leadership wants proof of brand relevance, thought leadership, or customer interaction.
Because Twitter surfaces impressions so prominently, being able to explain both engagement per follower and engagement per impression gives you a more confident, executive-ready story.
Twitter defines its engagement as the total number of times a user interacted with a Tweet, including retweets, replies, follows, likes, links, cards, hashtags, embedded media, username, profile photo, or Tweet expansion.
We should note that Twitter calculates the engagement rate by impressions, as follows: Number of engagements divided by impressions.
Socialinsider defines Twitter engagement as the sum of likes and retweets received for the tweets published in the selected time period.
For more insights, you should look into the average engagement rate.
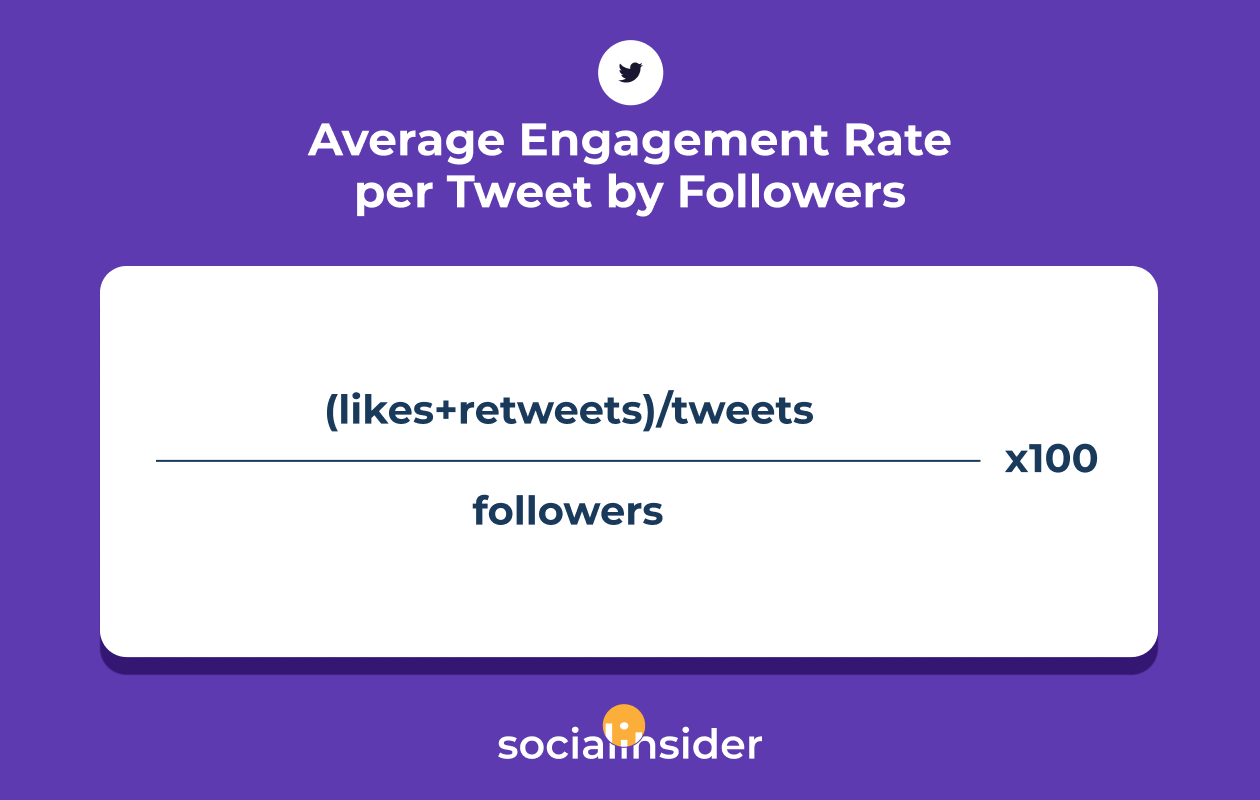
The average engagement rate per tweet by followers on Twitter is calculated as the total engagement (likes and retweets) divided by the number of tweets the profile published. The result is then divided by the number of followers, and all multiplied by 100.
Keep in mind:
- Engagement = The number of likes and retweets received for the tweets published in the selected period.
- Average Engagement = The engagement of the tweets (likes and retweets) divided by the number of tweets published in the selected time period.
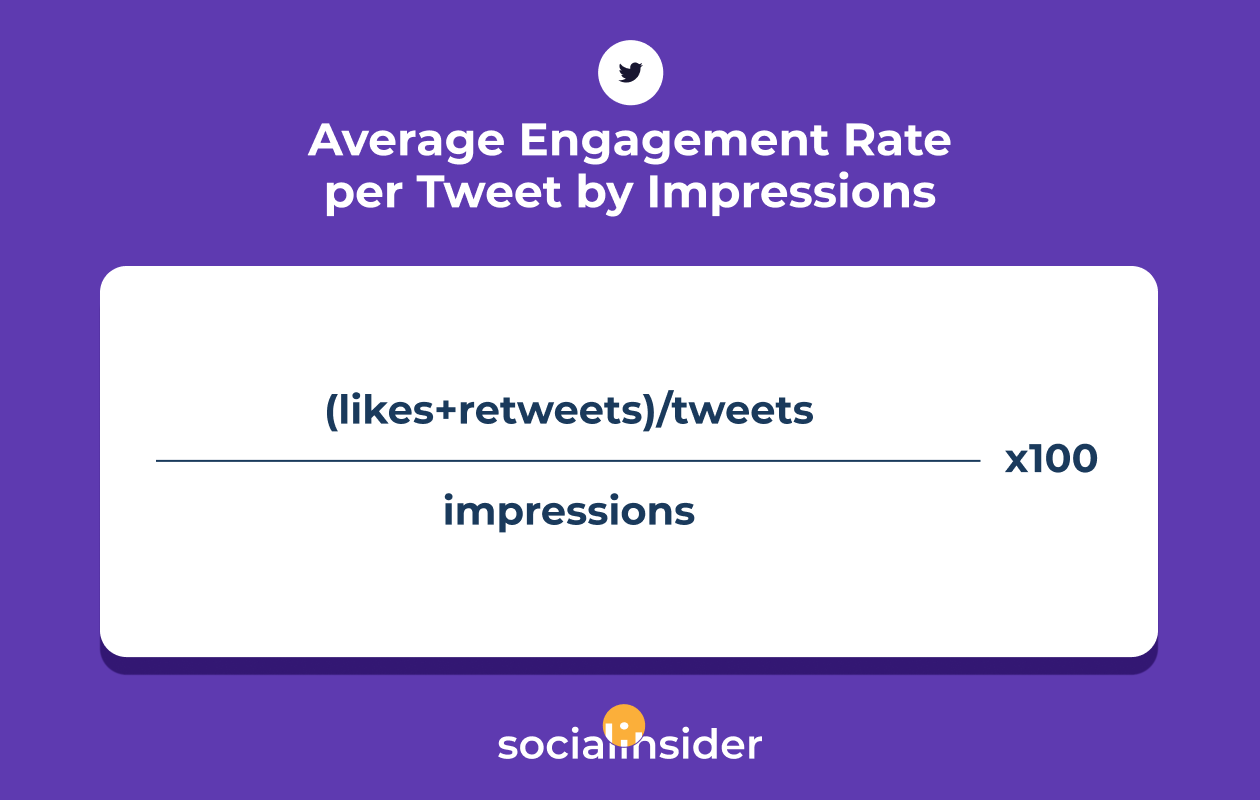
However, if you’re interested in calculating your Twitter average engagement rate by impressions, you can use the following formula.
Stay tuned! Our free X (Twitter) engagement calculator is coming soon.
How to calculate your LinkedIn engagement rate
Engagement is one of the most important LinkedIn metrics. That’s because, when social becomes strategically important inside a company, LinkedIn is often the first place executives look.
A high LinkedIn engagement rate by impressions can:
- validate your content strategy
- help you explain competitive positioning
- support leadership’s need for industry visibility
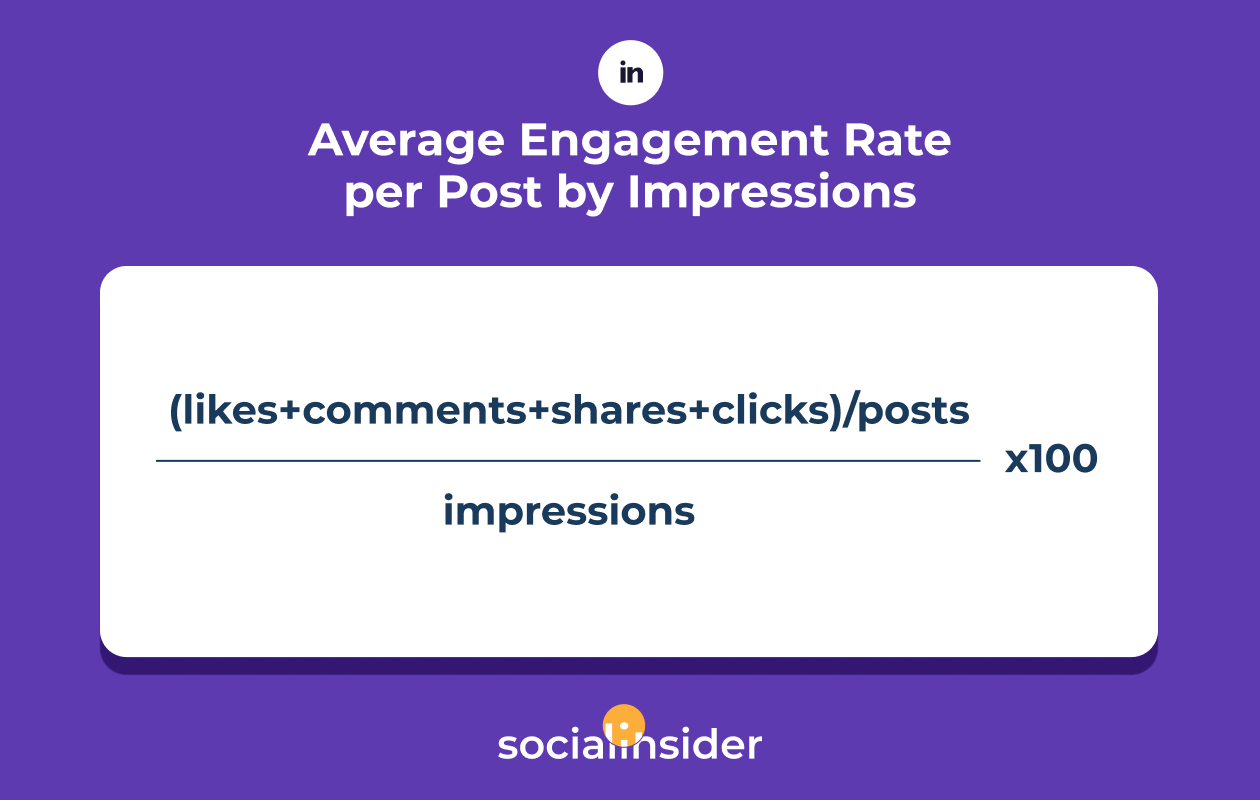
LinkedIn defines its engagement as the sum of clicks, likes, comments, shares, and follows, while the engagement rate on LinkedIn is calculated by the number of impressions.
In Socialinsider, you’ll find the LinkedIn engagement as the sum of likes, comments, clicks, and shares received on the posts published in the selected time period.
Going back to the metrics, here’s how to measure the engagement rate on LinkedIn.
The average engagement rate per post by impressions on LinkedIn is calculated as the total engagement (likes, comments, clicks, and shares) divided by the number of posts the profile published.
The result is then divided by the number of impressions, and all multiplied by 100.
Keep in mind:
- Engagement = The number of likes, comments, clicks, and shares received for the posts published in the selected time period.
- Average Engagement = The engagement of the posts (likes, comments, shares, and clicks) divided by the number of posts published in the selected time period.
Stay tuned! Our free LinkedIn engagement calculator is coming soon.
How to calculate your YouTube engagement rate
If your team invests in video, YouTube engagement metrics help you quickly show where your content actually drives reactions, not just views.
When you’re trying to prove channel value to leadership, engagement per subscriber is one of the clearest ways to show audience investment. And this means that we have to turn to data so we can do the magic.
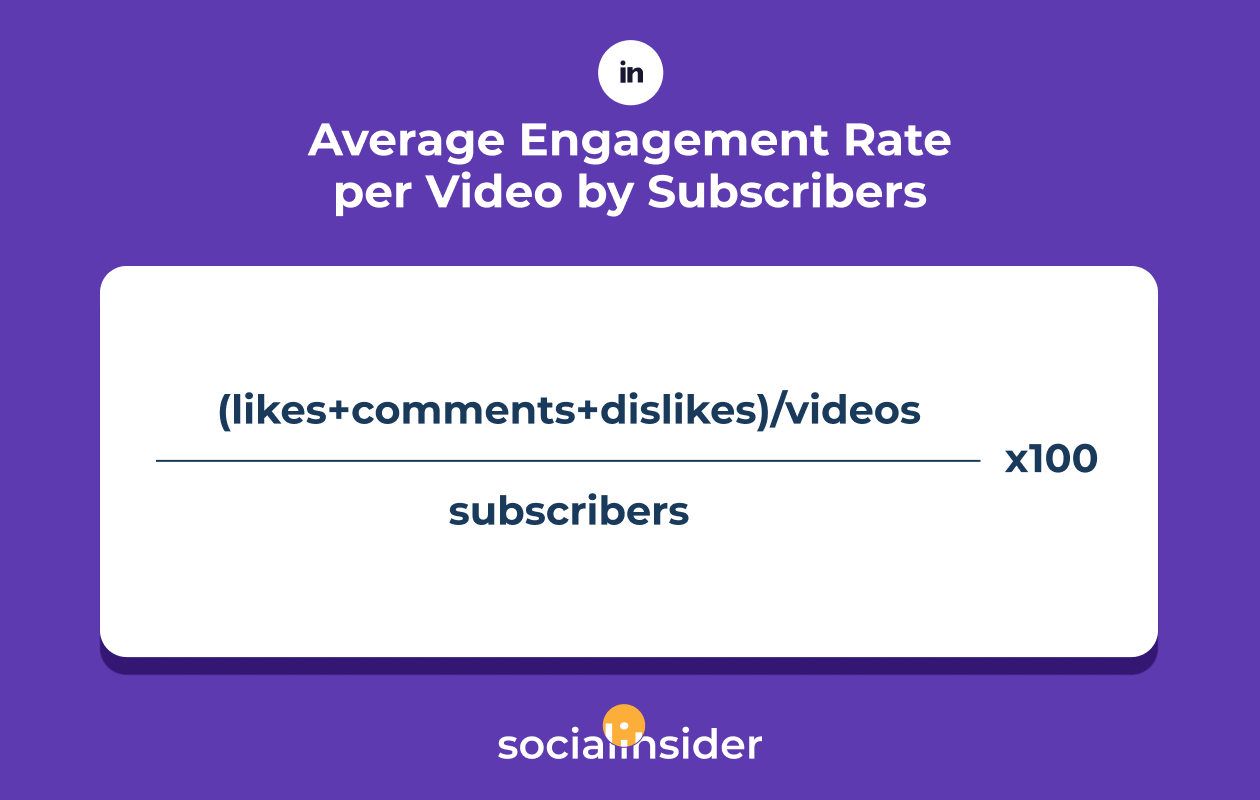
According to its insights data, YouTube engagement metrics (views, likes, dislikes, and subscriptions) reflect how many times a video or channel has been interacted with.
With Socialinsider, your YouTube engagement will be the sum of likes, comments, and dislikes received on the videos published in a selected time period.
For extra precision, you should always check the average engagement rate, which will give more insights into your performance.
The average engagement rate per video by subscribers on YouTube is calculated as the total engagement (likes, comments, and dislikes) divided by the number of videos the profile published. The result is then divided by the number of subscribers, and all multiplied by 100.
Keep in mind:
- Engagement = The number of likes, comments, and dislikes received for the videos published in the selected time period.
- Average Engagement = The engagement of the videos (likes, comments, and dislikes) divided by the number of videos published in the selected time period.
Wanna know what your YouTube engagement rate is? Use our free YouTube engagement calculator.
How to calculate your TikTok engagement rate
If your organization is exploring TikTok for the first time, the engagement rate becomes the primary signal that your content resonates beyond trends or virality assumptions.
Because platform APIs restrict access, having reliable engagement rate formulas helps you deliver stable, data-grounded reporting even when metrics fluctuate.
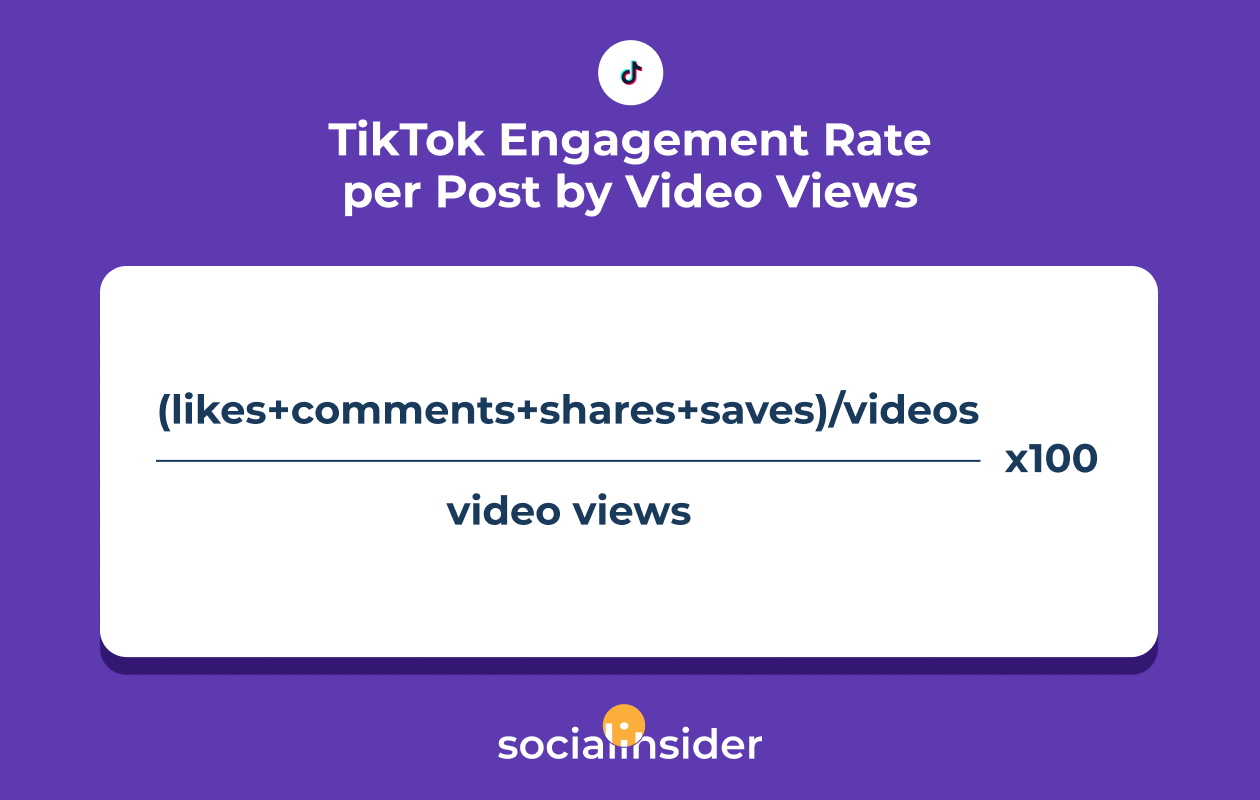
TikTok analytics presents the engagement formula as the sum of video views, profile views, likes, comments, saves, and shares.
Unlike the other social networks that are oriented towards the idea of community (where an account’s follower count is probably the number one indicator of its popularity), TikTok’s case is rather particular.
Because TikTok is a platform where going viral is the endgame, here, the most relevant metric is not the follower base but the number of views, which is exactly why the platform’s engagement formula is connected to this metric.
One thing that every social media manager must know is that TikTok’s API is highly restricted. Therefore, a social media analytics tool can’t have access to all the data.
That’s why Socialinsider defines engagement on TikTok as the sum of likes, comments, and shares received on the videos published in the selected time period.
To calculate the average engagement rate per video for TikTok, you should take the total engagement (likes, comments, saves, and shares) and divide it by the number of posts the profile published. The result is then divided by the number of views, and all multiplied by 100.
Keep in mind:
- Engagement = The number of likes, comments, saves, and shares received for the posts published in the selected time period.
- Average Engagement = The engagement of the posts - likes, comments, saves, and shares - divided by the number of posts published in the selected time period.
Wanna know what your TikTok engagement rate is? Use our free TikTok engagement calculator.
How to use engagement rates in your Social Media strategy
When social becomes an important channel in the company, engagement rate helps you:
1. Optimize your content quickly
Find fast wins by studying high-engagement posts. This helps you build early credibility in your role.
2. Prove campaign success clearly
Pair engagement with conversions to show both interaction and business value.
3. Adapt to each platform’s algorithm
When you exceed platform benchmarks, you can argue persuasively for resource allocation, something leaders love when a channel is becoming strategic.
Final thoughts
When you’re in a role where social is newly important (or where leadership wants stronger performance insights), engagement rate becomes one of the most reliable indicators of whether your strategy is working.
A social media analytics tool like Socialinsider gives you fast clarity, competitor context, and leadership-ready reports without manual spreadsheets. This helps you show value early, make confident recommendations, and build the trust you need to drive strategy forward.
Frequently Asked Questions about Engagement Rate
1. What is a good engagement rate?
That depends on the platform. 1% can be a great engagement rate on Instagram, but not so good on TikTok. Check out our social media benchmark reports to find out the average engagement rate for each platform.
2. Is engagement rate a good metric?
Engagement rate is one of the key metrics that measure content performance. Social media strategists track engagement rate to understand how much their audience resonates with the content they share.
3. How do you benchmark engagement rate?
There are multiple ways to do so: you can benchmark your engagement rate against yourself to see how your content performed over time, you can benchmark your engagement rate against your competitors using platforms like Socialinsider, or you can benchmark your engagement rate against your industry or the average engagement rate for that platform (check out our Resources section for more details).
4. Can engagement rate be more than 100?
The engagement rate cannot surpass 100 as it is a metric designed as a percentage (out of 100).
5. What can influence engagement rate?
Many factors can influence engagement rates, such as content quality and relevance, audience demographics and preferences, posting timing and frequency, as well as platform specific factors.
Andreea Udescu
Content writer with 7 years of experience in digital marketing. When I’m not writing, I like to go on coffee dates with friends, dabble in poetry and fill my house with flowers.

Know what your competitors do — before your manager asks
Get instant social benchmarks & reports without manual work.
You might also like


Improve your social media strategy with Socialinsider!
Use in-depth data to measure your social accounts’ performance, analyze competitors, and gain insights to improve your strategy.