We're all living in the Datanheimer land, and Socialinsider is here to make your life easier in this world.
And we all know that data never lies.
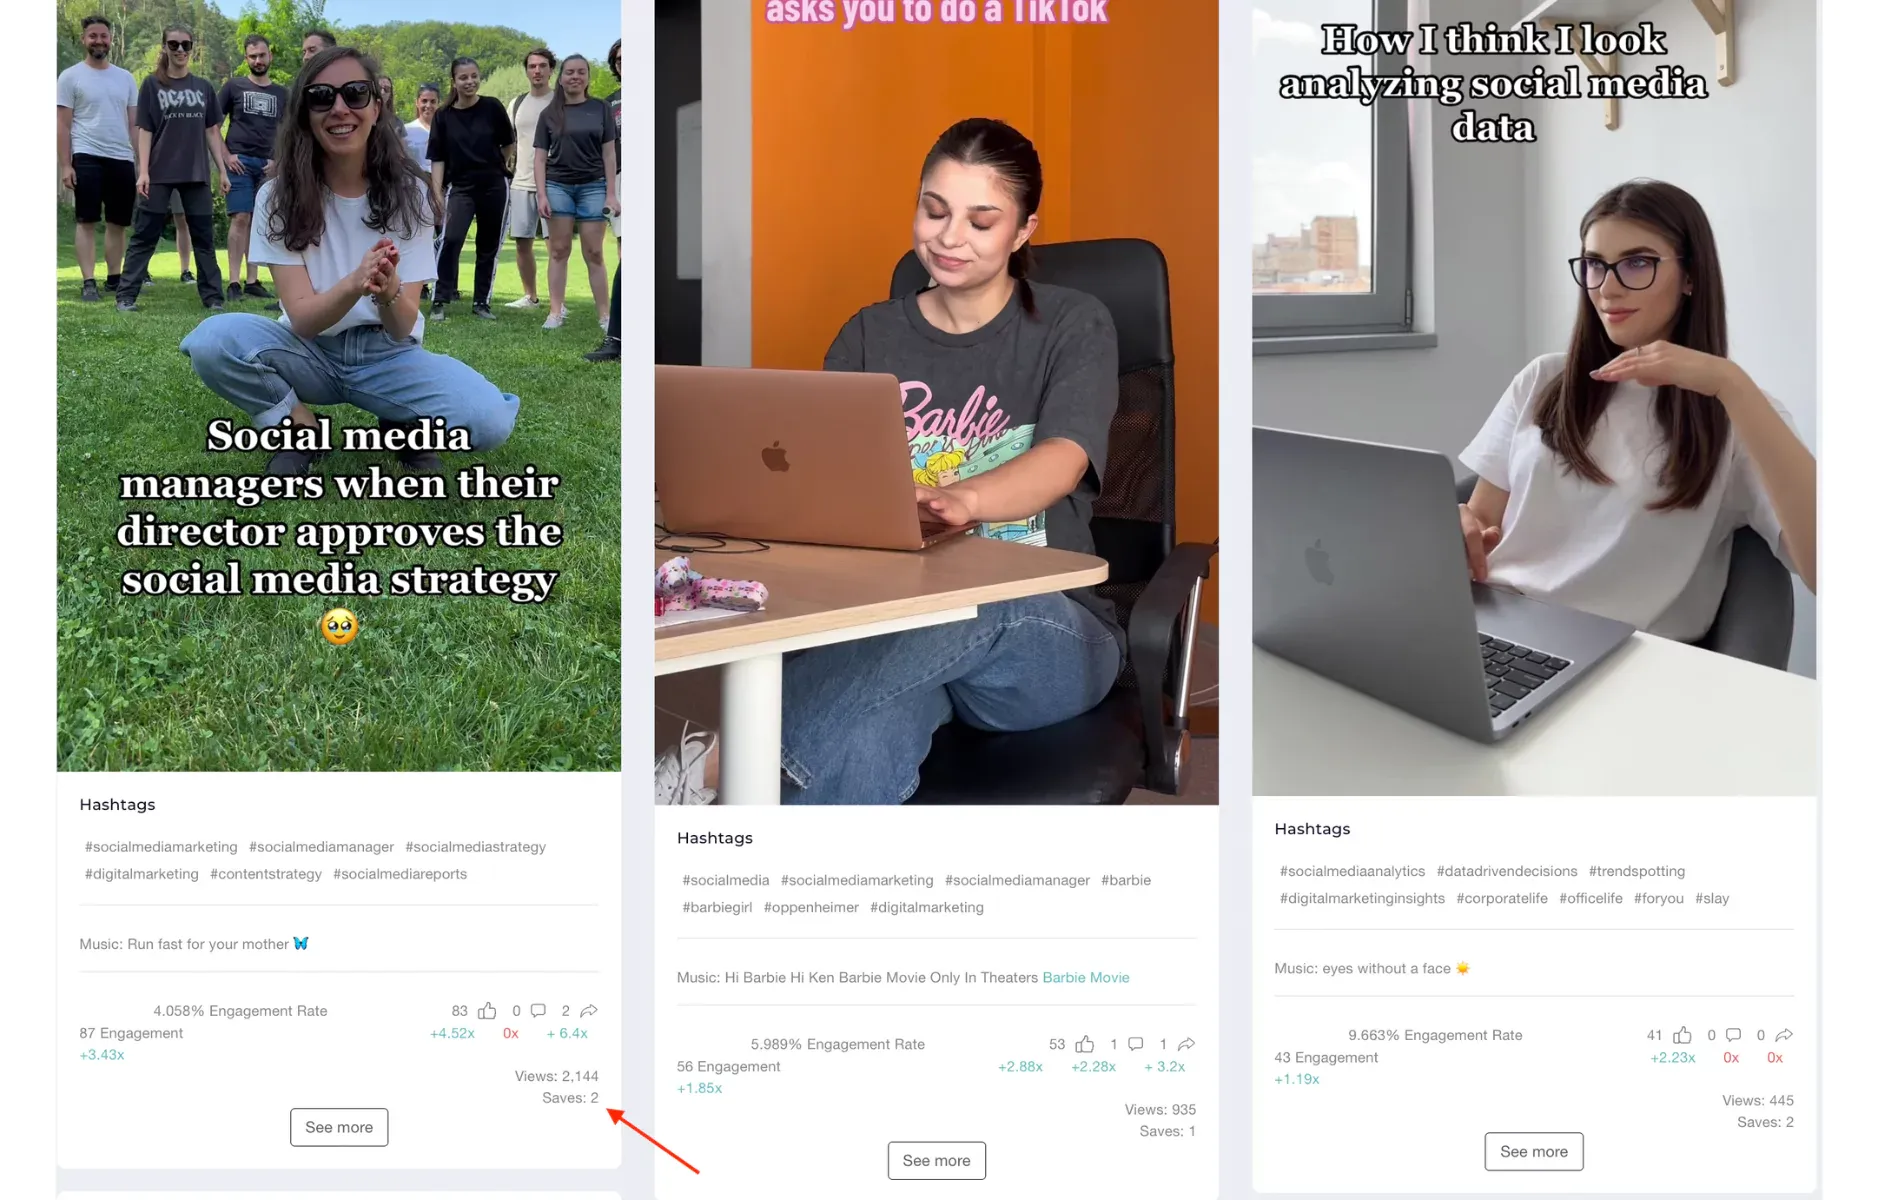
1. TikTok Saves:
TikTok is here to stay. So why not have the best time of our lives while doing the reports?
It's actually really interesting to see what type of video speaks to the audience - some people save motivational videos, funny videos with random things, or just something educational they found useful.
You can now see the number of saves on each video published in the selected time period.

Moreover, our formula for TikTok engagement has slightly changed in order to keep up with everything social.
Engagement = likes + comments + shares + saves
Keep in mind that the engagement rate is calculated as follows:
Engagement Rate = (likes + comments + shares + saves)/views
2. New Sidebar:
Now, here we are with an awesome update that has already opened lots of paths for us.
We have moved some of the options to the new vertical sidebar.

Why is this important?
We've been thinking about this for a while now, and we're happy to say that it's awesome to see the light at the end of the tunnel.
We wanted to create a more efficient way of playing around in the dashboard. So this change not only offers the users a better experience within the app but also gives us more space to add new functionalities to the dashboard.
🚨 Spoiler Alert - this is just the beginning of an awesome adventure around the app. Any feedback would be lovely. Thank you in advance!
3. LinkedIn Mentions:
LinkedIn is all fun and games until you realize that is continuously changing. Many thanks to the universe that we're all in this together, and we love to be a step ahead of everything.
That's why you now have LinkedIn mentions right in your dashboard.

Check out all the mentions you have for your own LinkedIn page.
4. Ads Report:
We know how important it is to be able to export all the insights of your paid efforts. And now you can do that. 😉
Export all the ads as a very good-looking report. All you have to do is add the Ad account to your project, and then you can see the data and download the reports.
There are multiple reporting options: PDF, PPT, CSV.
Product Improvements 🚀
- Benchmarks Reports - Download a CSV benchmarks report only with the metrics you need (choose the metrics you want to see in the dashboard and report from the right sidebar).
- LinkedIn Video Insights - We just can't get enough of video insights. 📹 And now we have more data to share with you. Connect your own LinkedIn page to see: video views evolution, average views per video, video watch time evolution, and total watch time.


