17 Insightful Social Media KPIs Every Seasoned Marketer Should Track
Discover what the most important social media KPIs are and why they matter. Discover how to look at the data to get better at strategic planning.

I was mapping out a new campaign the other day and happily plugged in KPIs like conversion rate, sign-ups, and all the ’serious’ metrics. Halfway through, it hit me: the campaign goal was engagement. Why on earth was I measuring conversions?
If the real aim is to spark conversations, I should be tracking comments, shares, saves, and the stuff that actually shows people cared.
That tiny moment made something very clear: KPIs aren’t random numbers you pick to improve your social media marketing. They need to match the outcome you want.
In this guide, I’ll walk you through the exact process on how to set KPIs and when to focus on which KPIs.
Key takeaways
- What’s the difference between social media KPIs and social media metrics? Put it shortly, metrics show what’s happening, but KPIs show what actually matters by tying those metrics directly to your goals.
- How to set social media KPIs for your goals and business? Set KPIs by anchoring them to your goals, aligning them with stakeholder priorities, and matching them to each platform’s role in the customer journey.
- Awareness KPIs: show how visible your brand is by revealing how many new people you’re reaching and whether your content is actually getting discovered.
- Engagement KPIs: show whether your content resonates by measuring how actively people interact, react, and participate.
- Conversion KPIs: show how well your social content turns interest into meaningful actions that drive real business outcomes.
- Common mistakes to avoid when tracking social media KPIs: The biggest mistakes come from tracking too many metrics, choosing KPIs that don’t match your goals, or measuring success without proper context or timelines.
What are social media KPIs?
Social media KPIs are the specific metrics you choose to measure progress toward a clear goal.
Think of them as the numbers that show whether your efforts are working or drifting off-track.
In simple terms, KPIs take a broad goal like increasing engagement or driving traffic and turn it into something measurable. For engagement, that could mean tracking comments, shares, or saves. For traffic, it could be link clicks or sessions from social.
What’s the difference between social media KPIs and social media metrics?
Social KPIs are not the same as metrics. Here’s the difference:
- Metrics are the raw data points you track on a regular basis. They show what’s happening on your social channels, but not all of them directly influence your goals.
- KPIs, on the other hand, are the select few metrics that matter the most. They’re tied directly to your goals and tell you whether your strategy is actually working.
Let’s say your goal is to increase website traffic from social. You might track several supporting metrics: link clicks, reach, landing page views, and CTR. But your KPI would be traffic sessions coming directly from social. That’s the metric tied to the actual outcome.
What are the benefits of measuring social media KPIs?
Best KPIs for social media give you clarity. Here are five key reasons to set and measure them.
Helps prove value and credibility
“Does social media even result in something?”
If you’ve heard this before, you know exactly why KPIs matter. They’re your proof. When you’re new to a role or need to convince leadership that social deserves its seat at the table, KPIs show the impact behind your work.
For example, if you can point to a 22% rise in engagement rate after a content revamp or a steady increase in demo requests from LinkedIn, that’s proof the management wants.
Helps measure progress towards goals
Social media analytics KPIs show whether you’re moving forward, stalling, or accidentally sprinting in the wrong direction.
If your goal is brand awareness, tracking reach, impressions, and follower growth tells you whether more people are actually discovering you. When reach climbs and your engagement rate nudges up, that’s a clear signal your content is hitting the right audience.
Aids in benchmarking against competition
Competitive pressure is real. More than a few interviewees admitted they opened Socialinsider because a boss or client said, “Can we compare this with what competitors are doing?”
KPIs let you stack your performance against others in your industry, spot gaps, and find where you already outperform them.
Related read: 11 best competitive analysis tools on the market right now
Justify budget and investment
Want approval for that tool upgrade, extra creator, or bigger ad budget? KPIs make the case for you.
When you can tie your work to real outcomes, like lower CPCs, higher retention, or more qualified leads, it becomes much easier to secure funding or expand your team.
Helps with team alignment
Nothing derails a strategy faster than everyone chasing different definitions of success. KPIs solve that. When marketers, strategists, and analysts agree on what ‘winning’ looks like, the entire team moves in the same direction.
How to set social media KPIs for your goals and business
There are three ways I go about setting KPIs. Let’s explore each in detail.
Select KPIs based on goals
Start with one simple question. What am I trying to achieve with social media?
Your answer decides everything. If the goal is brand awareness, you’ll track visibility metrics. If the goal is engagement, you’ll measure how people interact. If you’re chasing growth, you’ll look at follower trends and reach patterns.
Goals shape KPIs, not the other way around.
Let’s take an example to understand better.
Corporate wants proof that social is driving business outcomes.
In a case like this, your KPIs must translate engagement into executive language. For example, here are a few metrics:
- Brand visibility: impressions, share of voice
- Campaign ROI: cost per engagement, CTR
- Competitive ranking: your position against three key competitors
- Revenue generated from social
Now that you know the goal is to show business impact, you might select CTR, revenue, and conversions from social as primary KPIs. Then support them with metrics like cost per engagement and share of voice.
Co-create KPIs with stakeholders
The best KPIs are rarely born from a solo brainstorming session.
Leadership usually has the clearest view of the bigger picture, so their input is essential. They know the company’s priorities for the quarter. And thus they know exactly where social needs to contribute.
When they inform your KPIs, social media efforts will be sure to align with the actual business plan.
Here’s a simple example.
Leadership signals that the company is pushing for stronger market presence this quarter.
That one line instantly shapes your KPIs. You shift towards:
- Share of voice
- Reach
- Brand recall indicators
- Growth in new audience segments.
The biggest advantage of this is alignment and buy-in from the core people in your organization.
Understand customer journey to zero in on KPIs
How do people move from discovering your brand to actually buying? Awareness. Consideration. Conversion. Retention. Each stage demands different actions from your audience, so each stage needs different KPIs.
Once you map the journey, match your platforms to the role they actually play. Not every channel does everything.
For example, Instagram might be your discovery engine. It pushes your brand in front of new people. In that case, you focus on awareness KPIs. Reach. Share of voice. New followers.
If LinkedIn drives high-intent traffic, the KPIs shift. CTR. Website sessions from social. Lead form fills.
In this process, each platform earns KPIs that match the job it performs in the journey.
17 social media KPIs to track
For easy social media KPI selection and tracking, we have divided all key KPIs in four categories.
Awareness KPIs: am I reaching the right people?
Awareness KPIs show how many new people are discovering your brand and how visible you are in your market. They track metrics like reach, impressions, share of voice, and follower growth so you can see whether your content is getting noticed and expanding your audience.
1. Reach
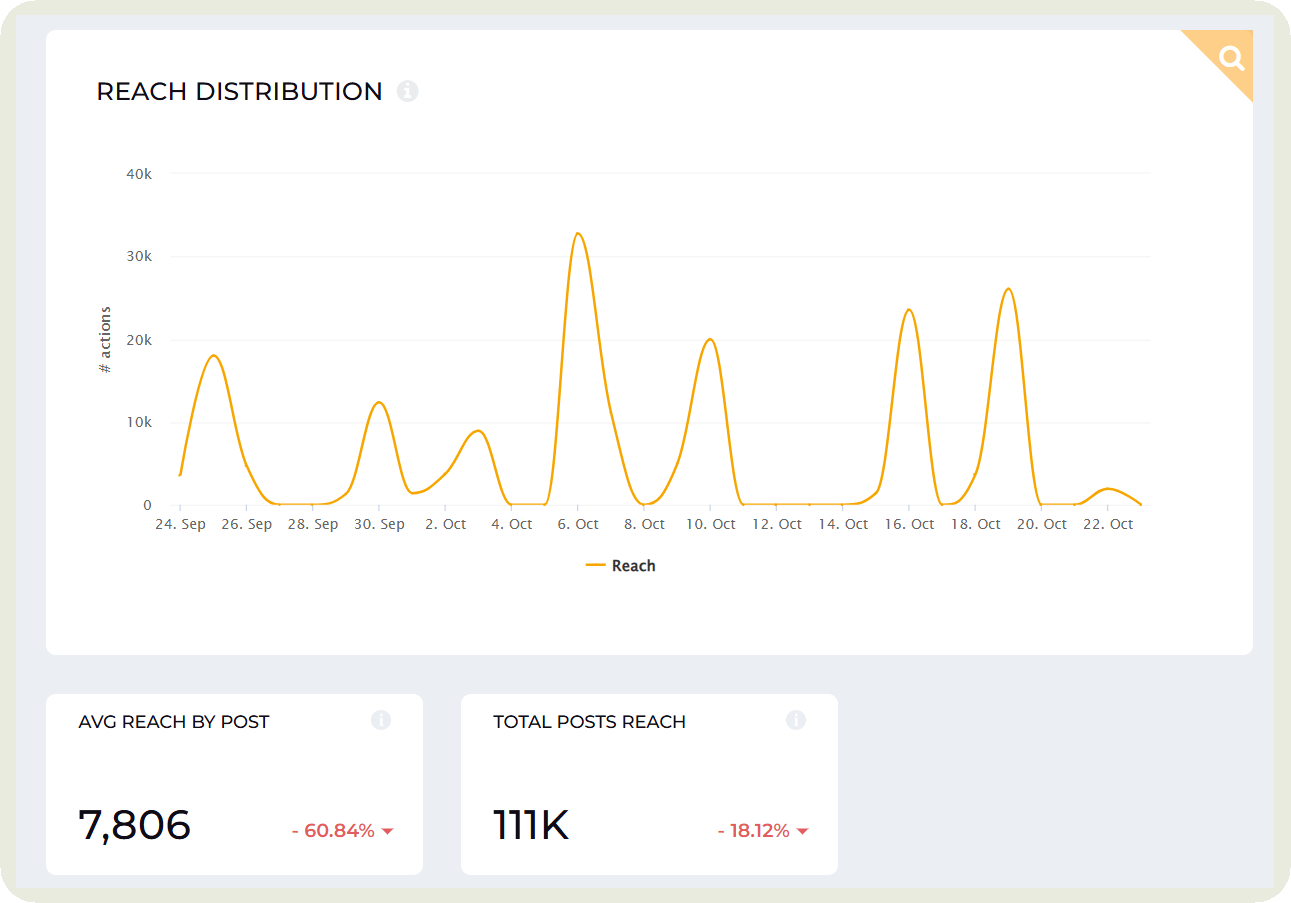
Reach measures the number of unique people who saw your post. It tells you how far your content actually traveled instead of how many times it was loaded.
Instead of looking at absolute numbers, I recommend monitoring the reach trend over time.
I use Socialinsider to get this information.
When to make this your main KPI?
Reach is the best fit when you’re launching a new product, entering a new market, running top-of-funnel campaigns, or trying to boost visibility for a key message.
2. Follower growth
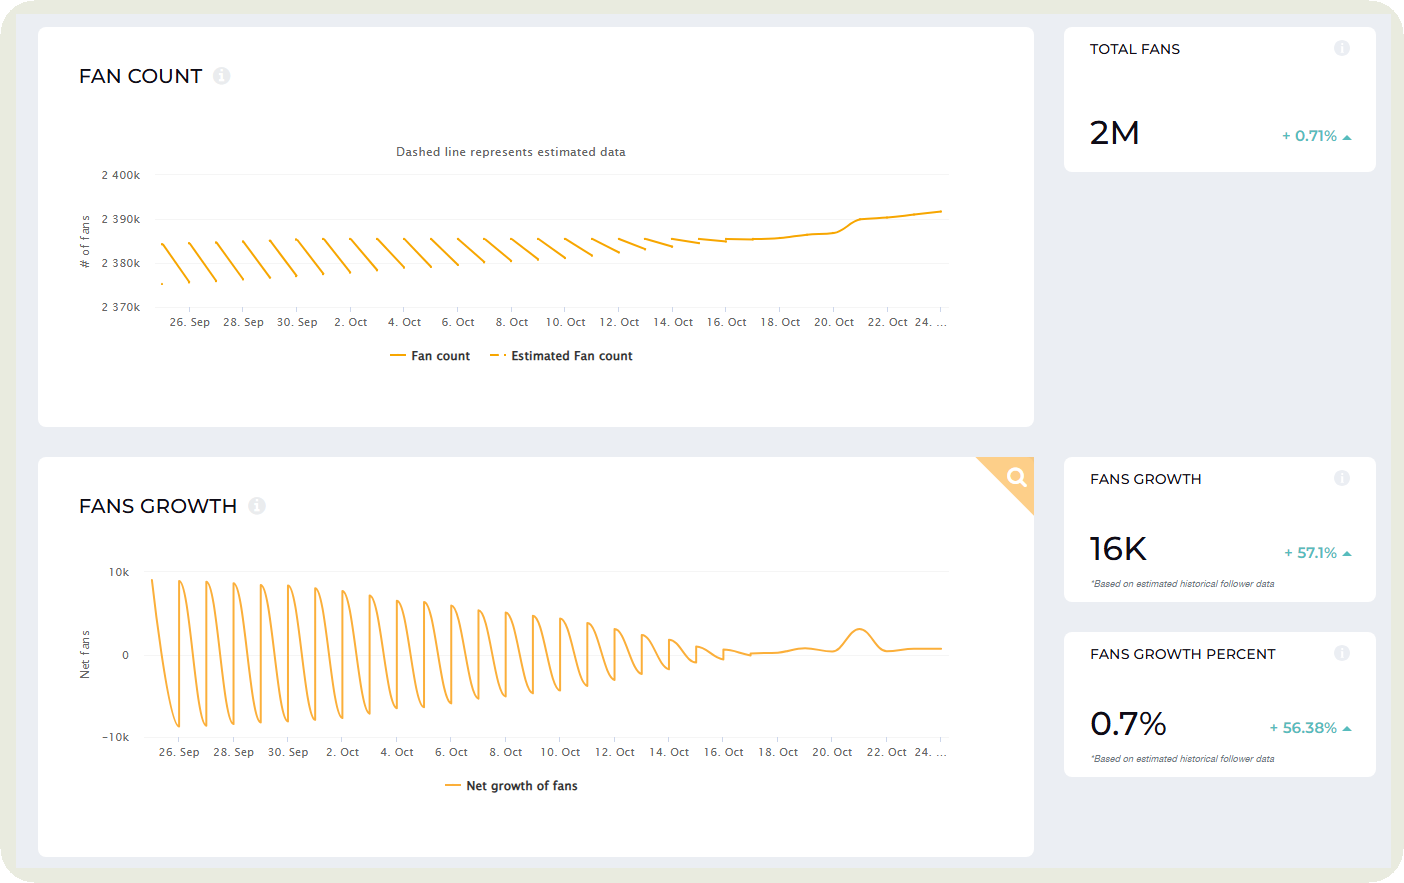
Follower growth tracks how many new people chose to follow your account over a specific period.
It reflects how effectively your content, brand voice, and overall presence are convincing new viewers to follow you.
It also signals whether your top-of-funnel efforts are attracting the right audience or simply generating passive views without long-term interest.
If you are tracking follower growth over a period, you can use Socialinsider to get data on historical follower growth as well.
When to make this your main KPI?
Make follower growth your primary KPI when your goal is to expand your audience, build long-term community, or move into new markets.
It’s especially relevant during product launches, awareness campaigns, collaborations with creators, or any initiative where visibility and new eyeballs matter.
3. Audience demographics (per platform)
Audience demographics reveal who you’re actually reaching on each platform. This includes age, gender, location, language, interests, and sometimes job titles or industries.
It tells you whether your content is attracting the audience you intend to influence.
When to make this your main KPI?
Use audience demographics as a primary KPI when relevance matters more than volume. It’s crucial during market expansion, product repositioning, and campaigns designed for very specific customer segments.
For example, if leadership wants to break into the European market, your main KPI becomes the percentage of new followers or viewers from that region.
4. Share of Voice
Share of Voice measures how much of the total industry conversation your brand owns compared to competitors.
It looks at mentions, visibility, and brand presence across social platforms.
When to make this your main KPI?
Make Share of Voice your primary KPI when leadership is focused on market dominance, brand authority, or competitive positioning. It’s especially useful during product launches, category positioning efforts, or quarters where the company wants to ‘own the conversation.’
Let’s say your company is launching a new product next quarter and management wants you to establish a strong presence before the launch. In this case, Share of Voice becomes the KPI that matters most.
5. Brand mentions
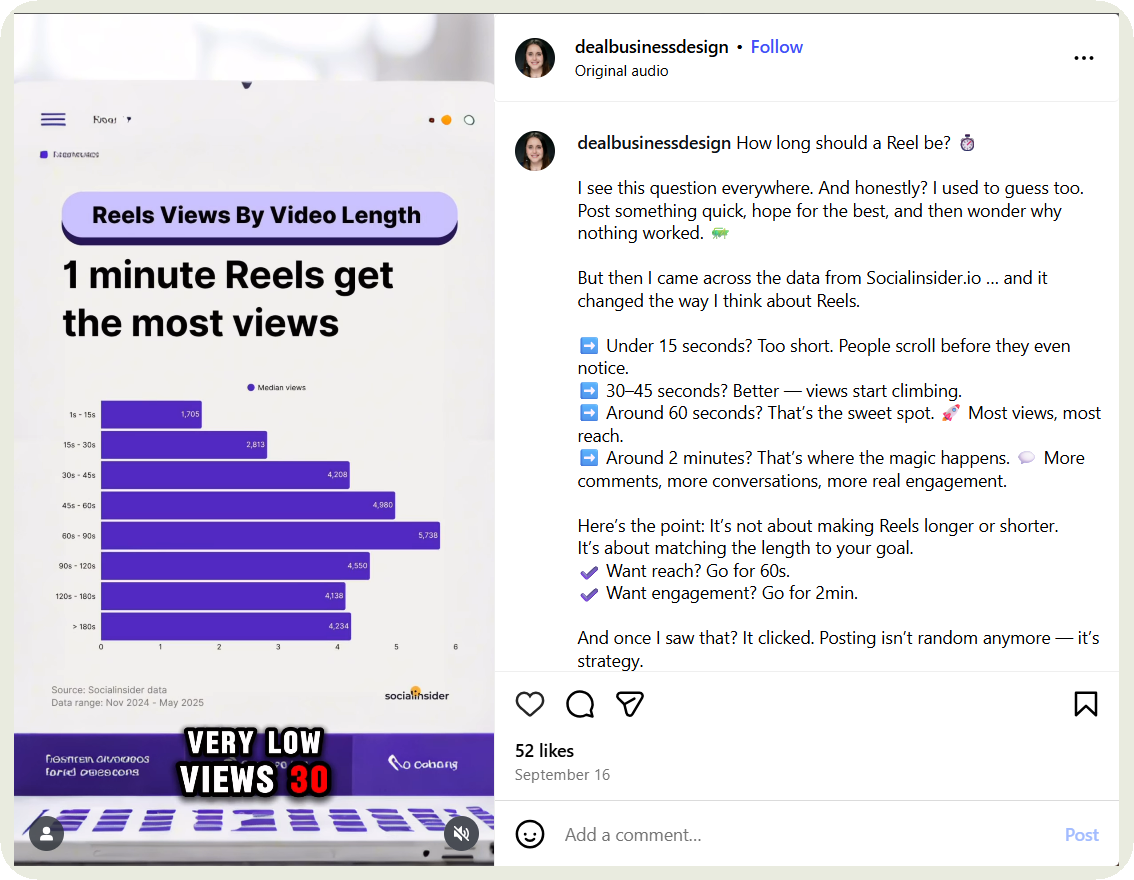
Brand mentions count how often people talk about your brand on social platforms, whether they tag you or not.
It’s a direct signal of how frequently your name pops up in conversations, trends, replies, reviews, and even casual chatter.
When to make this your main KPI?
Make brand mentions your primary KPI when your focus is increasing buzz, strengthening brand visibility, or measuring the impact of campaigns designed to spark conversation.
It’s perfect for awareness pushes, influencer partnerships, viral experiments, or moments when you want to understand how loudly the market is talking about you.
Let’s say you’re collaborating with creators for a campaign. Mentions instantly show whether people are engaging with your brand outside your own posts. If mentions spike, your creator partnerships are bringing in visibility. If not, you need to rethink on the creators or the narrative.
#6. Brand sentiment
This KPI measures how positively or negatively people talk about your brand versus how they talk about competing brands.
It looks at the tone of comments, mentions, reviews, and social conversations to reveal whether your audience feels more supportive, more frustrated, or more excited about you than the rest of the market.
When to make this your main KPI?
Use this KPI when your goal is understanding brand perception or managing reputation especially during launches or high-visibility moments.
For example, if both you and a competitor roll out updates in the same week, sentiment instantly shows whose audience is genuinely happier and whose is loudly complaining.
Engagement KPIs: is our content resonating?
Engagement KPIs for social media measure how actively people interact with your content through likes, comments, shares, saves, and replies.
They show whether your audience genuinely cares about what you’re posting rather than just scrolling past it.
In fact, a customer during one of our interactions said, “Reports for clients went down very well when we showed engagement trends. We needed to show that what we post actually performs.”
7. Engagement rate
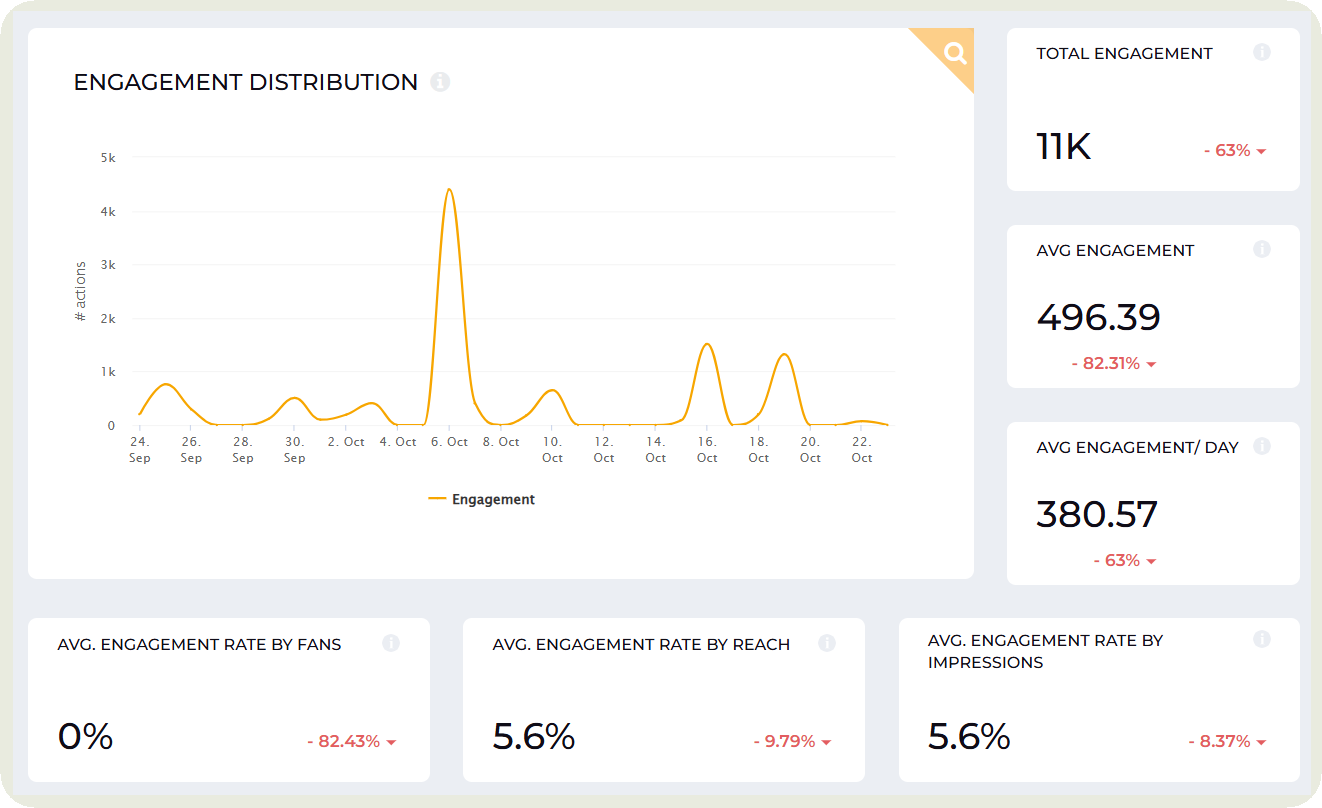
Engagement rate measures how many people interacted with your content compared to how many saw it.
I use this KPI to see if my content makes people stop, react, and participate.
When to make this your main KPI?
I make this my primary KPI when my goal is to boost content quality, build community, or understand what resonates most with your audience. I
If you are confused between different formats, tones, or types of campaign content, engagement rate becomes valuable. A strong engagement rate signals that your message is hitting the right emotional or informational notes.
8. Comments, shares, and saves
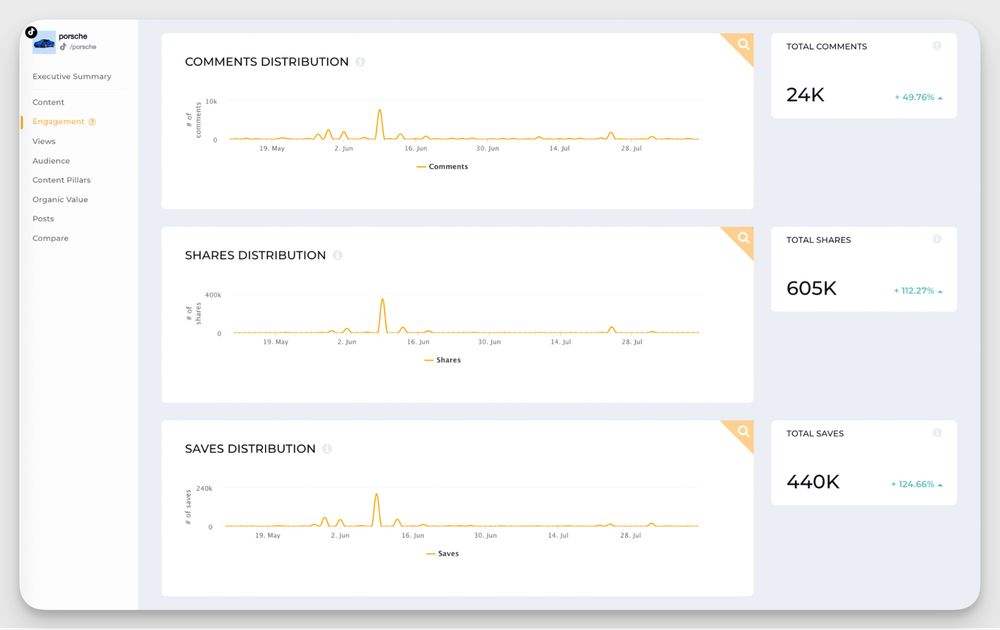
Comments show that people care enough to join the conversation. Shares reveal that your content is valuable or entertaining enough for someone to spread it to their own audience. Saves indicate long-term usefulness, signalling that the content is worth revisiting
Together, I find these signals to be a better indicator than likes.
I use Socialinsider to get the trend. If I see any sharp upticks or downfalls, I click on the graph to see the content that resulted in them.
When to make this your main KPI?
Use comments, shares, and saves as your primary KPIs when your goal is to build community, boost virality, or create content that educates, inspires, or sparks conversation.
9. Content pillar engagement
Content pillar engagement measures how your audience responds to each core theme or category in your content strategy. It shows which pillars get the most audience attention and which ones you may need to get rid of.
For example, if your ‘education’ pillar consistently pulls stronger engagement than your ‘product updates’ pillar, you know where to double down. Or what to change to make sure your product updates pillar gets increased engagement.
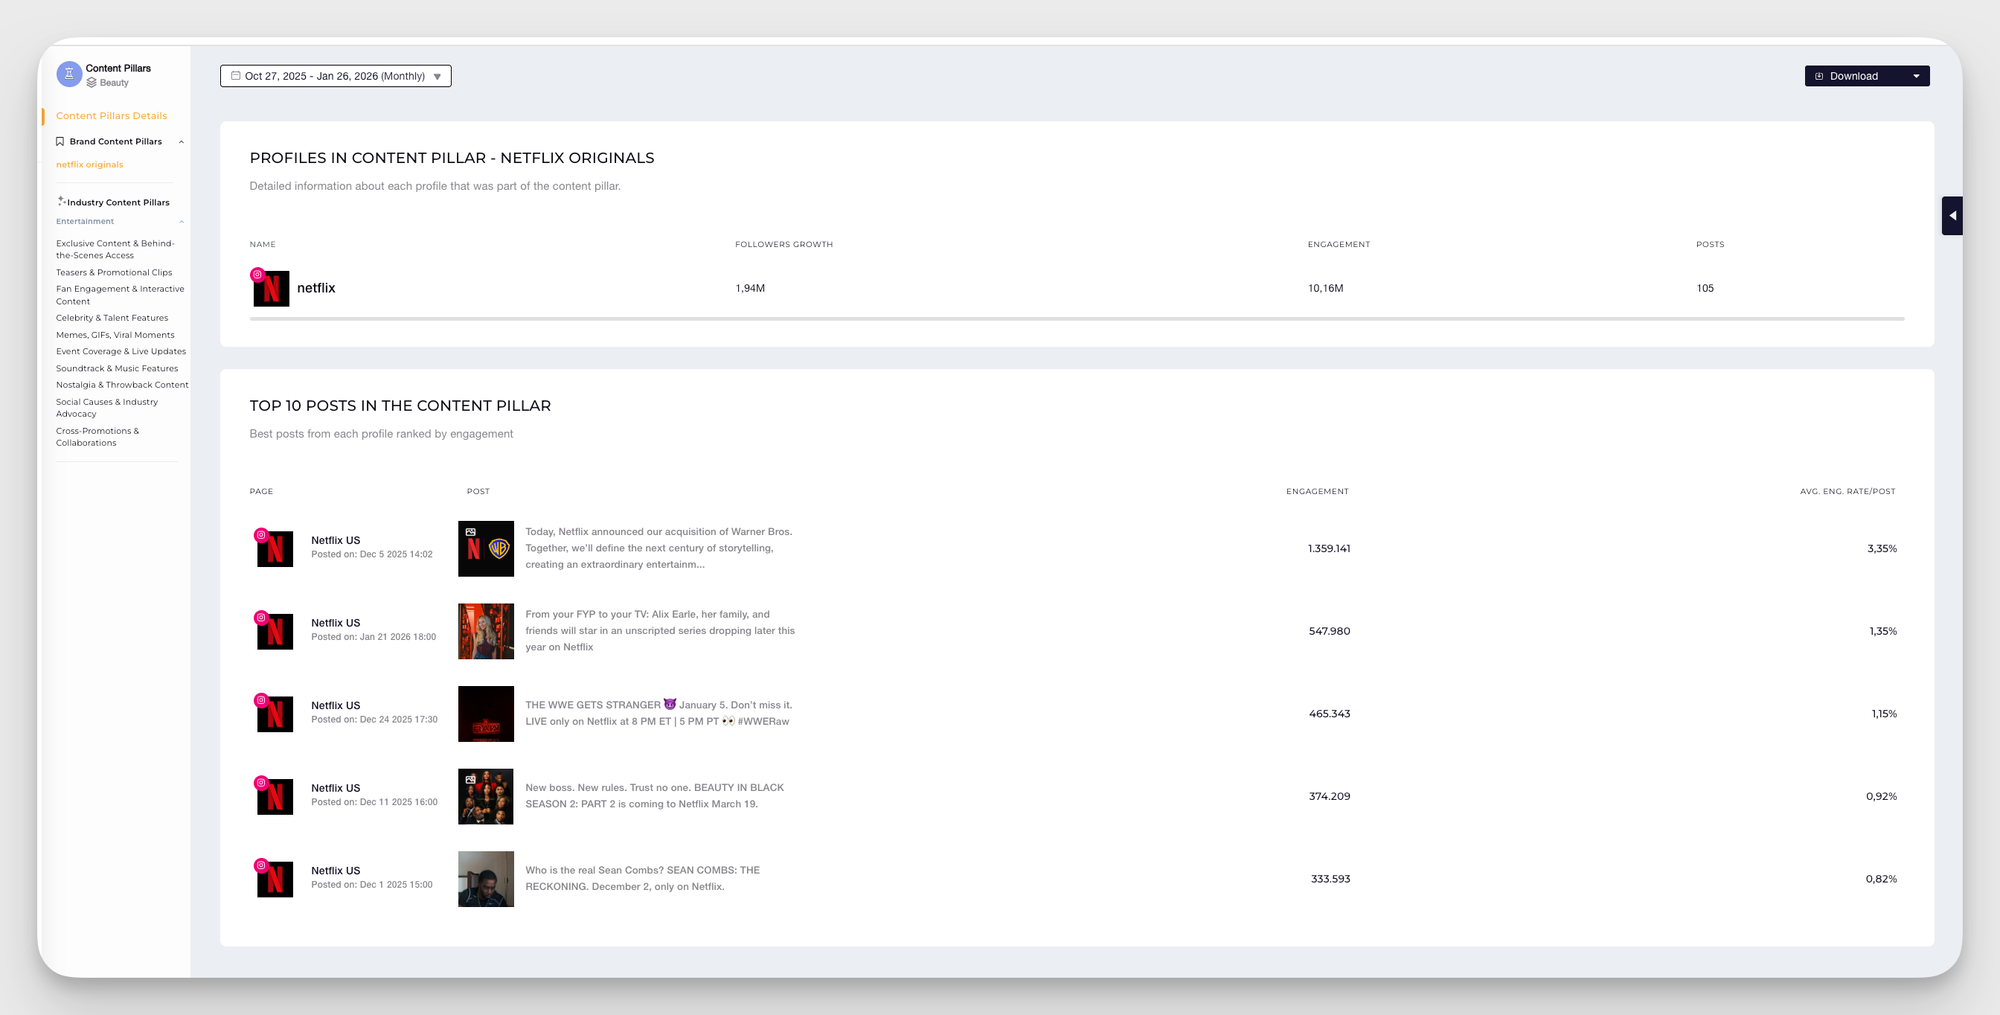
Instead of manually calculating engagement for each pillar, get it automatically on Socialinsider.
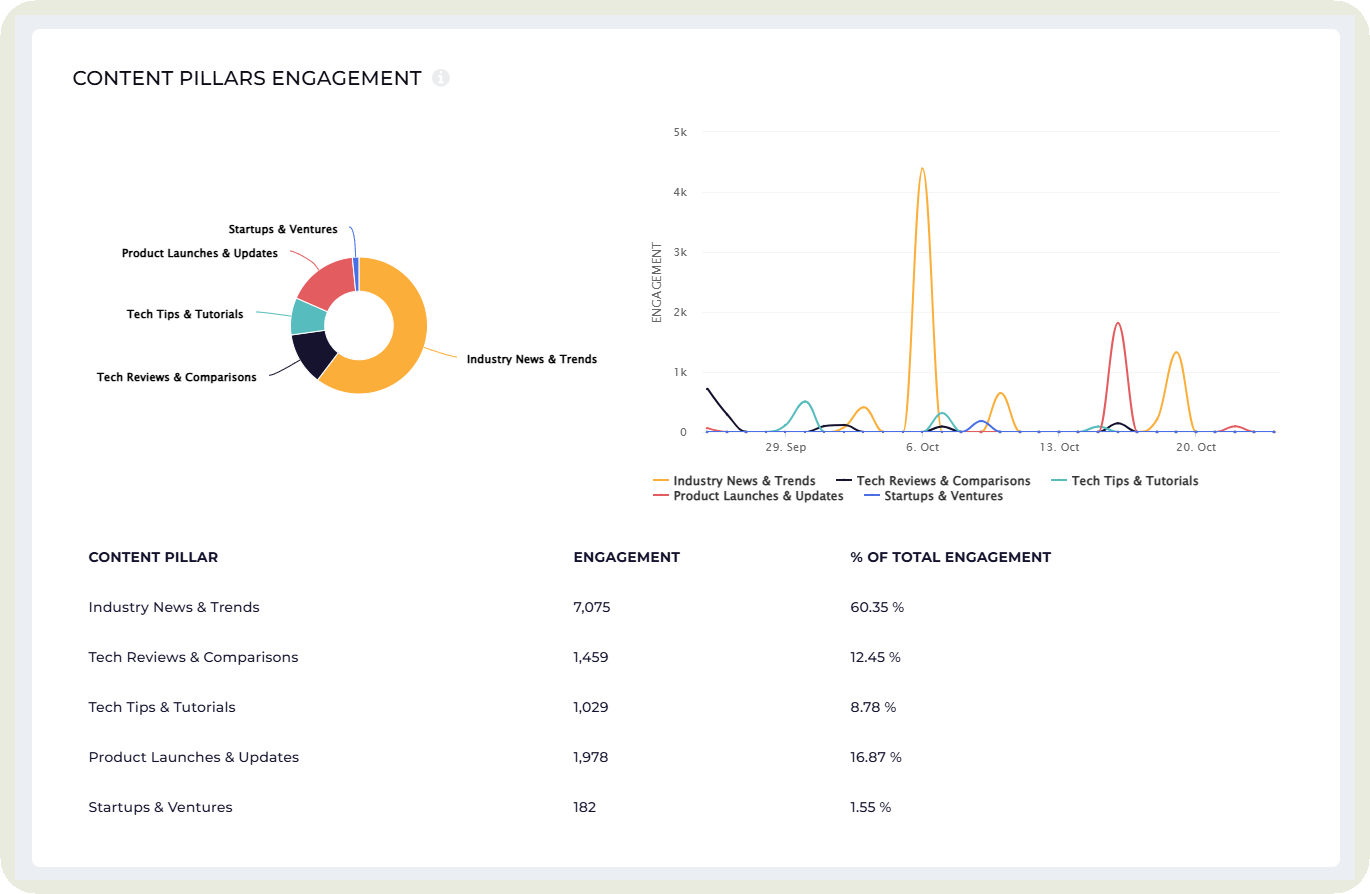
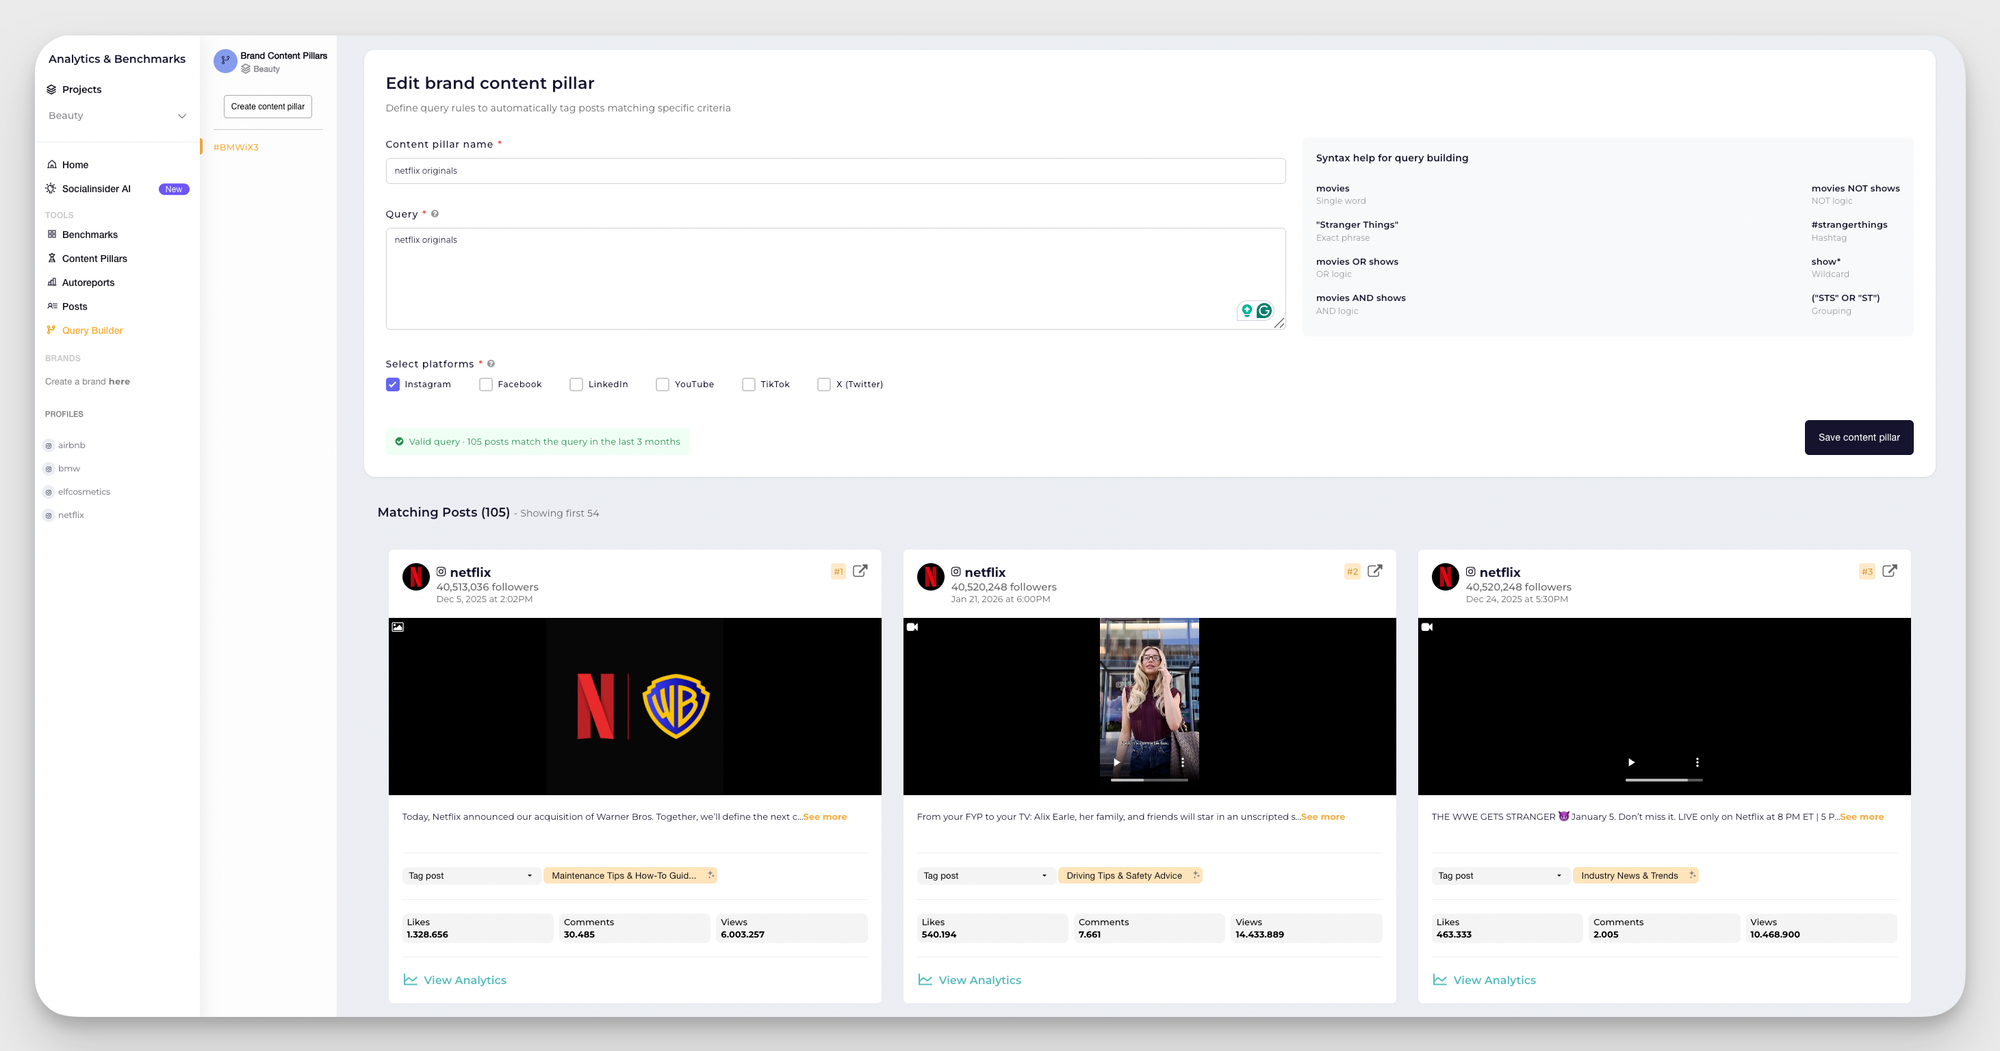
This lets you track and analyze the performance of any custom-branded content pillar.
When to make this your main KPI?
Use content pillar engagement as your primary KPI when your goal is to refine your content strategy, understand audience preferences, or allocate resources more intelligently.
It’s especially useful for brands juggling multiple topics, agencies managing diverse client stories, or teams trying to balance education, entertainment, and promotional content.
10. Click-through rate (CTR)
Click-through rate measures the percentage of people who clicked on your link after seeing your post or ad.
It shows how compelling your message, visuals, and call-to-action truly are.
CTR tells you whether your content is creating enough curiosity or intent to move people from scrolling to taking action.
When to make this your main KPI?
Use CTR as your primary KPI when your goal is driving traffic, testing hooks, or pushing audiences toward a landing page, signup form, or product page.
It’s especially valuable during campaigns where the goal is to move users deeper into the funnel.
11. Video views and watch time
Want to know if your video strategy is working well?
Video views show how many people stopped to watch your content. Watch time reveals how long they actually stayed. Together, they tell you whether your videos are capturing attention and holding it.
While views show initial interest, watch time shows genuine engagement and whether your opening few seconds did their job.
When to make this your main KPI?
If you want to check how videos perform as a format or if you can use them for different purposes, these are the right metrics to track.
High views with strong watch time mean your content is hooking people and keeping them glued.
Conversion KPIs: is social driving business outcomes?
Conversion KPIs show how effectively your social content turns interest into action.
They reveal whether people are completing the steps you want them to take, like signing up, purchasing, downloading, or filling out a form.
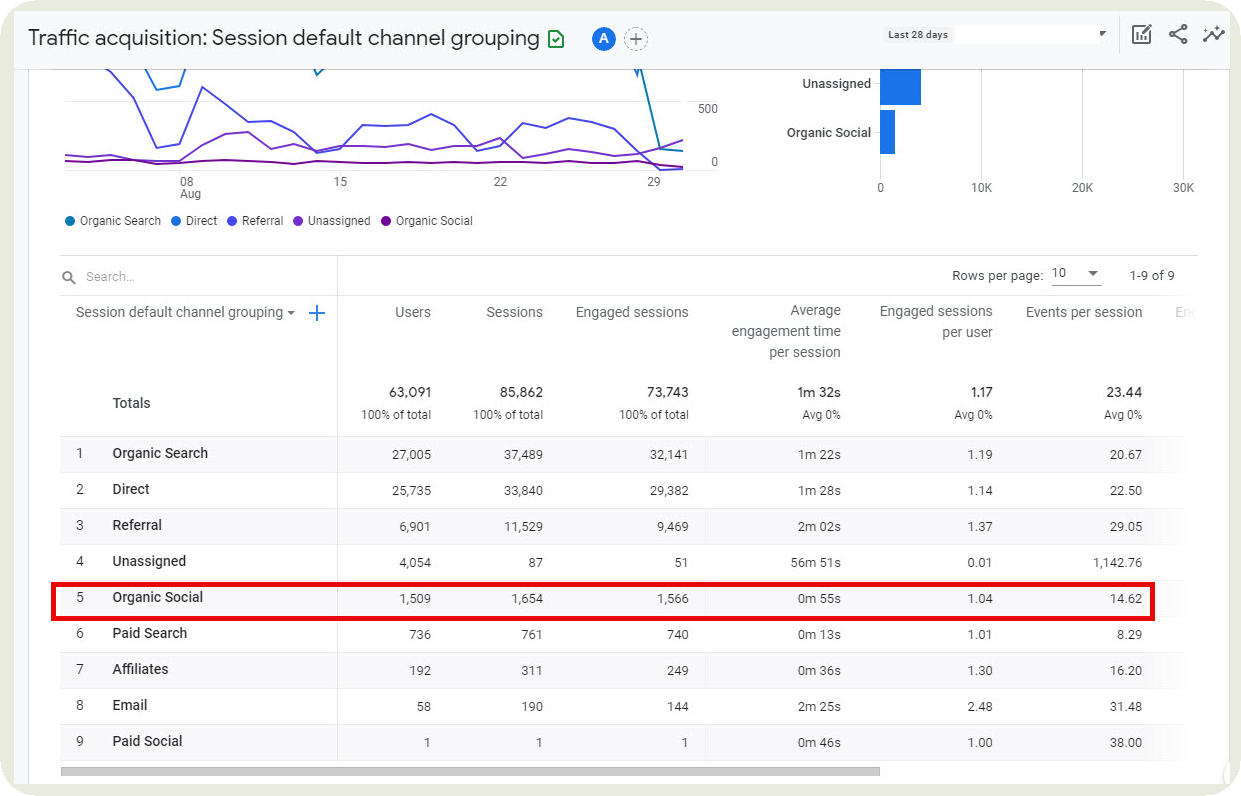
12. Traffic from social
Traffic from social measures how many people visit your website, landing pages, or product pages through your social channels.
It shows how effectively your posts, CTAs, and campaigns are pushing audiences beyond the feed and into your owned channels.
I use Google Analytics to get this data.
When to make this your main KPI?
This is the perfect KPI when your goal from social media is to drive people to your website or online store. If you are investing heavily in campaigns with that goal, you should consistently measure this metric.
13. Leads generated/Form fills
Leads generated or form fills measure how many users completed a desired action such as signing up, requesting a demo, downloading a resource, or filling out an inquiry form.
This KPI shows the precise number of people who moved from interest to intent through your social content.
When to make this your main KPI?
Use leads generated or form fills as your primary KPI when your goal is high-intent conversions.
It’s ideal for B2B funnels, gated content, webinar sign-ups, product trials, or any campaign where you need users to submit information.
I usually take a strong lead count to be an effective judge of whether my content is pulling the right audience and is compelling the audience to take meaningful action.
14. Conversion rate
Conversion rate measures the percentage of people who took the exact action you wanted after clicking through from social.
That action could be a purchase, a sign-up, a demo request, or any goal you define. It’s the clearest indicator of how well your content transforms interest into results.
When to make this your main KPI?
Make conversion rate your primary KPI when your goal is driving tangible business outcomes.
This is usually the star metric for brands focused on selling through socials or increasing product interest.
15. Revenue from social
Revenue from social tracks how much money your business earns directly from social media through tracked purchases, assisted conversions, or sales attributed to social campaigns.
It’s the most concrete proof that your social presence is driving real financial results.
When to make this your main KPI?
Use revenue from social as your primary KPI when leadership wants to tie social efforts to business impact. It’s perfect for e-commerce pushes, paid campaigns, product drops, and quarters where social media ROI needs to be crystal clear.
16. Cost per acquisition (CPA)
Cost per acquisition measures how much you spend to get one user to complete a desired action, like a purchase, signup, or demo request.
I usually use it to check the true efficiency of my social campaigns and whether my budget is being used wisely.
When to make this your main KPI?
Use CPA as your primary KPI when your goal is optimizing spend and improving the cost-efficiency of your conversions.
It’s especially important if you run a lot of paid campaigns on social media. A low CPA means your targeting, creatives, and funnel are working smoothly. A high CPA tells you it’s time to rethink your approach before the budget burns.
17. Return on ad spend (ROAS)
Return on ad spend measures how much revenue you earn for every dollar spent on ads.
It tells you how effectively your paid social campaigns are turning budget into real financial returns.
When to make this your main KPI?
Use ROAS as your primary KPI when your goal is maximizing profitability from paid campaigns.
It’s essential during product launches, retargeting efforts, seasonal promos, and any moment when leadership wants to see direct monetary impact.
A strong ROAS shows that your ads are pulling their weight. A weak one tells you the budget needs a new strategy fast.
How to use competitors’ KPIs to set achievable social goals?
Benchmarking isn’t just about knowing where you stand; it’s about transforming competitive insights into realistic, data-driven social media goals. By analyzing competitors’ KPIs side-by-side with your own, you define performance targets that are informed by real-world results—not guesswork.
Why benchmark competitor KPIs?
- Anchor your KPIs: Benchmarks let you see if your engagement, reach, or growth is truly strong—or just average for your industry. This context transforms isolated data points into valuable insights.
- Give context to your numbers: Without a benchmark, a 2% engagement rate might seem impressive or disappointing. By comparing to competitors, you learn if you’re outperforming, keeping pace, or falling behind.
- Set achievable, data-driven objectives: Instead of arbitrary targets, aim to match or exceed the benchmarks set by leading brands in your space. Benchmarks show what’s possible and help you set realistic, motivating goals.
How Socialinsider can help you with competitor KPIs tracking?
Benchmarking competitor KPIs transforms raw data into strategic next steps. Here’s how to put your competitive analysis into action—using Socialinsider’s benchmarking feature—to set goals you can confidently pursue:
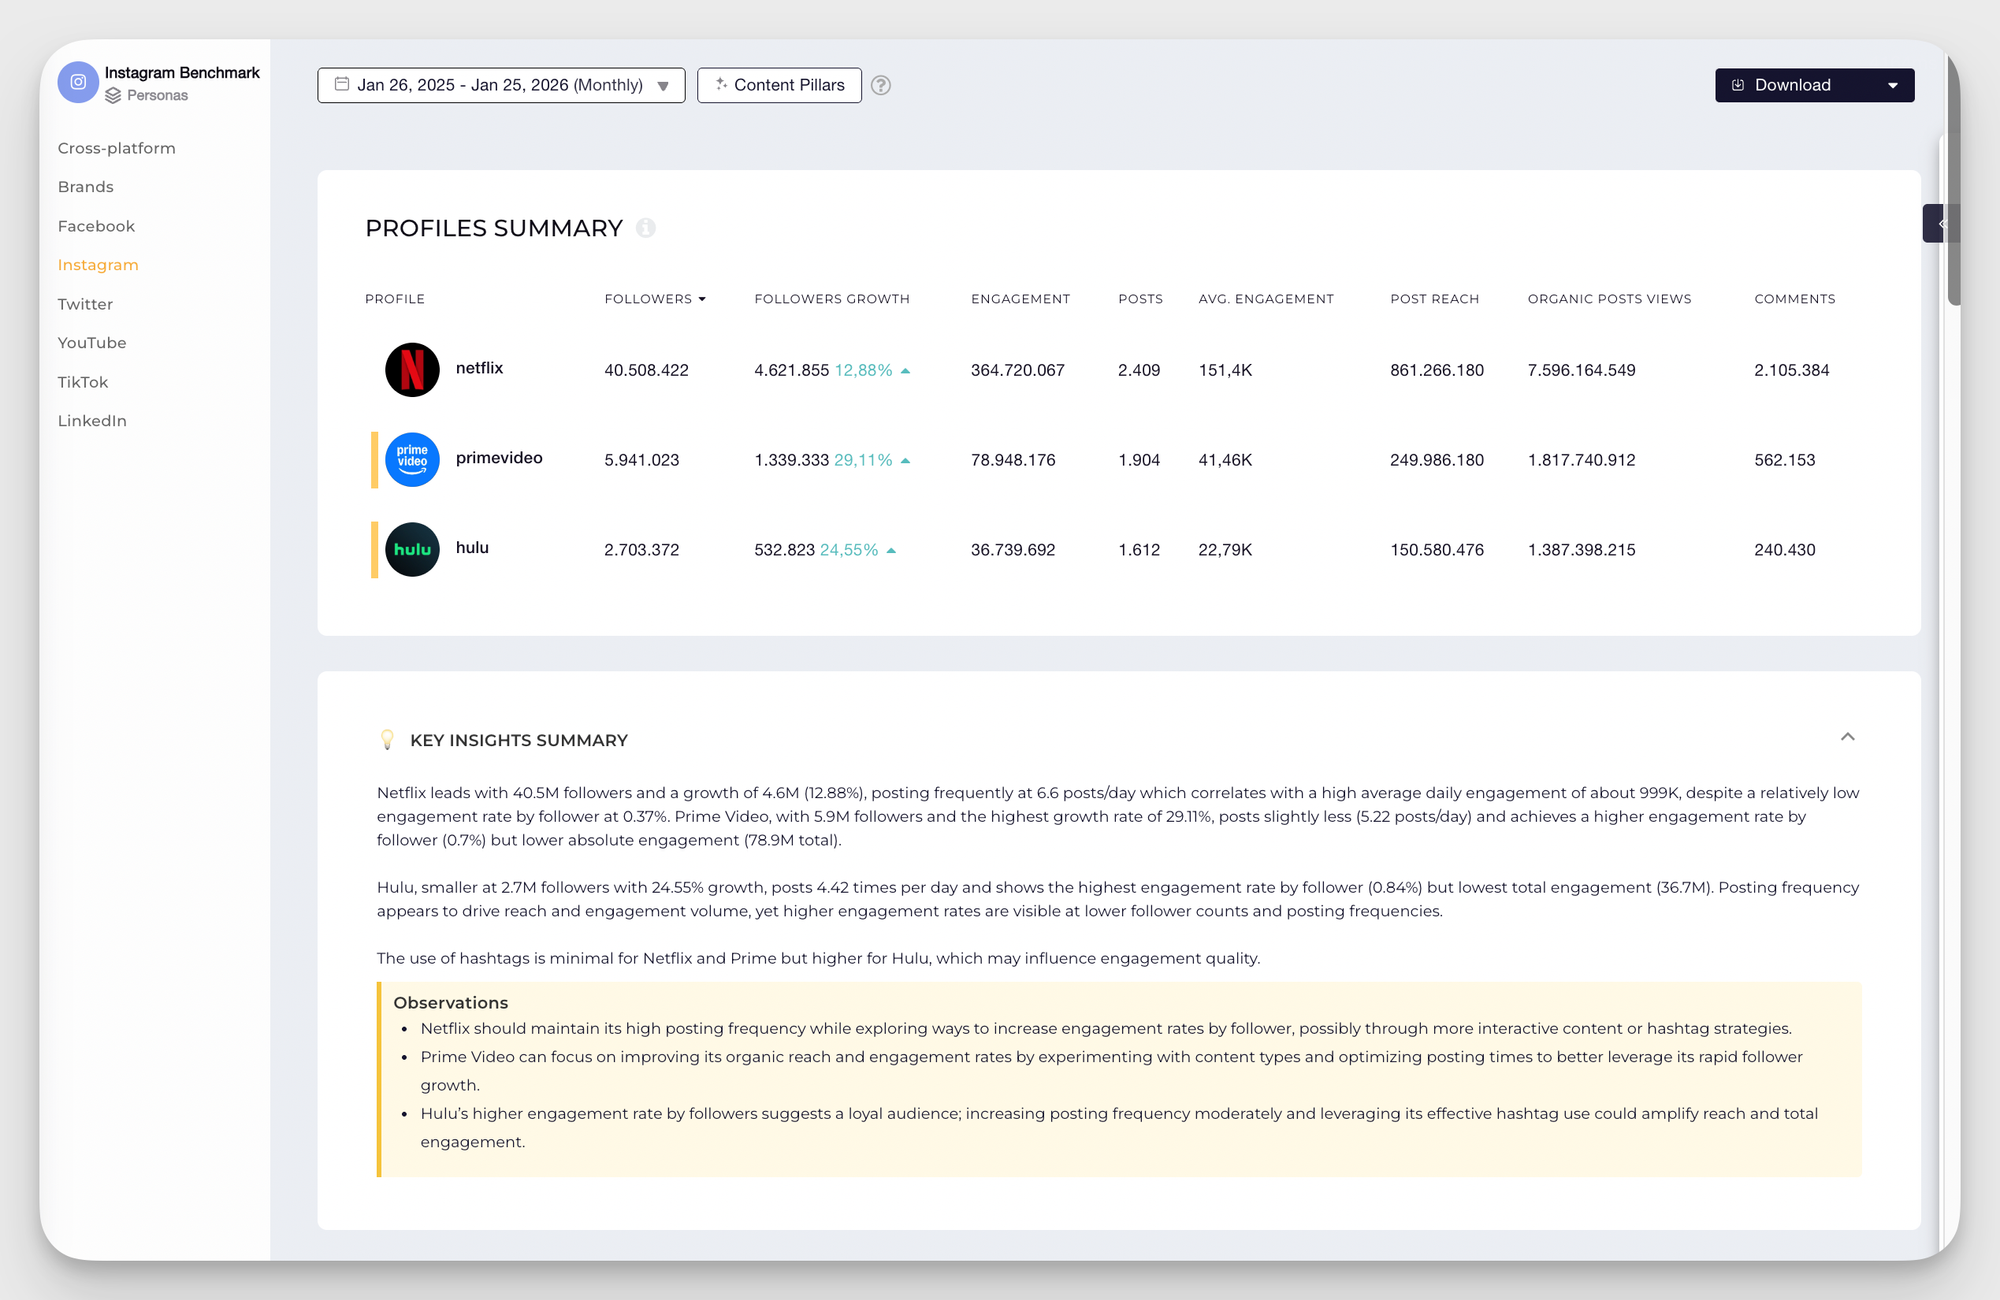
- Follower growth: Track and compare how quickly your audience is expanding relative to competitors and industry averages. Benchmarking follower growth shows whether your brand’s visibility and magnetic appeal are accelerating or lagging behind others in your niche.
- Engagement rate: Don’t settle for comparing your engagement rate only to your own historical performance. Benchmark your audience's interaction level against direct competitors to find out if your audience is more or less engaged than others in your space.
- Comments and shares: The quality of engagement can matter as much as the quantity. Benchmarking comment or shares volume reveals whether your posts spark genuine conversation, or if there’s an opportunity to drive deeper interaction.
- Views & reach: Raw view counts and reach statistics are most useful when seen in context. With Socialinsider, you can benchmark your video views, impressions, and overall reach against similar brands or top performers. This shows you whether your content is effectively capturing audience attention and if your awareness campaigns are really gaining traction. If competitors are consistently achieving broader reach, use this insight to re-evaluate your content formats, posting times, or promotional tactics.
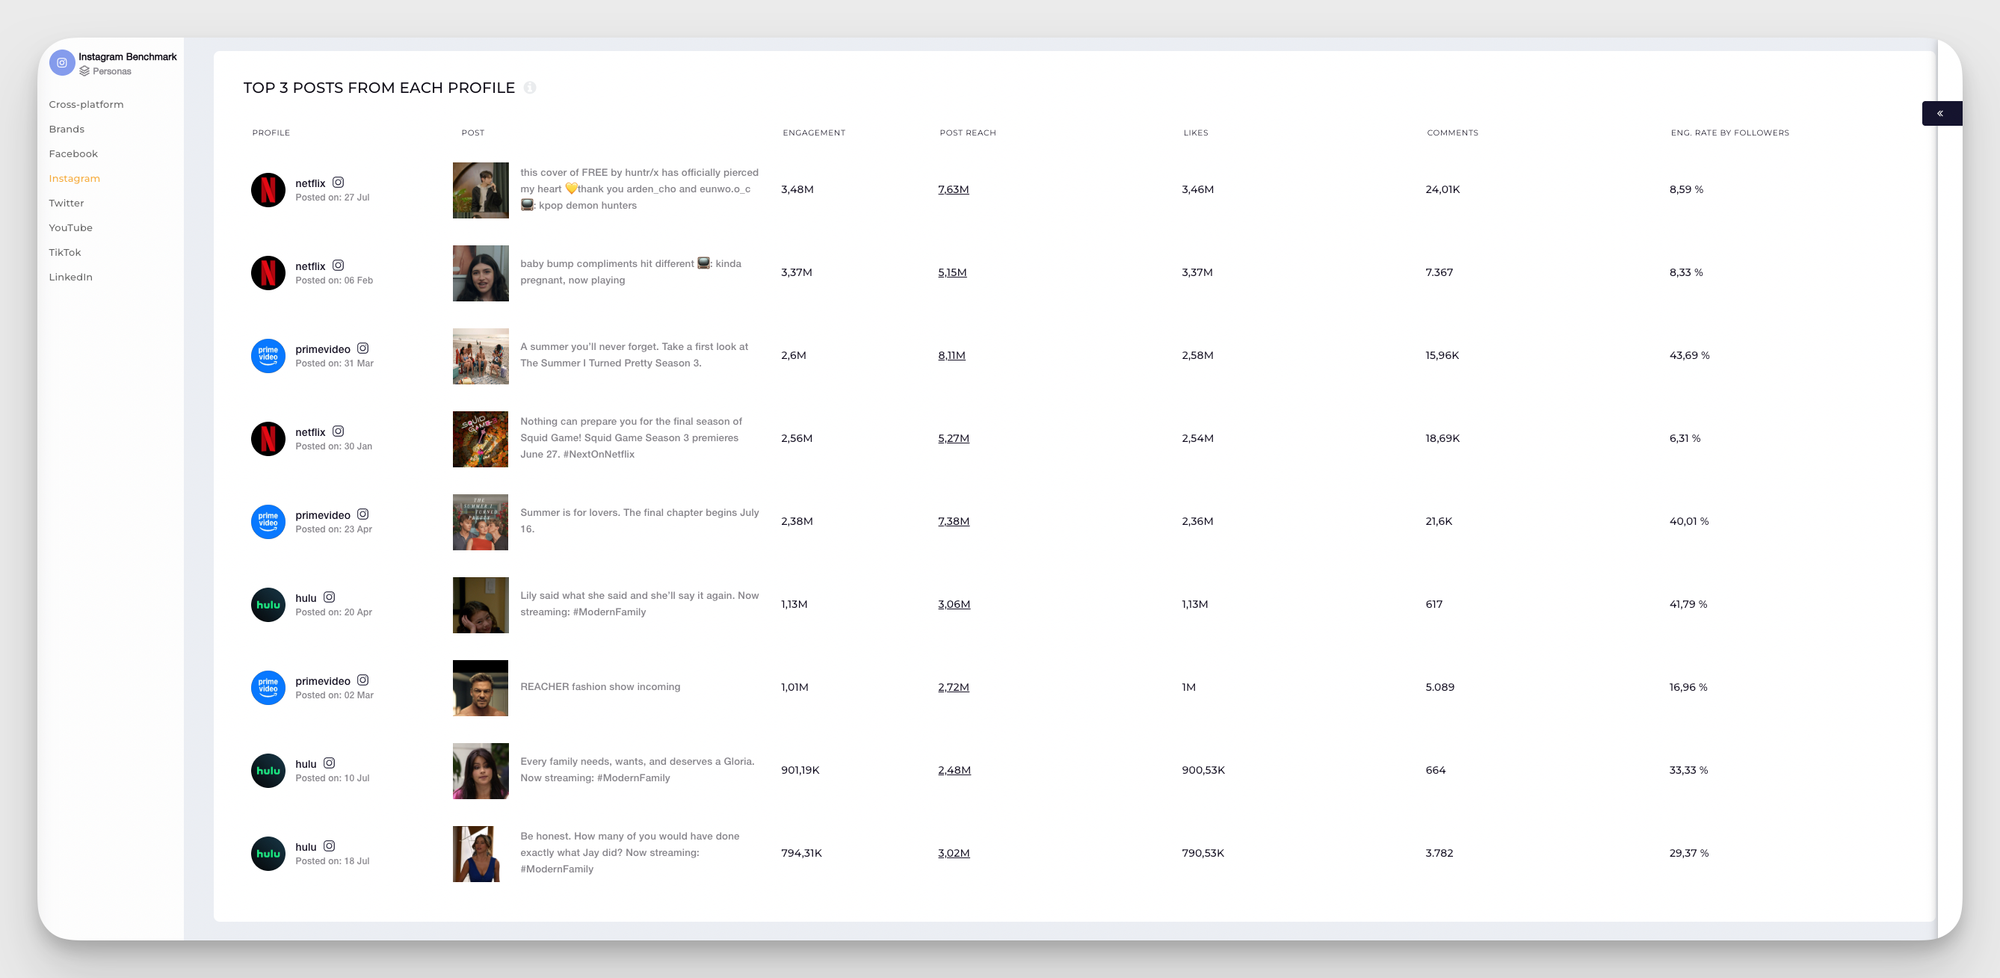
- Content pillars: Beyond the metrics, look at what works: Benchmark which specific topics, themes, or formats are driving top results in your industry.

Socialinsider enables you to analyze your content mix alongside competitors—do leaders in your space succeed with how-to guides, behind-the-scenes, or industry news? This analysis can reveal untapped opportunities or validate a shift in your own strategy. Prioritize or pivot your content pillars based on real-world engagement data.
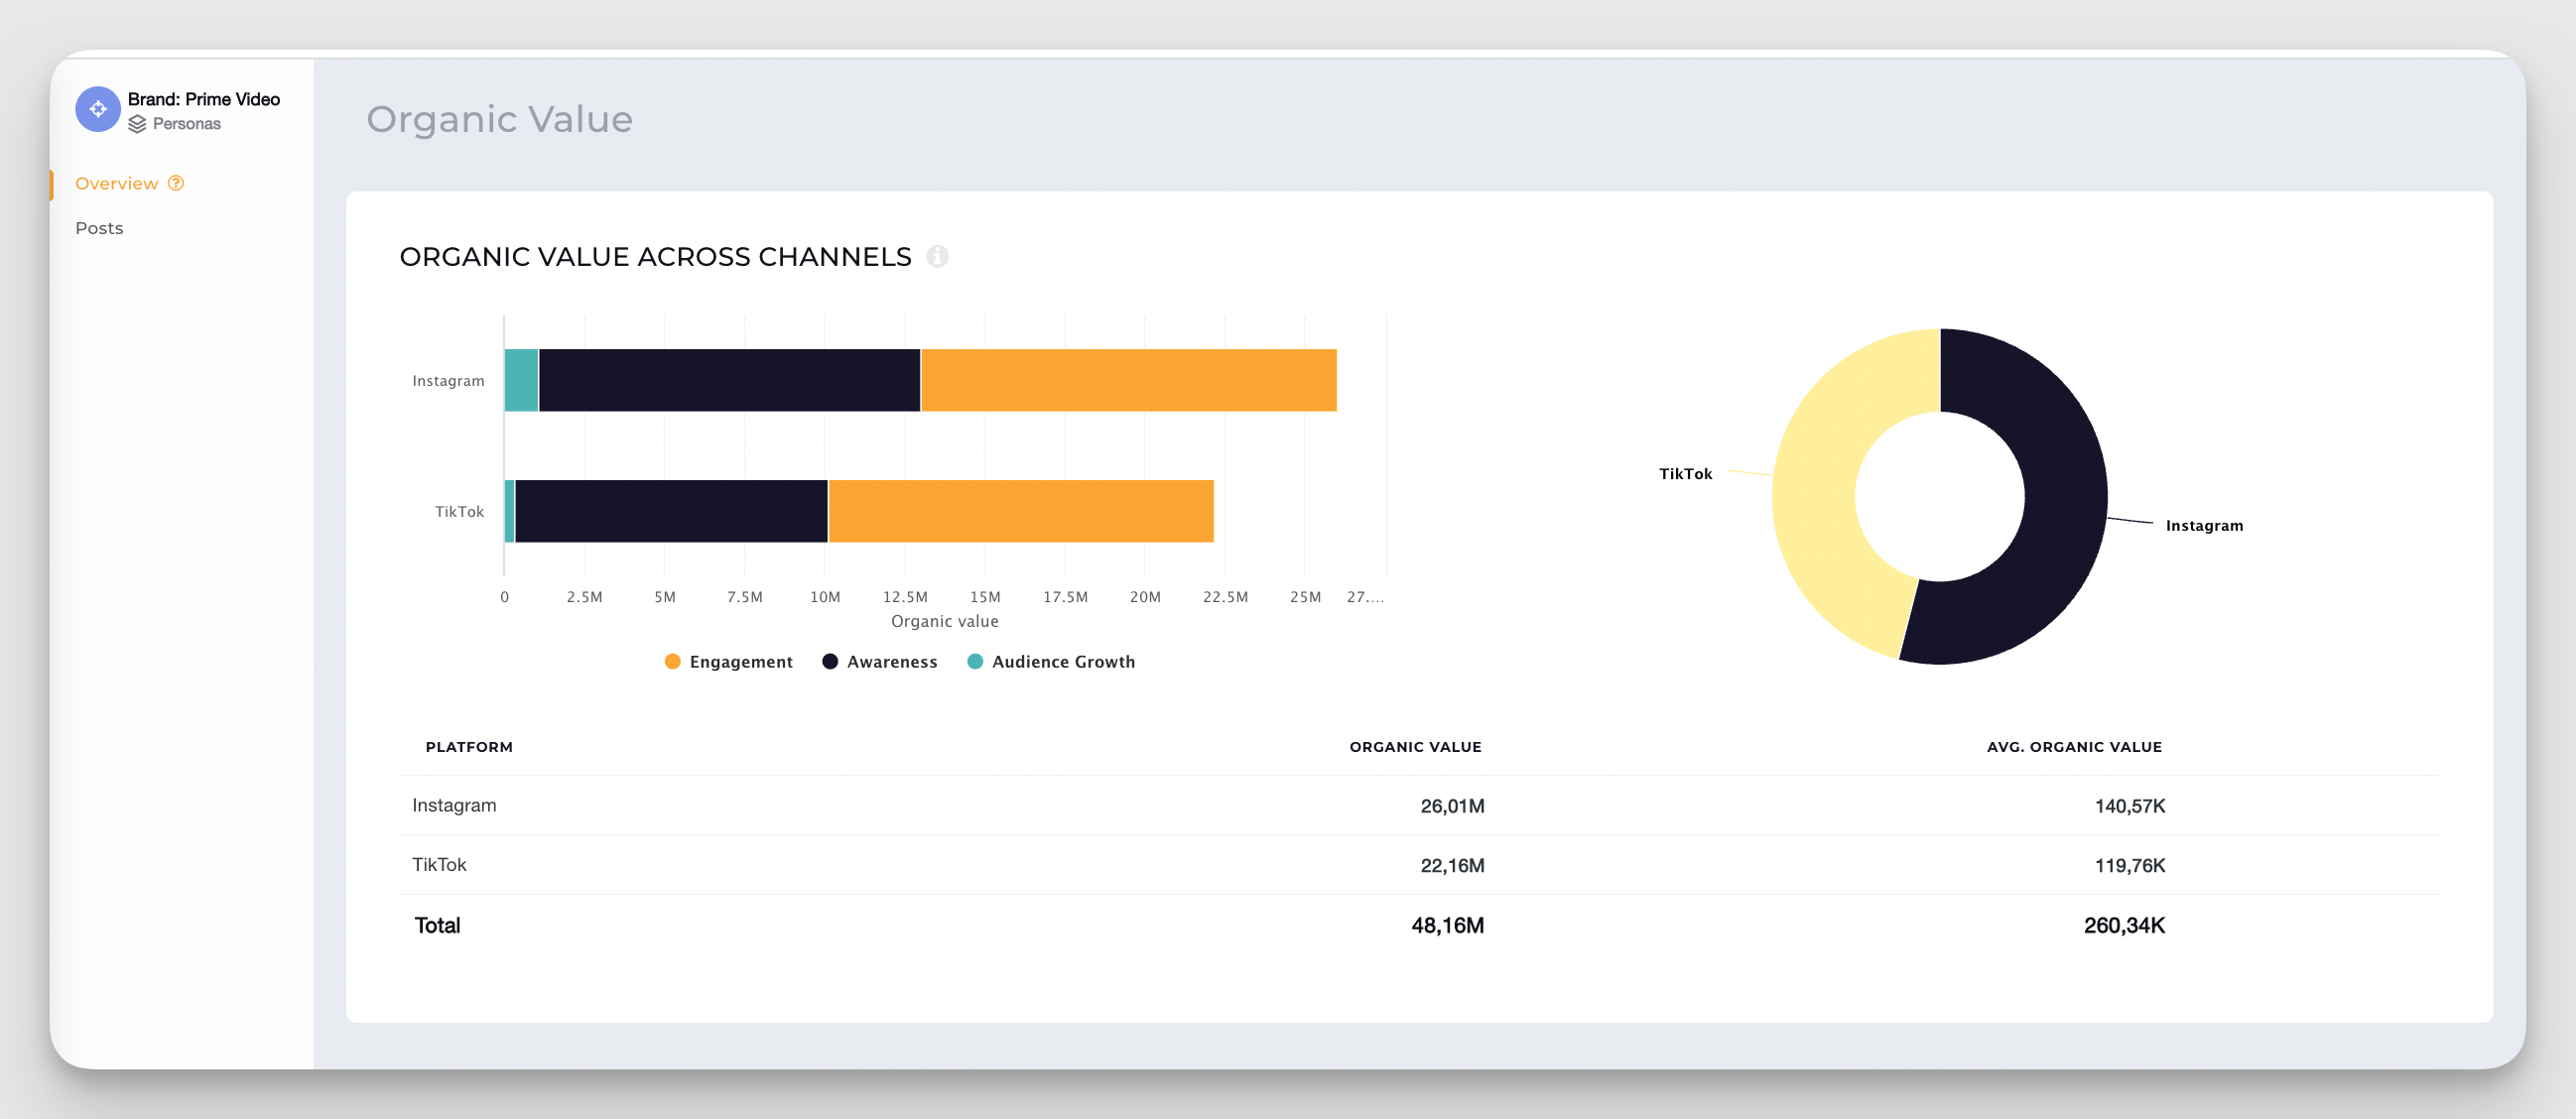
- Organic value: Quantify the true value of your organic (unpaid) reach compared to the competition. Benchmarking your organic engagement and reach highlights whether your brand story is spreading naturally—or if you’re too reliant on paid promotion. Socialinsider automatically calculates this metric, so you can see where your organic efforts excel and where there’s room to improve. Use it to demonstrate ROI to stakeholders or to justify investing in new creative campaigns.
How to report and visualize KPIs?
Once you have finalized your social media marketing KPIs and how you calculate them, you also need to work on how you present them to stakeholders. Here are four best practices that will help you.
Show progress on KPIs with trendline and charts
Ever stared at a wall of numbers and felt your brain shut down? Now imagine your VP doing the same during your presentation. This is why your KPIs need visuals.
Trendlines, charts, and simple graphs turn raw data into something people can instantly understand.
Say you're showing follower growth. A single line chart that climbs steadily tells the story faster than five bullet points ever will.
Or if engagement spikes after a new content pillar launch, a before-and-after bar chart makes the win impossible to miss.
You can either manually create these charts or use third-party analytics tools like Socialinsider to get them instantly.
Create a proper structure for your KPI report
You don’t want your clients or stakeholders to spend the first half an hour just understanding what details are where in your report.
Instead, start with an executive summary so readers know the highlights. Then move into goal-based KPIs, followed by platform-specific performance, and wrap with insights and next steps. For example, if your main goal is lead generation, put conversions, CPL, and form fills right at the top. Don’t bury the headline.
Use dashboards for real-time updates
Ever had someone ask, “Do we have the latest numbers?” right after you’ve sent the report?
That’s where real-time dashboards save you. They update automatically, so your KPIs stay fresh without you recreating the same charts every week.
A dashboard lets leadership check performance anytime. I generally share Socialinsider’s customizable dashboard for this.
If engagement spikes after a new Reel drops, they can see it instantly. If traffic dips mid-campaign, the team can adjust before the week ends.
Try to assign monetary value when possible
The more you can try to showcase your results in monetary terms, the stronger your case will be.
For example, instead of saying, “Social media is bringing us results”, I showcase the organic value of social media in monetary terms.
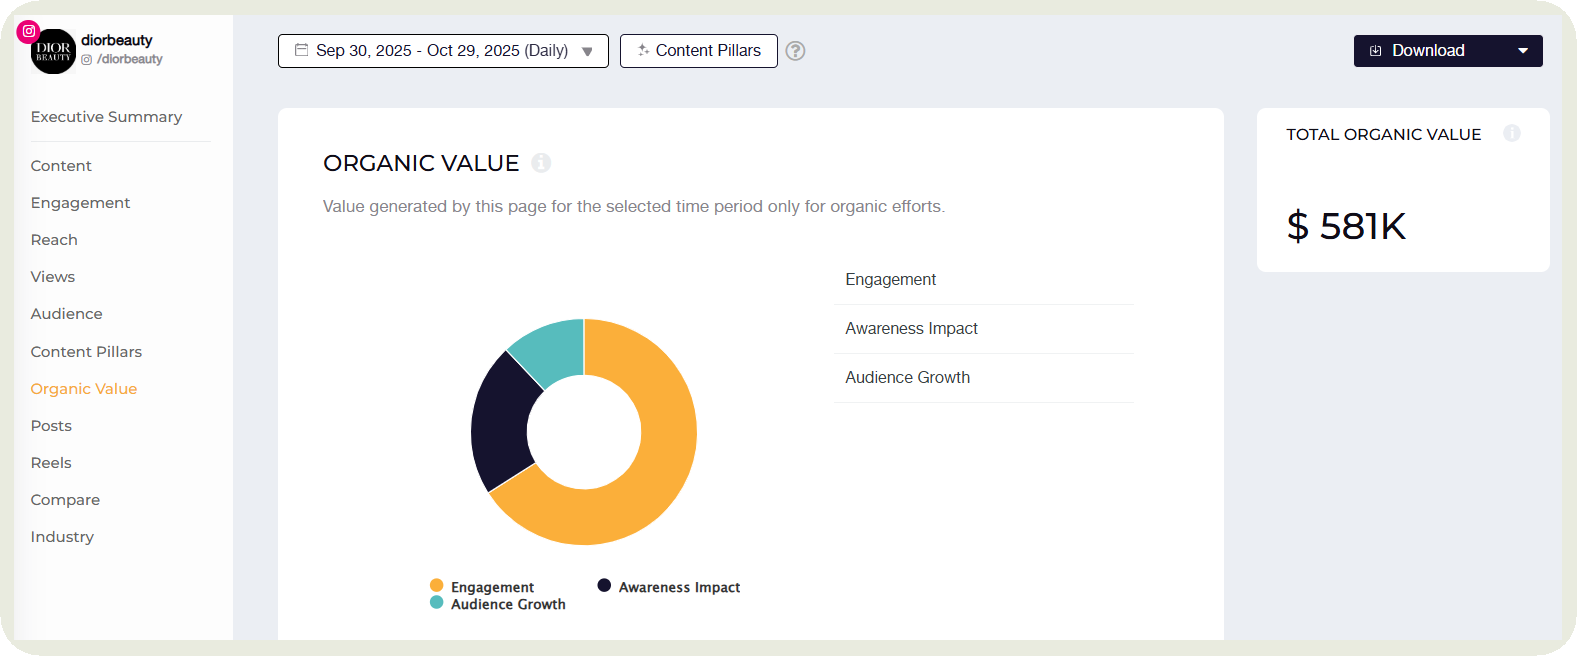
This helps me justify the value of social media and the investment we put in it.
Common mistakes to avoid when tracking social media KPIs
Here are three mistakes we often see marketers make while tracking KPIs.
- Over-indexing on short-term wins: It’s easy to pick KPIs that deliver quick wins, especially in a new role or during a launch. But short-term spikes can distract from real impact. A post might get huge reach, yet barely any engagement. That number looks great on paper, but it doesn’t mean much. Always dig deeper and choose KPIs that support long-term success, not just instant results.
- Not adding context to each KPI: Add a quick line on trend, comparison, or impact so every KPI tells a clear story. Saying “engagement rate is 3.2%” means nothing unless you explain whether it’s up, down, or better than competitors. Readers shouldn’t have to guess what the number implies.
- Not complementing with qualitative KPIs: Relying only on numbers gives you half the picture. Without qualitative signals (comments, DMs, sentiment, user feedback) you miss the story behind the data. A spike in engagement might look great, but the comments could be overwhelmingly negative. Pair the numbers with human insight to understand the full reality.
Final thoughts
Tracking social media KPIs can be one of the most important things you do to improve your strategy on a regular basis.
The easiest way to set strong social media KPIs is to treat it like a repeatable workflow. Start by anchoring everything in your goals, then map each KPI to the stage of the customer journey it supports. From there, bring leadership into the process so your KPIs match the company’s priorities, not just your content plan.
And if you want consistent KPI tracking with real-time data and clean dashboards, get your Socialinsider’s 14-day free trial today.
Analyze your competitors in seconds
Track & analyze your competitors and get top social media metrics and more!
You might also like
Improve your social media strategy with Socialinsider!
Use in-depth data to measure your social accounts’ performance, analyze competitors, and gain insights to improve your strategy.


