Beyond Metrics: Social Media Reports That Drive Business Decisions
Through a comprehensive social media report, you can understand the effectiveness of your social media strategy, and identify your weaknesses.


In today’s digital landscape, social media isn’t just about posting content—it’s about measuring impact and driving business results. Social media reporting transforms scattered data points into meaningful insights that guide strategy and demonstrate value. Whether you’re managing accounts for a global brand or a local business, effective reporting separates successful social media professionals from the rest.
But what makes a truly effective social media report? And how can you create one that doesn’t just present numbers but tells a compelling story about your brand’s performance?
The difference between mediocre and outstanding social media management often lies not in the content creation itself, but in how meticulously performance is tracked, analyzed, and optimized. Platforms like Socialinsider help businesses transform complex social data into actionable reports, making it possible to connect social media activities directly to business outcomes.
Whether you’re looking to justify your social media budget, optimize your content strategy, or simply understand what’s working and what isn’t, this guide will equip you with the knowledge and tools to make data-driven decisions that drive real business impact.
Key takeaways
-
Context is crucial - Raw data without background explanations, benchmarks, and strategic context leads to misinterpretation and poor decision-making
-
Focus on business-aligned metrics - Move beyond vanity metrics like follower counts to track conversions, ROI, and metrics that directly support business objectives
-
Implement the 50/30/20 content rule - Balance value-driven content (50%), shared community content (30%), and promotional content (20%) for optimal engagement
-
Tailor reports to your audience - Executives need high-level ROI and growth metrics, while marketing teams require detailed platform breakdowns and content performance analysis
-
Automate for efficiency and consistency - Use tools like Socialinsider to streamline data collection, generate recurring reports, and maintain consistent reporting schedules
-
Include competitive benchmarking - Compare your performance against industry peers to set realistic goals and identify opportunities for improvement
-
Segment your data - Avoid generic analysis by breaking down performance by audience segments, content types, and campaign objectives
-
Prepare for crisis reporting - Have systems in place to document incidents in real-time with timelines, screenshots, and sentiment analysis for post-crisis learning
What is a social media report?
A social media report is a structured document that collects, organizes, and analyzes data from your social media activities across platforms to evaluate performance against specific goals and KPIs. More than just a collection of metrics, an effective social media report transforms raw numbers into meaningful insights that inform strategy and demonstrate value to stakeholders.
Key components every social media report should include
The most effective social media reports share several essential elements:
- Executive Summary: A concise overview highlighting key findings, achievements, and areas for improvement.
- Performance Metrics: Quantifiable measurements that track progress toward specific goals, such as engagement rate, follower growth, and conversion metrics.
- Content Analysis: Evaluation of which content types, formats, and topics performed best during the reporting period.
- Audience Insights: Demographics, behavior patterns, and preference trends of your social media audience.
- Competitive Benchmarking: Comparison of your performance against industry peers or direct competitors.
- Platform-Specific Breakdowns: Segmented analysis by social platform, recognizing the unique metrics and performance indicators for each.
- Recommendations and Next Steps: Data-backed suggestions for optimizing future strategy based on the report’s findings.
- Visual Elements: Charts, graphs, and other visualizations that make complex data easily digestible.
Different types of social media reports
Depending on your goals and reporting needs, you might create various types of reports:
1. Weekly Reports focus on immediate performance indicators and short-term trends. These brief, tactical reports help teams stay agile and make quick adjustments to content strategy or posting cadence. They’re ideal for campaign monitoring or when testing new approaches.
2. Monthly Reports provide a more comprehensive overview, revealing patterns that might not be apparent in weekly snapshots. These reports typically include deeper audience analysis and more detailed performance breakdowns by content type, posting time, or campaign.
3. Quarterly Reports take a strategic view, analyzing longer-term trends and progress toward annual goals. These often include competitive analysis and broader business impact metrics, making them valuable for strategic planning and budget allocation discussions.
4. Campaign-Specific Reports evaluate the performance of particular initiatives from start to finish, measuring outcomes against campaign-specific objectives. These reports help determine ROI for specific investments and inform future campaign strategies.
The right reporting cadence for your organization depends on your team’s needs, stakeholder expectations, and the pace at which your social strategy evolves. Many teams find value in creating reports at multiple intervals—weekly for tactical adjustments, monthly for trend identification, and quarterly for strategic evaluation.
By tailoring your report’s structure, components, and frequency to your specific goals, you transform reporting from a mundane obligation into a powerful tool for continuous improvement and demonstrable business impact.
Streamline data gathering & analysis
Go beyond superficial engagement numbers. Transform raw data into strategic insights that drive real business value.
Start a 14-day FREE trialThe business value of social media reporting
Social media marketing reports aren’t about pretty graphs or follower counts. They’re about turning data into insights that show how your social media efforts contribute to the business’s bottom line.
Here are the different ways social media reporting helps drive business value:
ROI measurement and justification
With proper tracking, you can attribute revenue impact to specific channels, campaigns, or even individual posts, proving that social drives sales, not just impressions or likes.
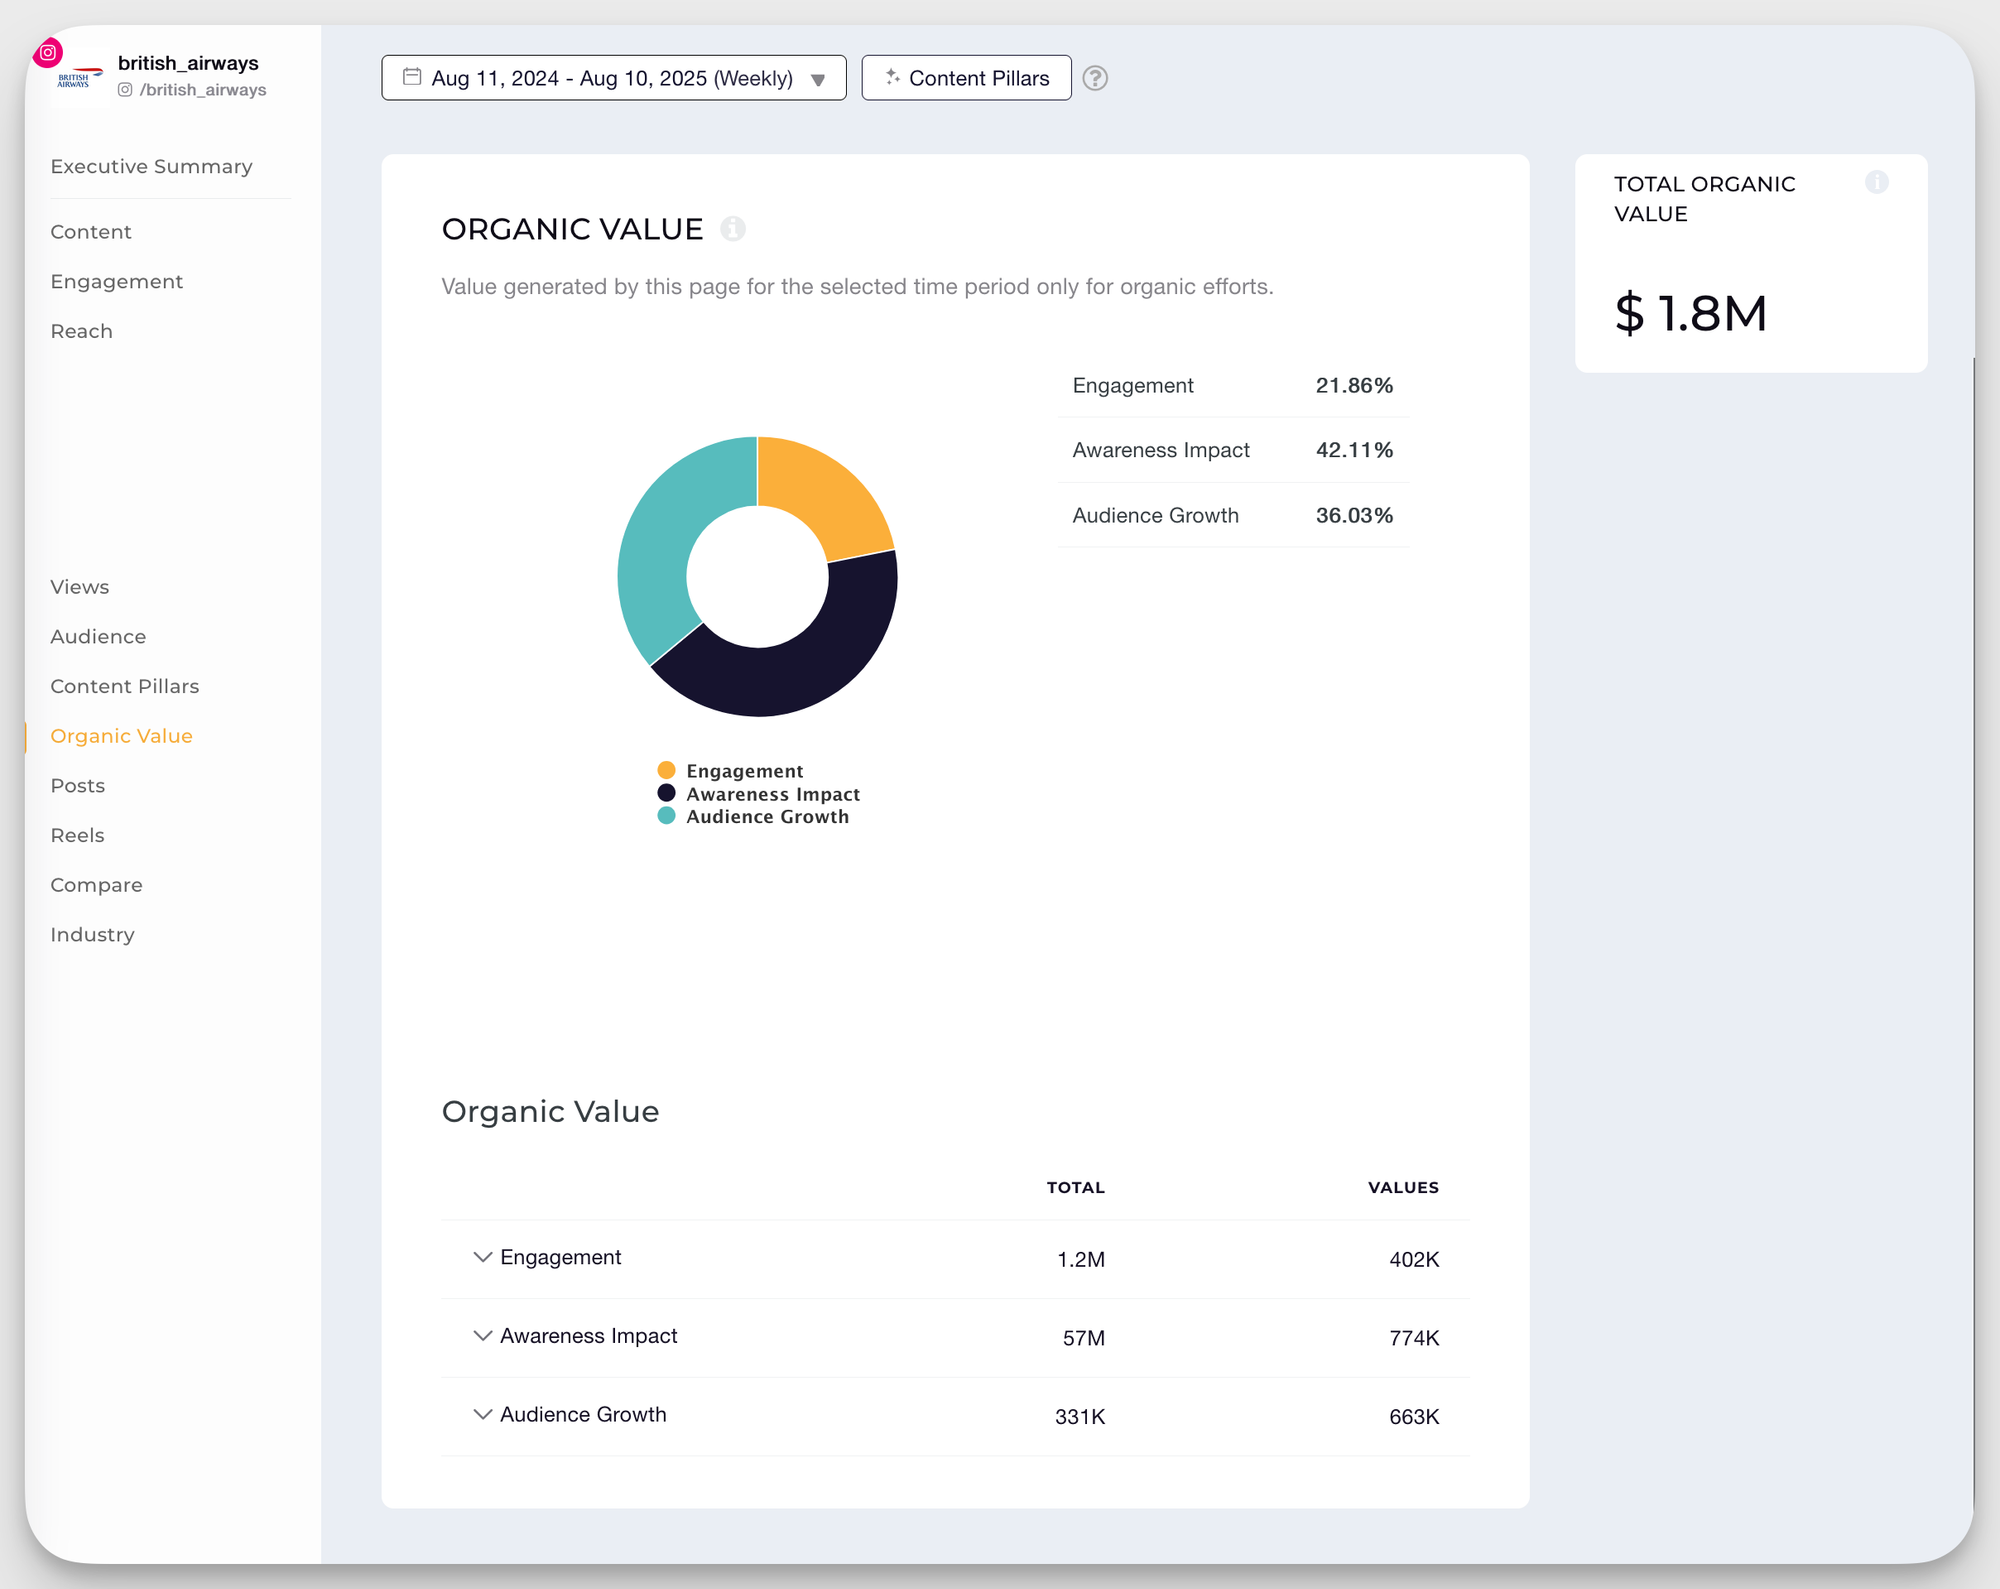
One of the biggest struggles social media managers face is answering the question, “What’s the ROI of our social strategy?” Until now.
With Socialinsider’s Organic Value feature, answering that question just became a breeze; you can finally put a dollar amount on your organic efforts. This feature estimates the monetary worth of your non-paid social content by factoring in engagement, awareness, audience growth metrics, and industry-standard CPM (basically, the Organic Value calculator determines how much money you should have invested in paid ads to get the same results as your organic content). This way, you can show stakeholders exactly how much value your organic strategy generates—bridging the gap between performance reports and tangible business impact, even before you tap into paid campaigns.
Performance tracking and growth measurement
Regular performance reporting shows whether your brand is growing, stagnating, or declining over time–and why. You can then use the insights to continuously refine your content strategy, improve audience targeting, and test new formats.
Strategic decision-making based on social data
With the available social data, you can answer big questions like:
- Are Instagram Stories driving more traffic to your website than Facebook Ads?
- Are videos generating more engagement than static images?
- Is your competitor’s engagement outpacing yours in a key demographic?
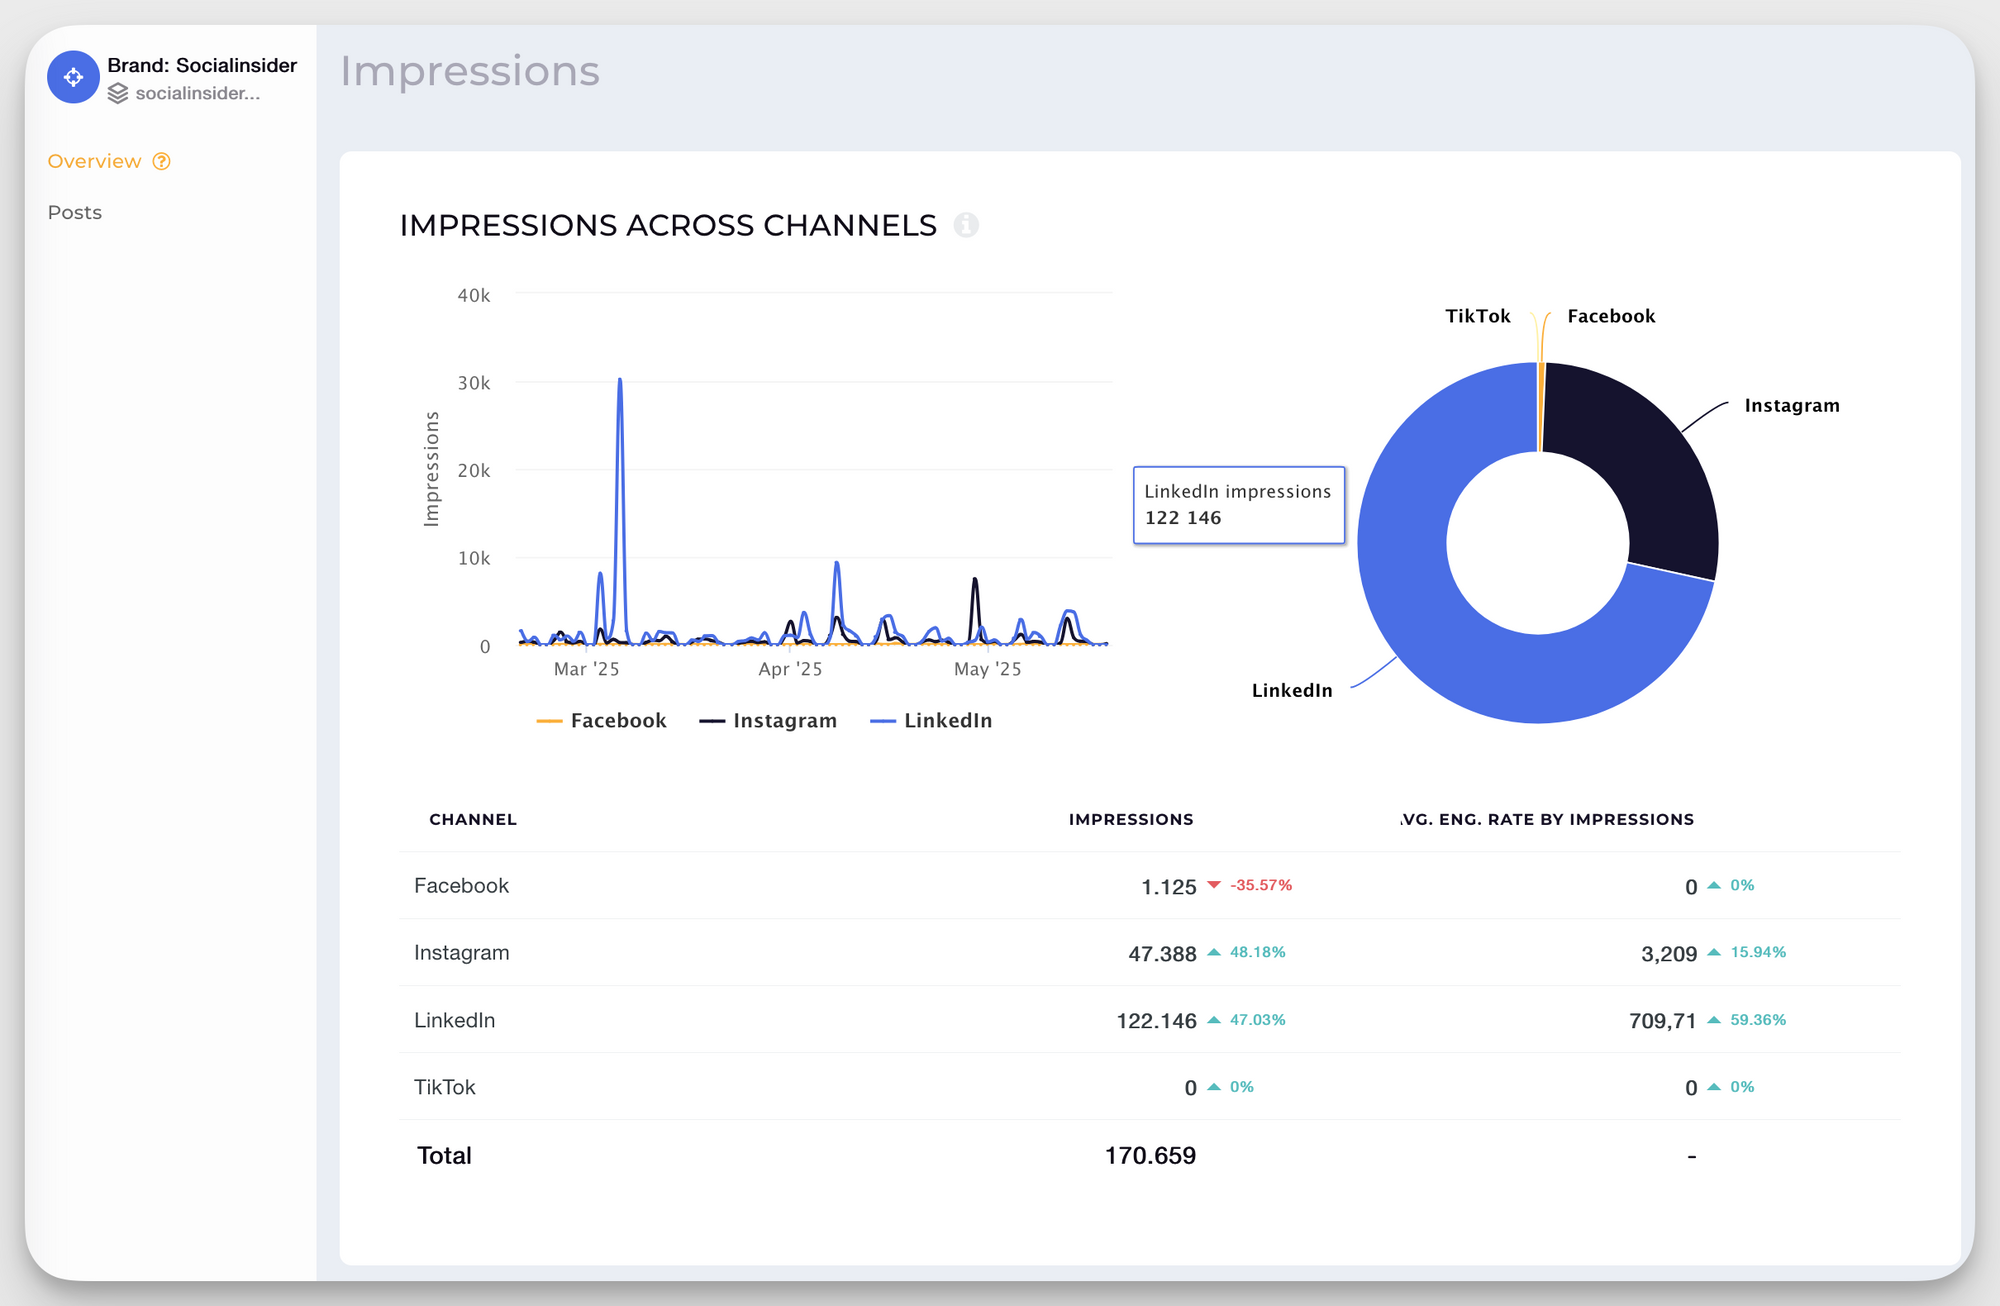
By automatically pulling performance, engagement, and competitor data into one place, social media analytics tools like Socialinsider make it easier to uncover trends and build reports that clearly show how social efforts contribute to revenue and growth.
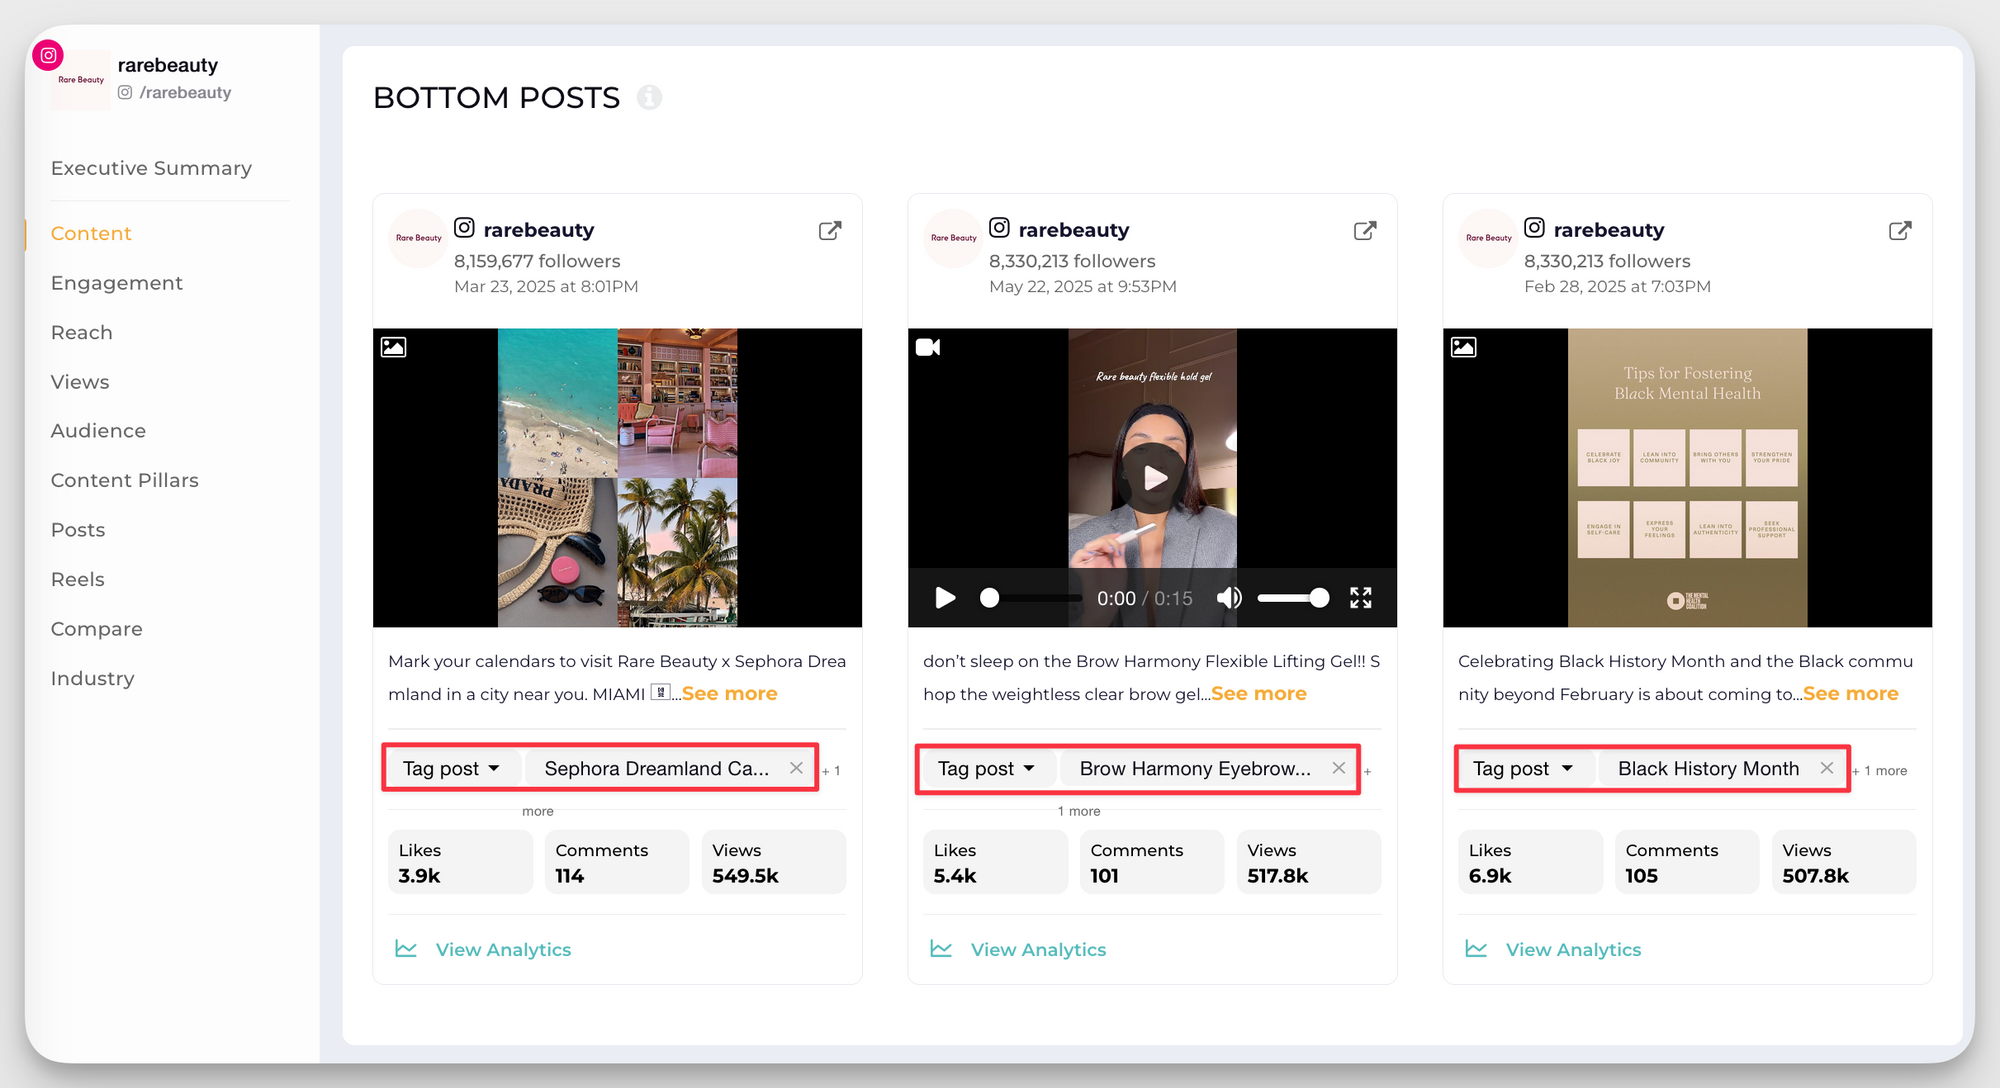
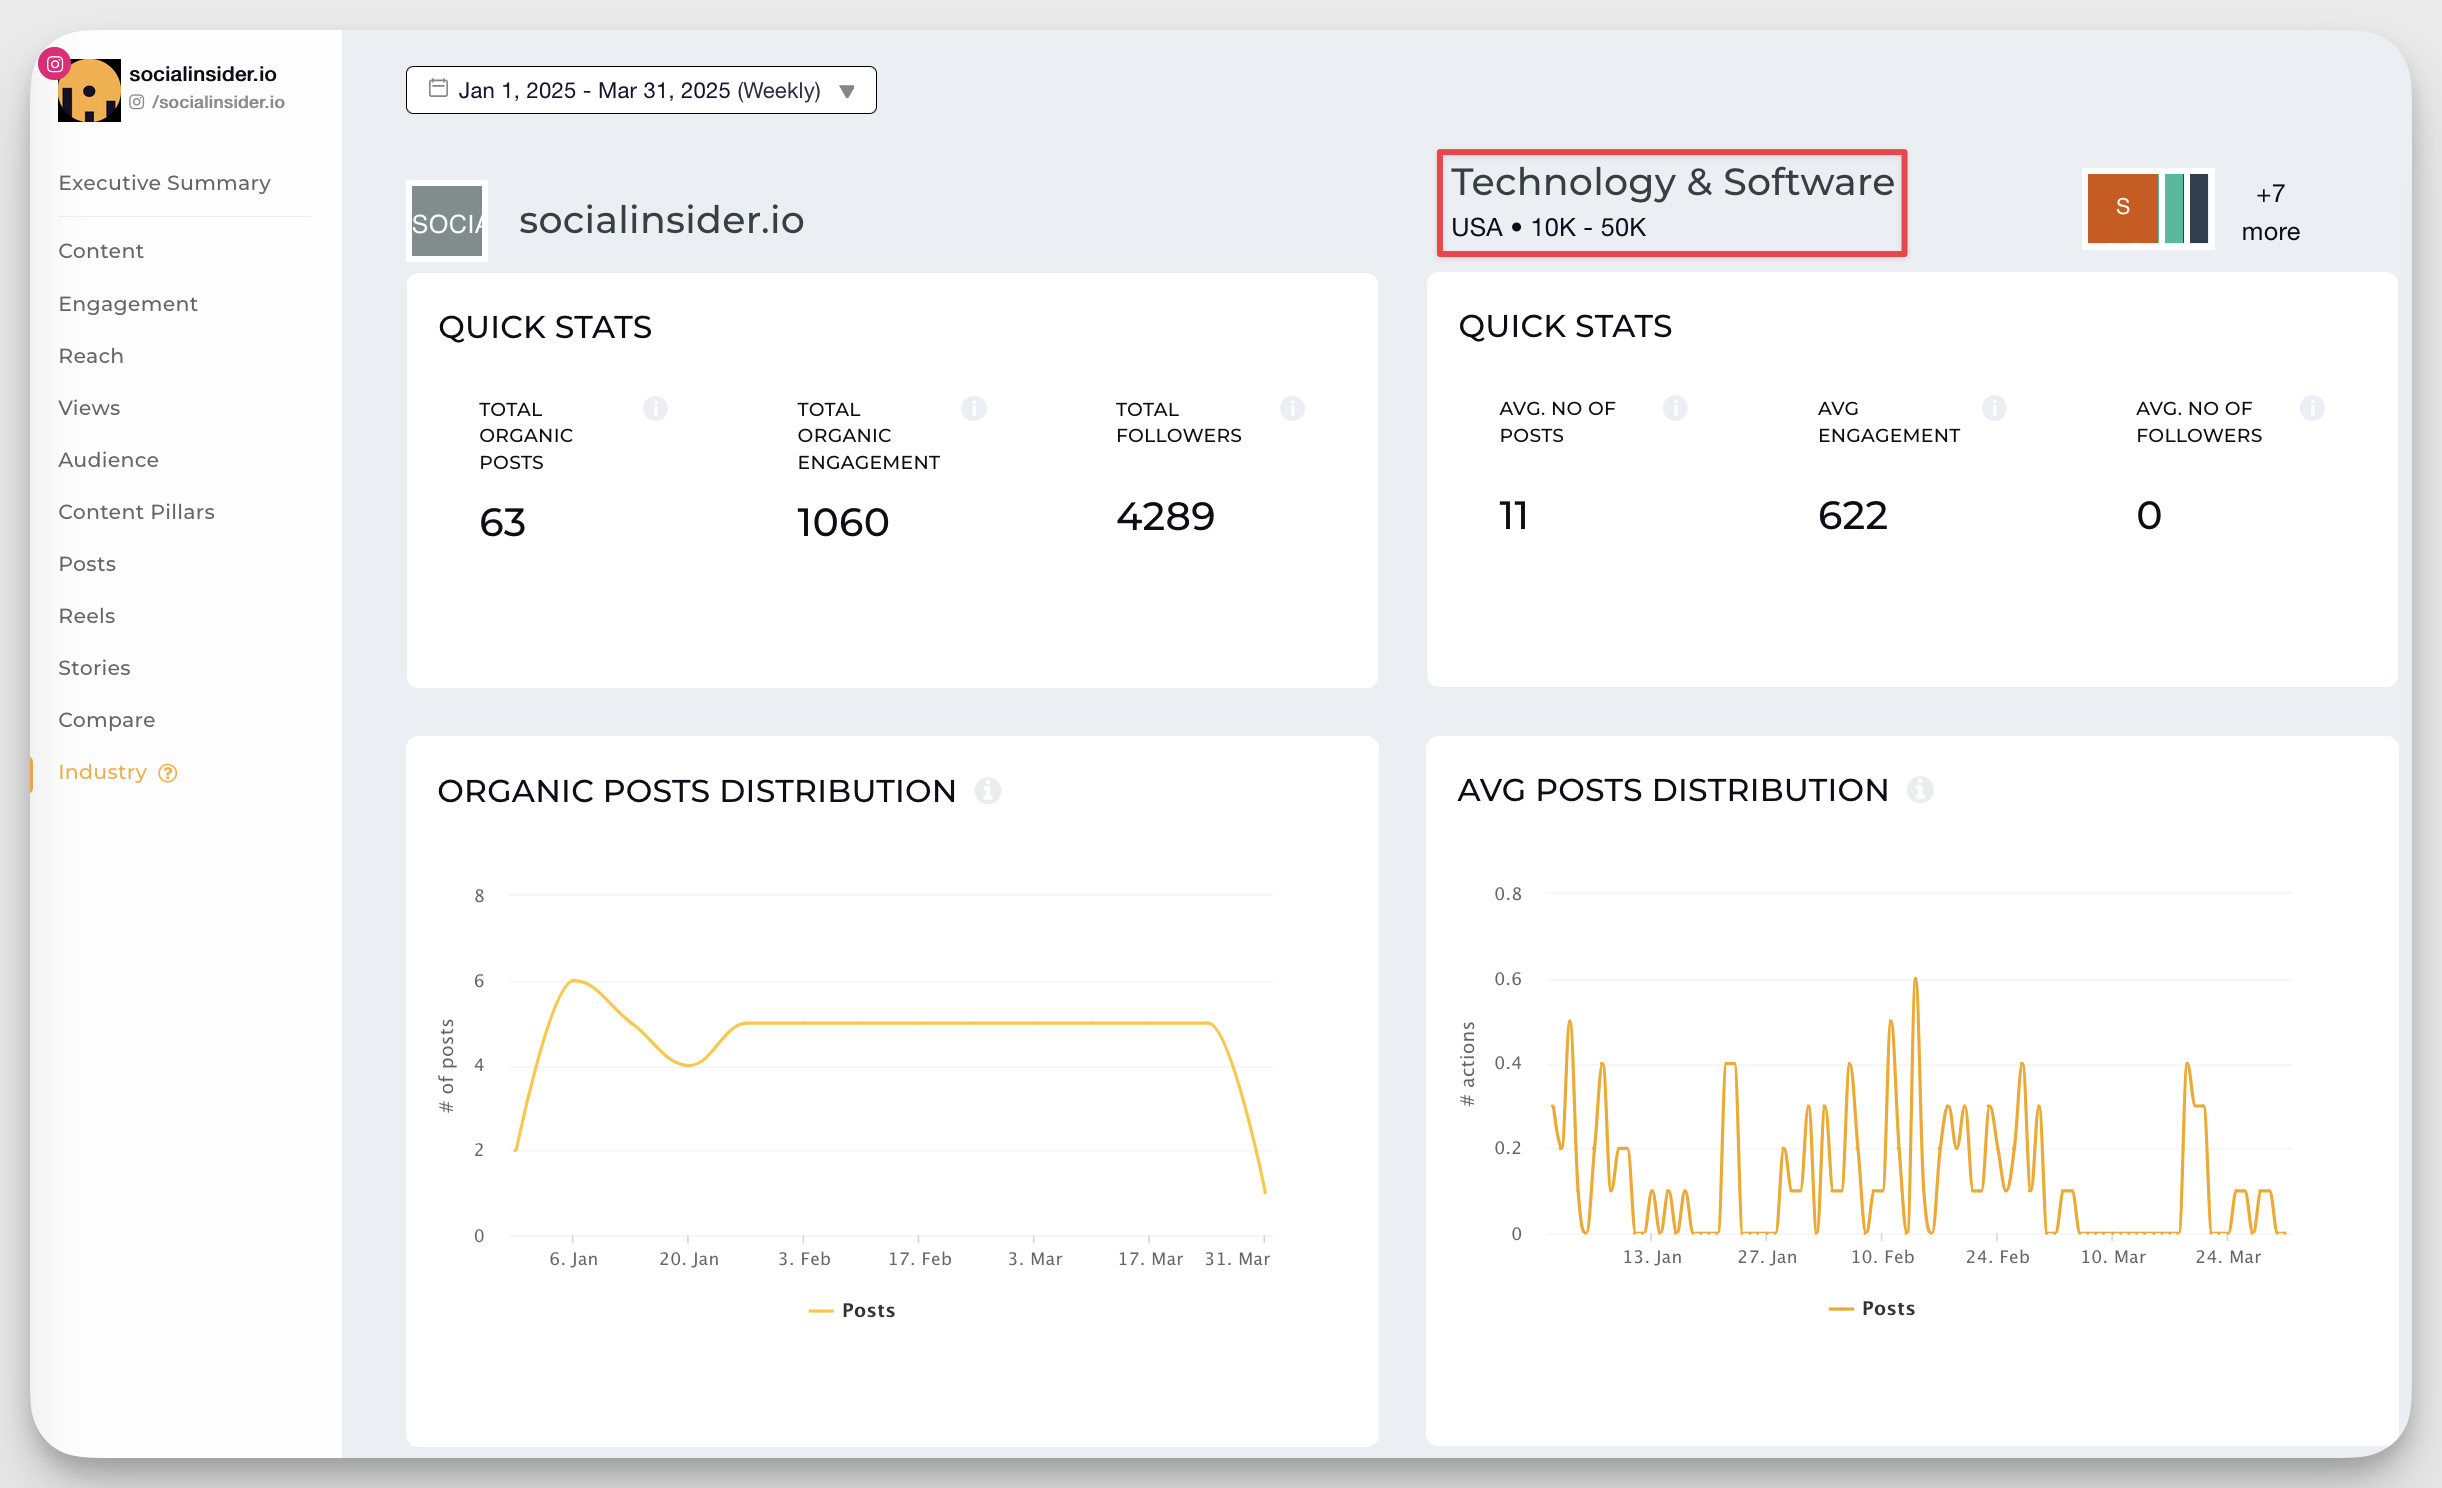
For example, reach and impressions reveal how many people see your content, helping quantify brand awareness growth, while follower growth tracks audience expansion and helps pinpoint which campaigns drive market share.
Here’s an example from Rare Beauty that shows which campaigns didn’t help push the needle forward.
The 50/30/20 rule for social media content
The 50/30/20 rule is a content distribution strategy that helps you maintain an optimum balance in your social media marketing.
Here’s how it goes:
- 50% value-driven content: Tips, how-tos, industry insights, or entertaining posts that educate or engage the audience
- 30% shared or community content: Reshare relevant posts from customers or thought leaders to build credibility and improve social media reach
- 20% promotional content: Share information about your product, services, or offers.
You can build and categorize your content based on the 50/30/20 rule to understand what’s driving more audience engagement. Use the insights to readjust your content strategy for improved engagement and conversions.
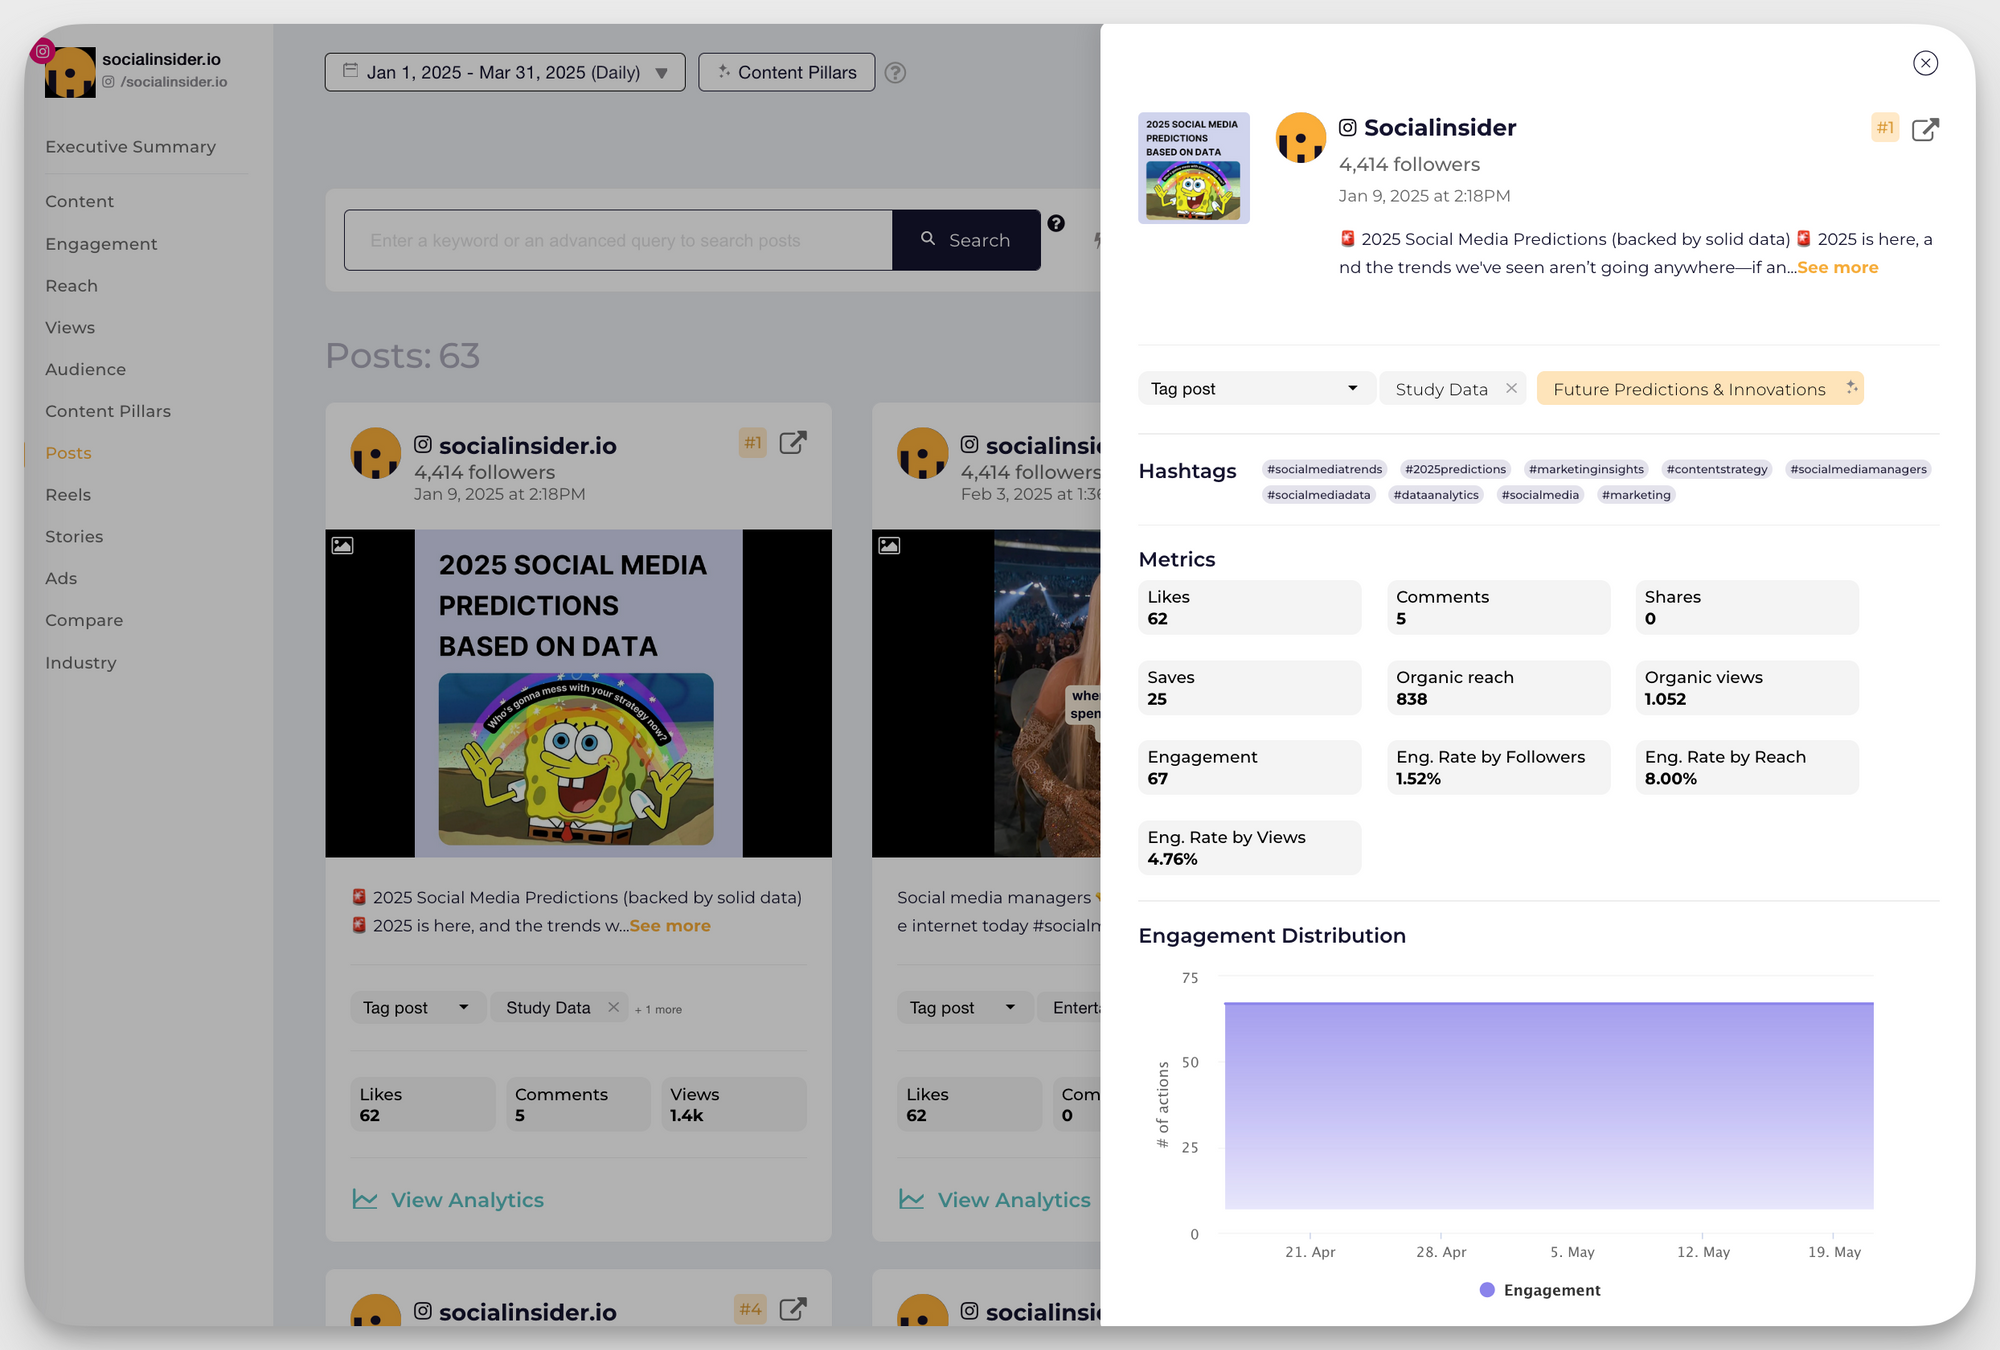
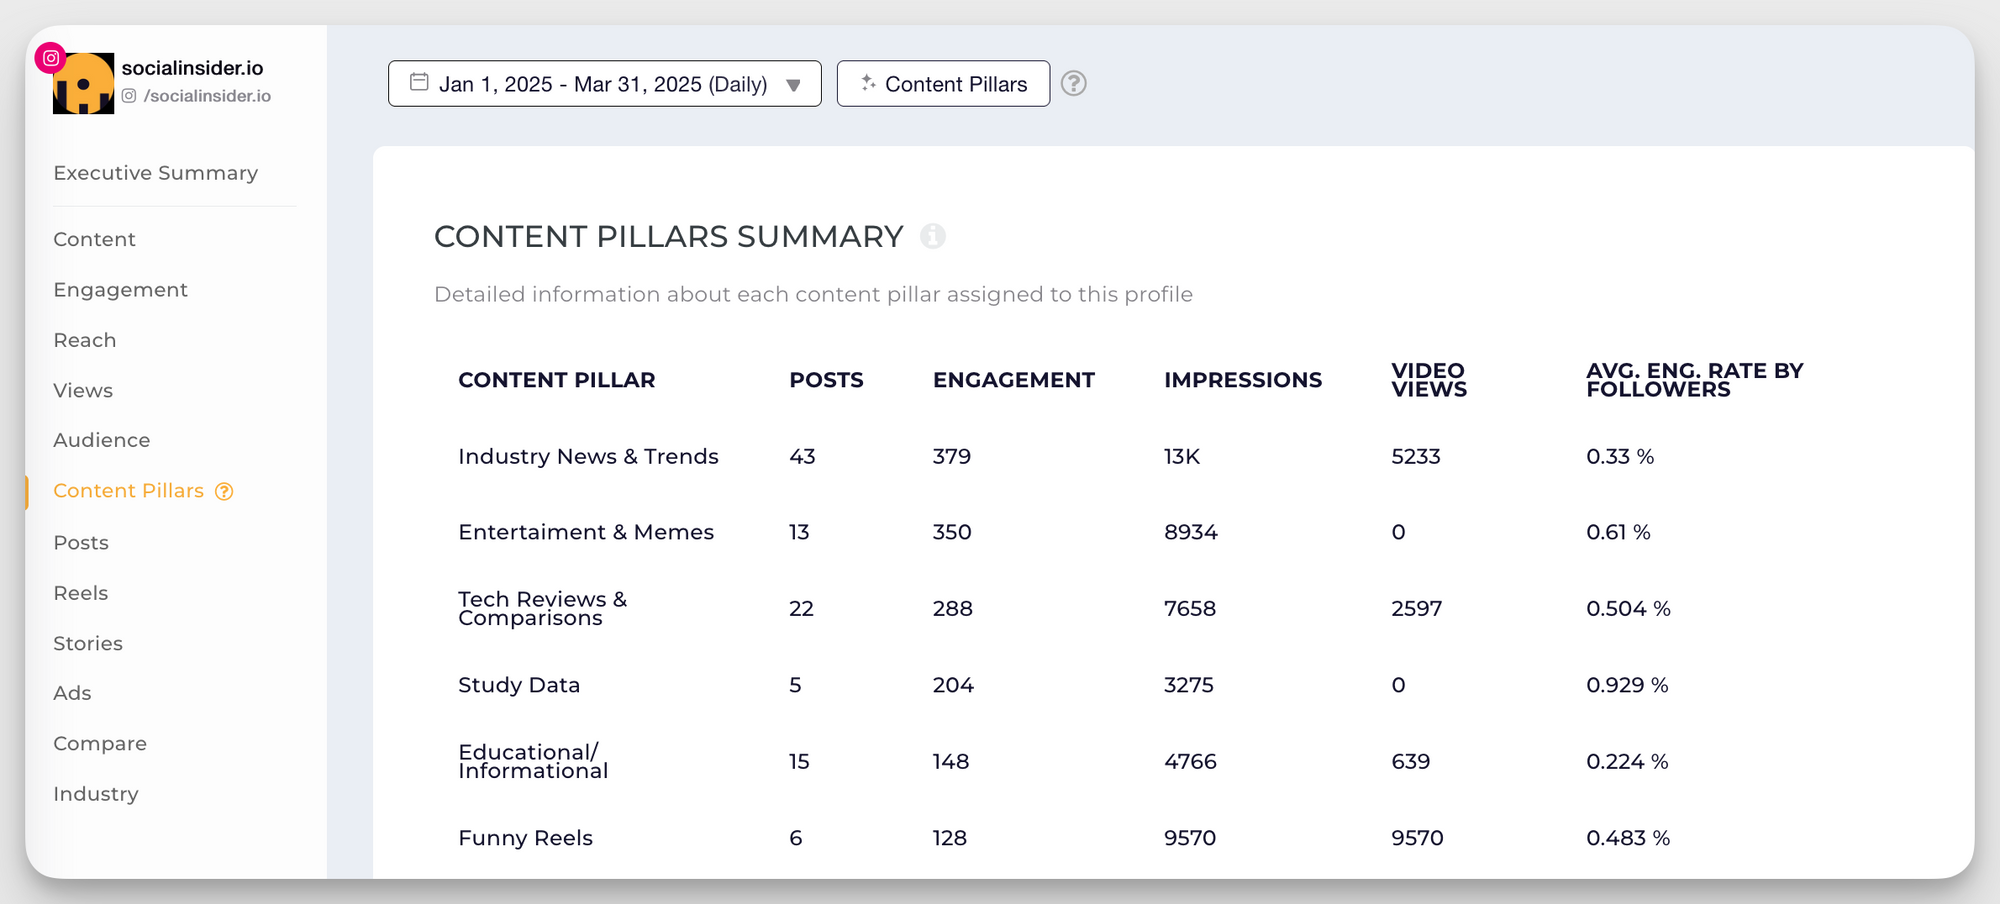
If you’re using an analytics tool like Socialinsider, you can tag and filter your posts based on the three content buckets.
Once you’ve tagged your posts, you can look at metrics such as likes, comments, shares, and saves for each bucket.
Looking at key metrics can reveal what’s really working for your brand:
- Are your promotional posts underperforming while shared content is doing better than expected?
- Are your educational posts driving the most shares?
- Is your mix too sales-heavy or too weak on brand visibility?
Analyze your posts based on the content pillar they belong to, and you’ll be able to answer these types of questions easily.
How to create a social media report
Step 1: Set clear objectives and KPIs
Decide on your main marketing objectives and then choose relevant KPIs that align with those objectives.
Here are some KPIs you can consider:
- Engagement: Likes, comments, shares, saves
- Awareness: Reach, impressions
- Conversion: Sign-ups, downloads, purchases
- Audience growth: Follower count and growth rate
Step 2: Collect relevant data
Now that you know which KPIs to track, it’s time to collect data. Use native analytics tools or third-party platforms to compile metrics across different channels.
- Native analytics tools: Facebook Insights, LinkedIn Analytics, Twitter Analytics, and Instagram Analytics
- Third-party tools: Tools like Socialinsider that can compile cross-platform insights into a single social media analytics report
Step 3: Organize data visually and effectively
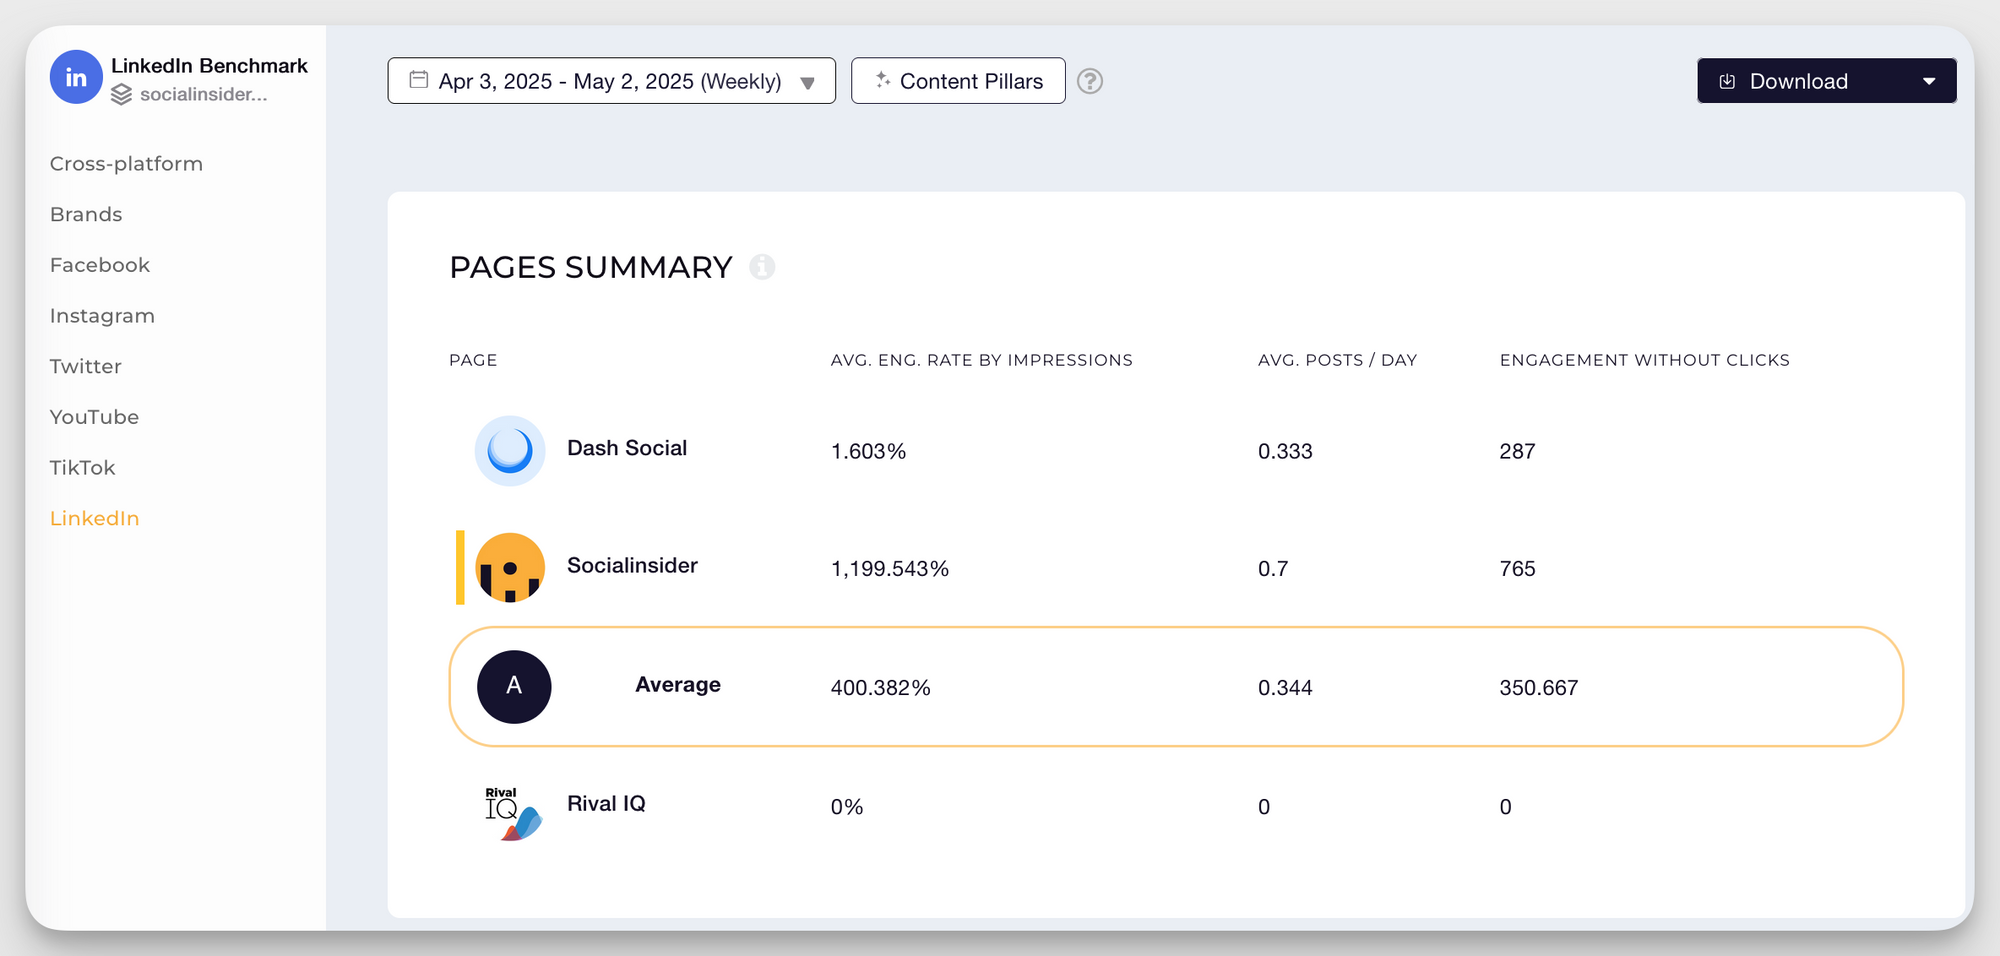
To make it easier for higher-ups to make sense of the data, you need to present it in a clear, visually appealing manner. Consider using charts, graphs, and tables to make information digestible. Make sure to highlight important data points for quick reference.
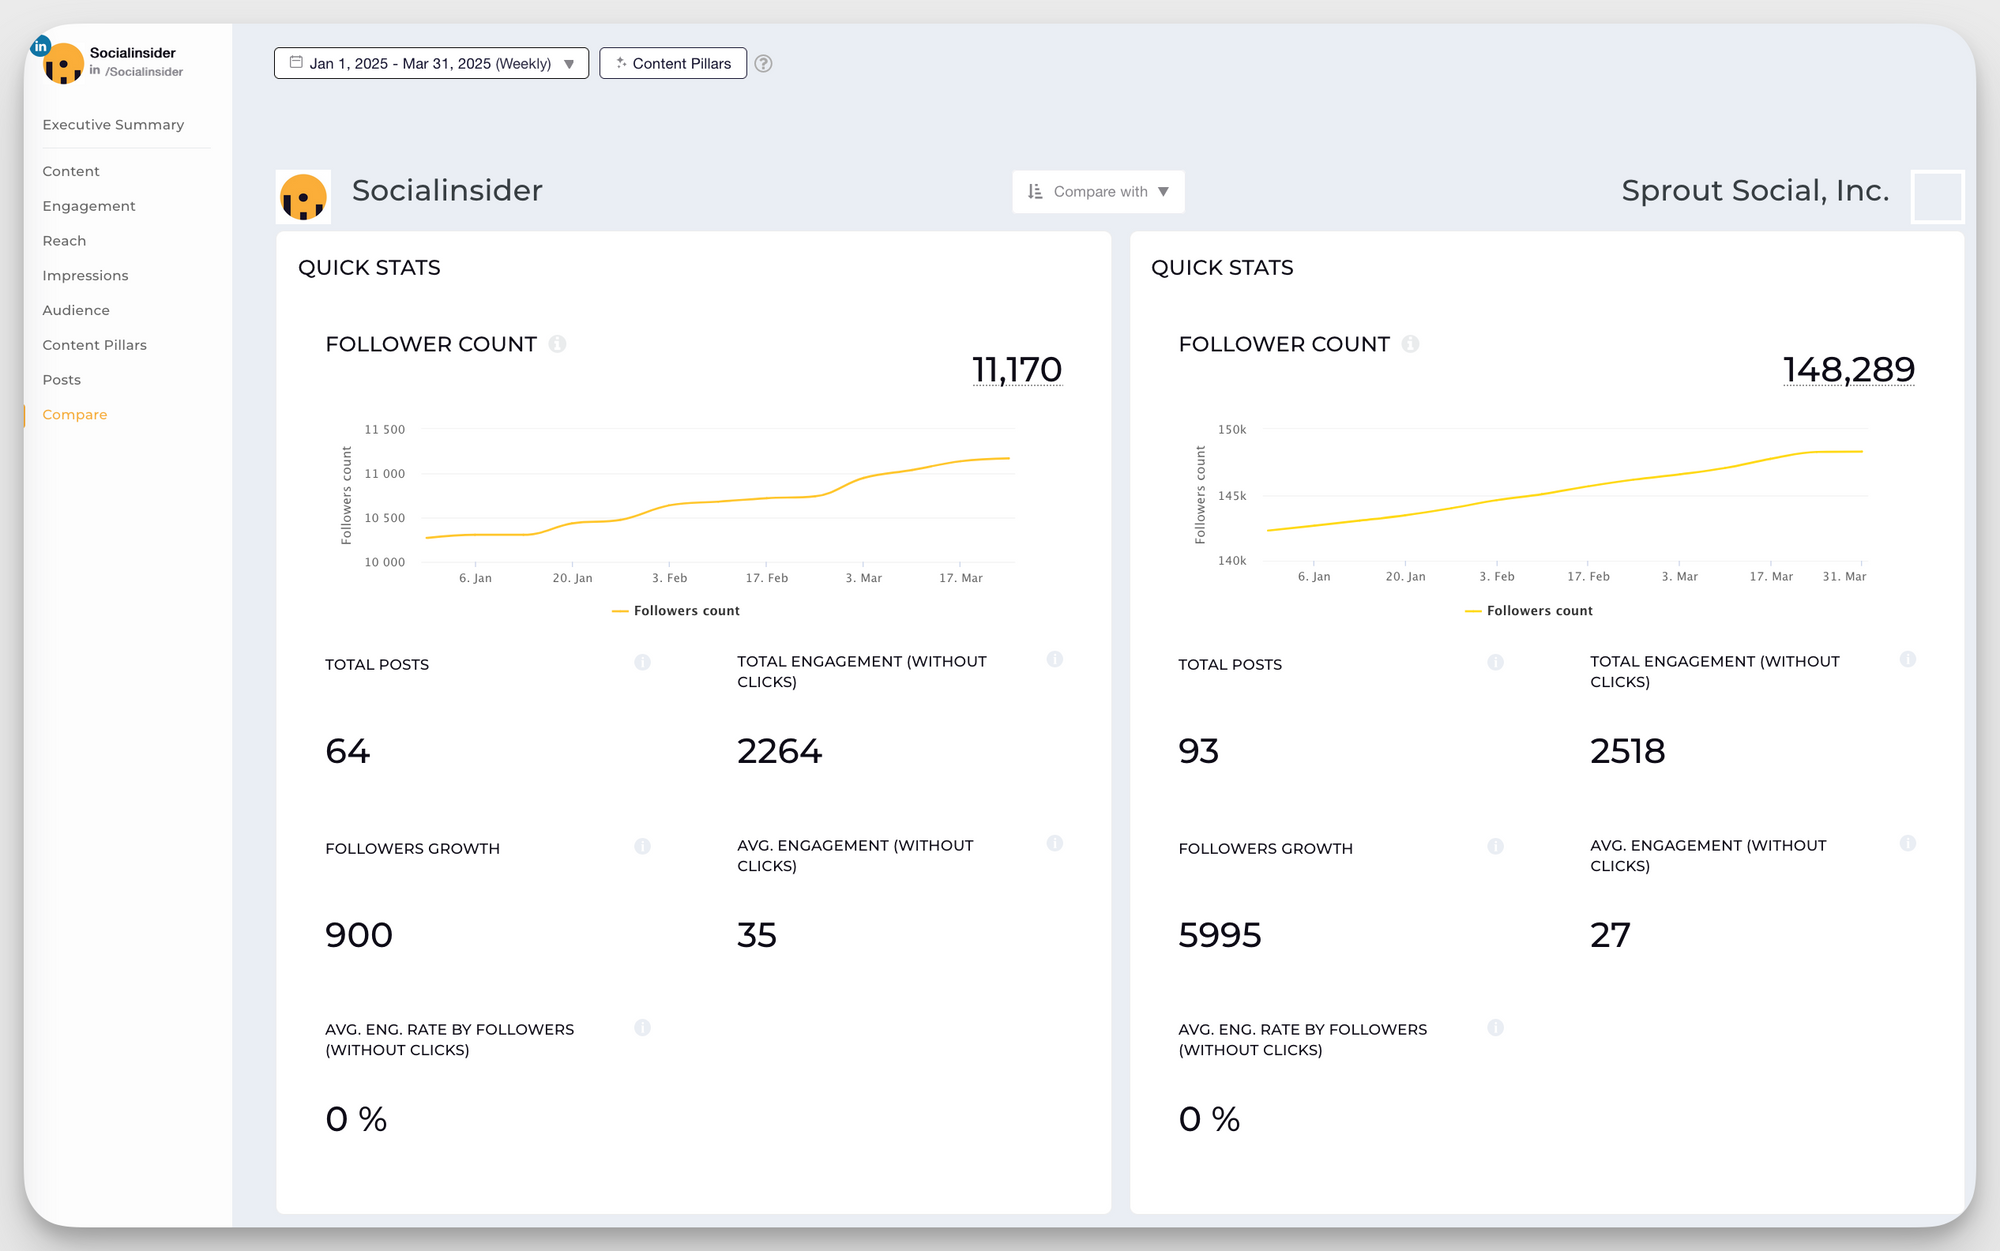
In Socialinsider, you can create social media benchmark reports, letting you visually compare performance against competitors or industry peers.
Step 4: Add context and insights to raw data
You’ll have to provide context to the raw data you have collected by explaining what that data really means and how it impacts your business goals. Highlight any patterns you’ve observed and provide insights into any spikes or drops in performance.
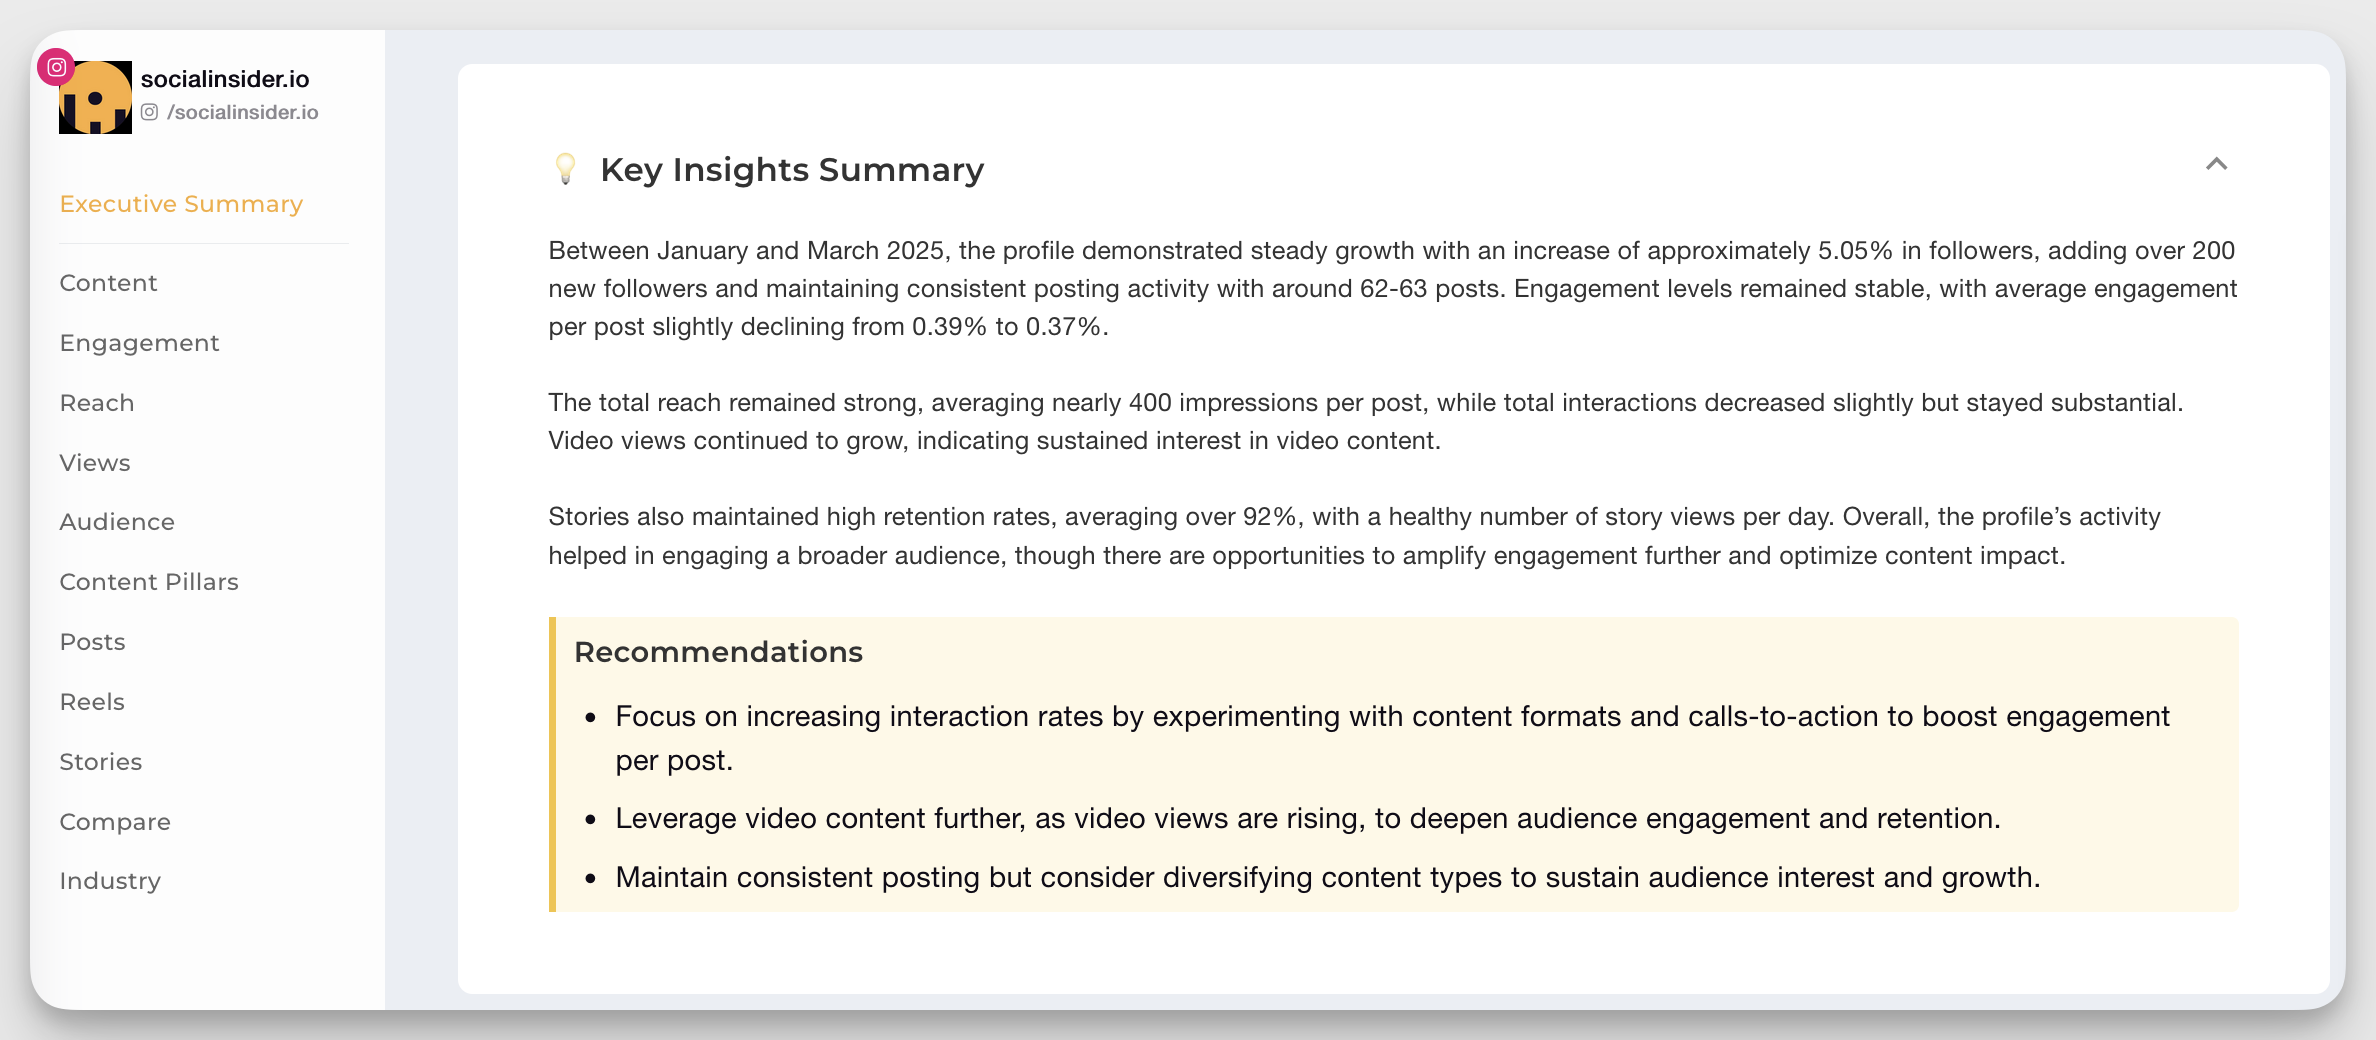
Step 5: Create executive summaries for stakeholders
Your social media report should give stakeholders a clear understanding of what happened, why it happened, and what actions you’ll take next. Create brief summaries that highlight the following information:
- Complete performance overview: Summarize overall social media performance over the specific duration
- Key achievements: Highlight significant successes or milestones, along with the strategies and factors that made them possible
- Recommendations: Suggest actionable steps based on the data
If you need some inspiration, also take a look at Socialinsider’s recommendations for your page.
Step 6: Build a customizable dashboard with Socialinsider
Use a social media analytics tool like Socialinsider to create fully customizable dashboards for your social media report.
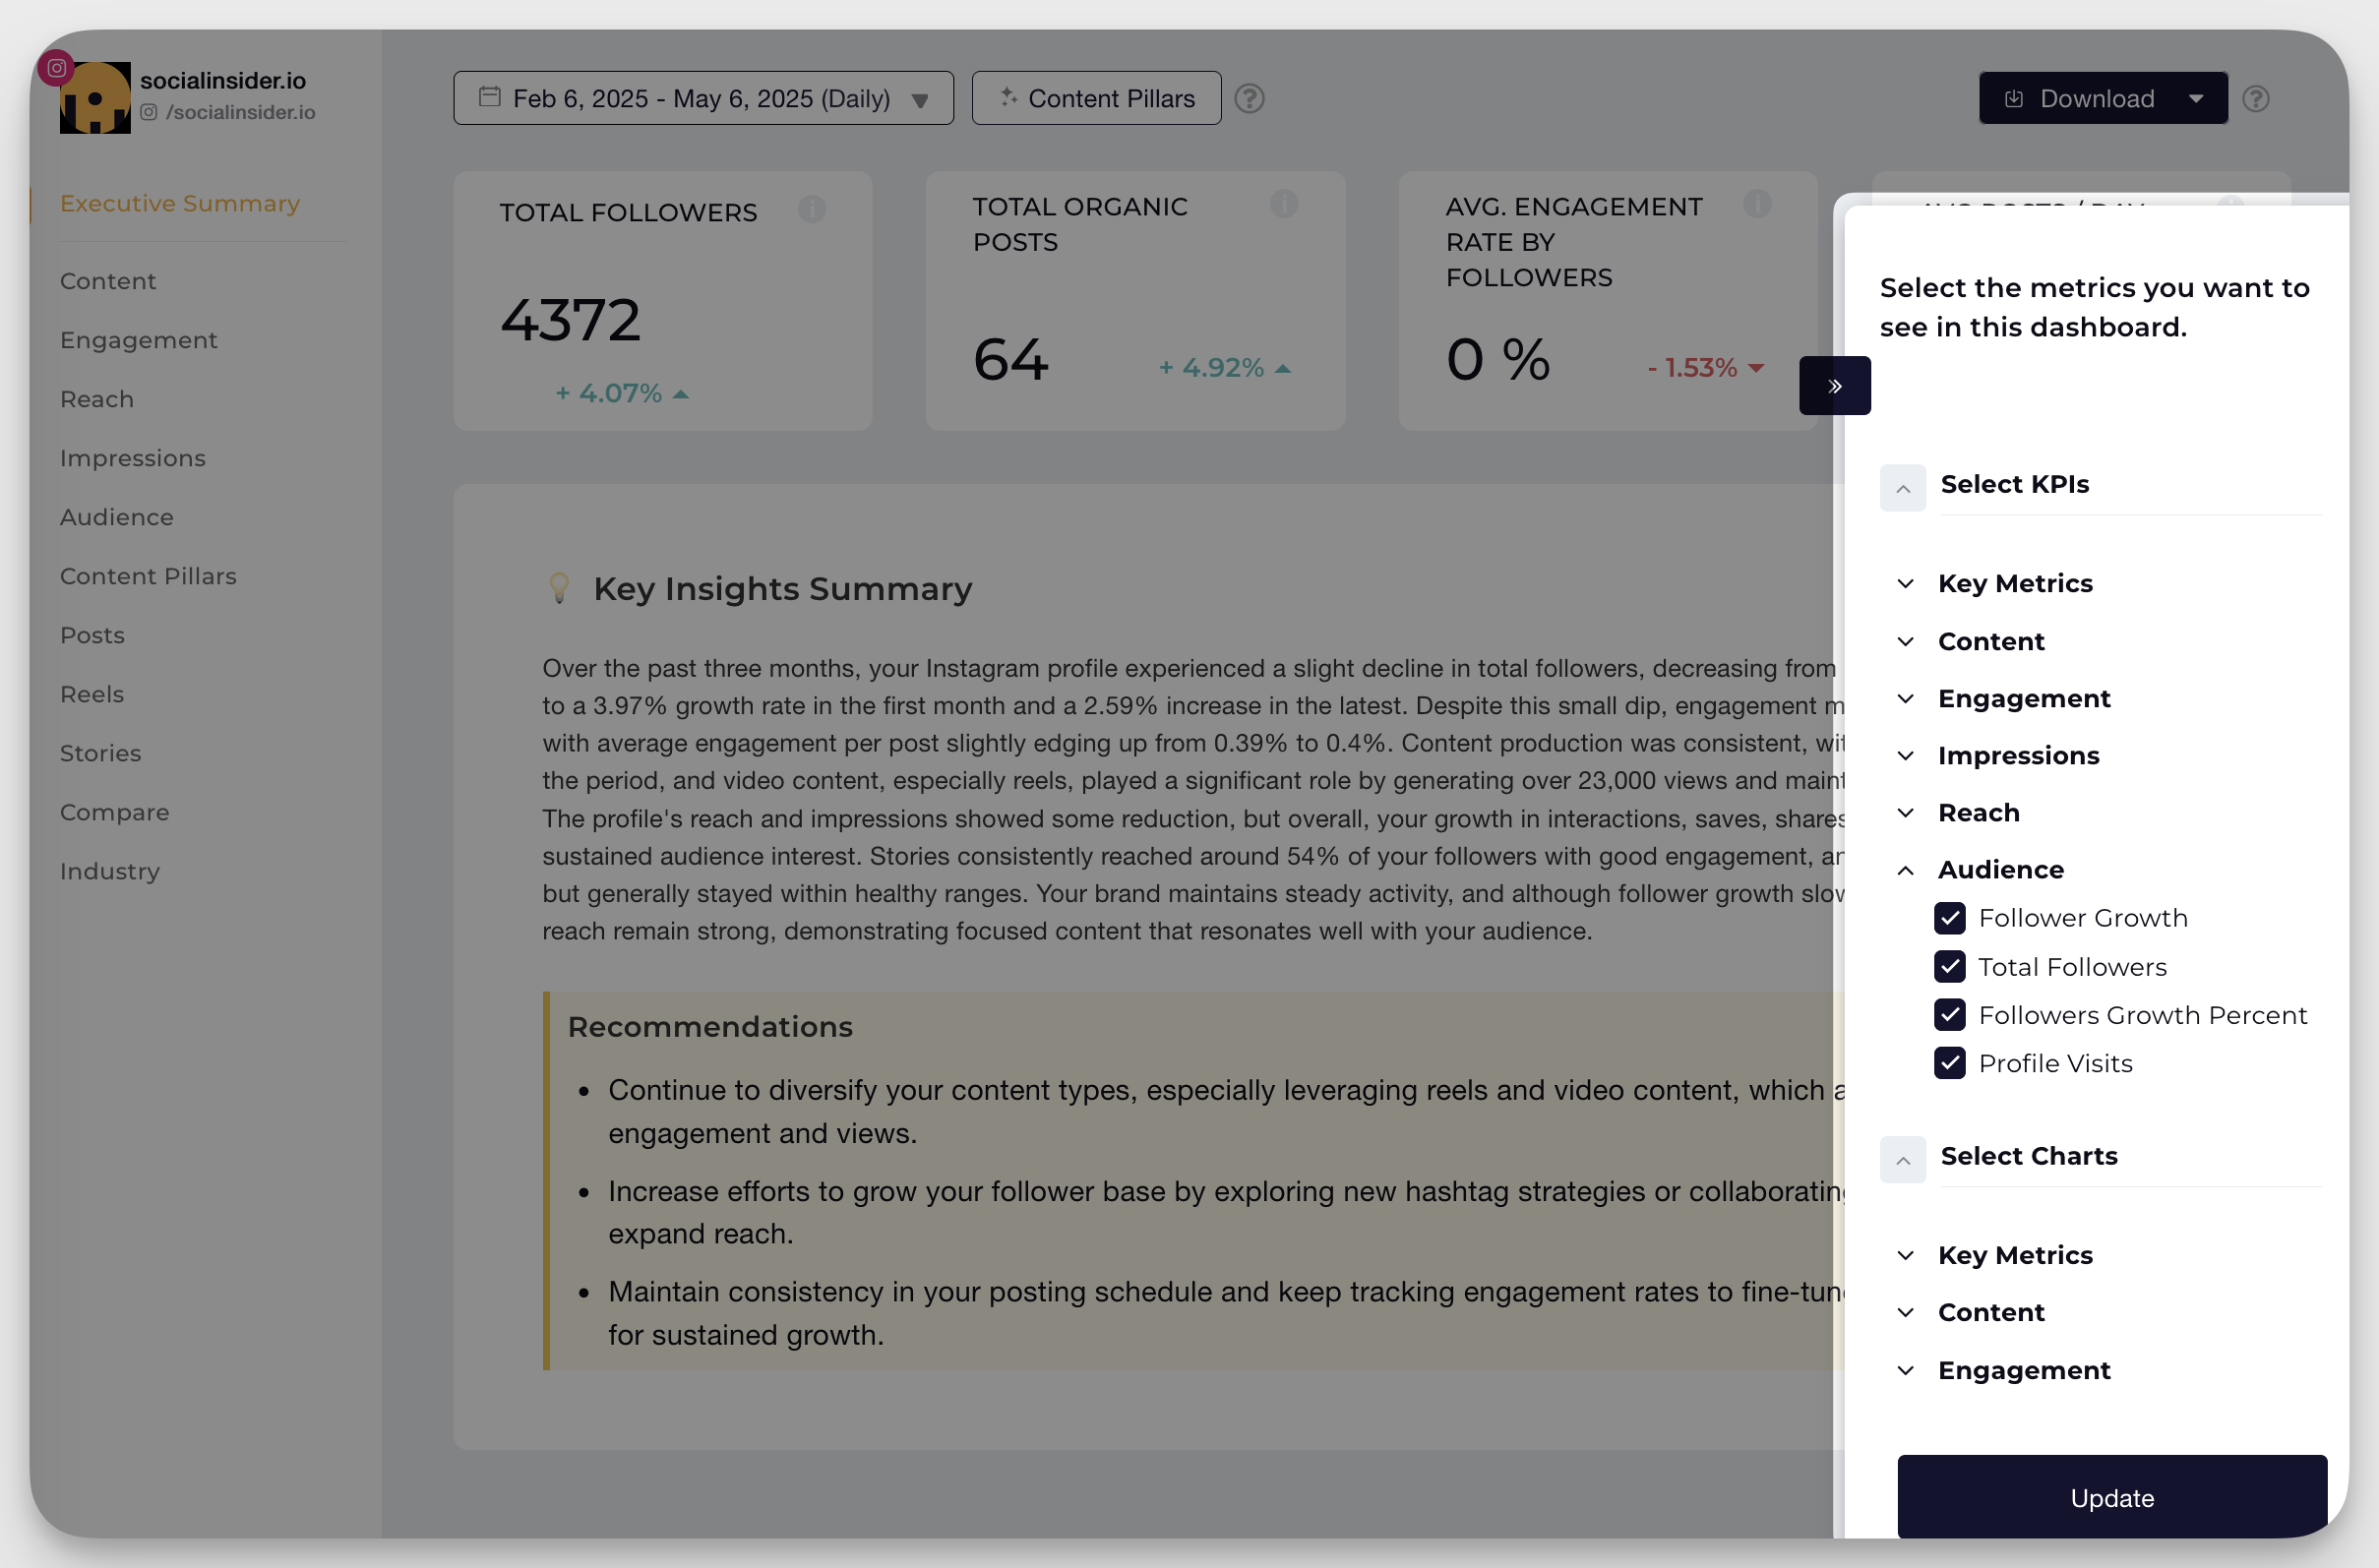
Automatically pull cross-platform metrics from Facebook, Instagram, TikTok, LinkedIn, X (formerly Twitter), and YouTube—all through a single unified interface.
You can choose which platforms to include in your social media dashboard, filter by date range, content type, or campaign, and set up widgets to spotlight the KPIs that matter most. These dashboards update in real-time, making it easy to track performance trends and share insights across your team.
To present data to stakeholders, you can download reports directly from the dashboard in PDF, XLS, or CSV formats or share them via public links. The entire process is simple and automated.
Essential metrics to include in your social media report
Including the right metrics in your social media report can make all the difference. Vanity metrics such as likes or follower counts don’t prove impact unless they’re analyzed in context with other data, and dumping too many KPIs in your report will only make it hard to see the bigger picture.
Whether it’s a social media campaign report or a social media audit report, focus on metrics that align with your goals and highlight performance, growth, and ROI.
Here are some essential metrics you can include in your social media report:
Engagement metrics
Engagement metrics such as likes, reactions, comments, shares, saves, or retweets can serve as indicators of content resonance and audience reach, but by themselves, they’re not a measure of success. For example, if a campaign gets many impressions but few clicks, it may signal that your content isn’t compelling enough or is targeting the wrong audience.
Audience growth metrics
Audience growth metrics, such as follower count and growth rate, provide a clear picture of how effectively your brand is expanding its reach and building awareness over time. Tracking not just the absolute number of followers but also the rate at which your audience grows helps you assess whether your campaigns and content strategies are resonating with new and existing audiences. A steady or increasing growth rate signals successful audience-building efforts, while stagnation or decline may highlight the need for strategic adjustments.
Keep in mind that audience growth should be evaluated alongside engagement and retention metrics to ensure that new followers are genuinely interested and likely to become loyal customers or advocates.
Reach and impressions metrics
Reach and impressions metrics are essential for understanding the visibility and exposure of your content. Reach measures how many unique users have seen your posts, offering insight into your brand’s potential influence and the breadth of your messaging. Impressions, on the other hand, count the total number of times your content is displayed, including multiple views by the same user, which is useful for gauging message reinforcement and brand recall.
Analyzing these metrics helps you determine whether you are successfully expanding awareness, optimizing content for different platforms, and ensuring your messages are seen often enough to make an impact. Used together, reach and impressions reveal both the scale and frequency of your brand’s presence in the market.
Conversion and ROI metrics
Conversion metrics—such as conversion rate, cost per acquisition, and revenue generated—directly link marketing activities to business outcomes. These metrics show how effectively your social and digital campaigns turn audience engagement into tangible actions, like purchases, sign-ups, or inquiries. ROI (Return on Investment) metrics go a step further by quantifying the financial return relative to the resources invested, enabling you to justify spending and optimize future campaigns.
By monitoring conversion and ROI metrics, you can identify which strategies drive the most value, allocate resources efficiently, and continuously improve your marketing effectiveness for growth and profitability.
Competitive benchmarking metrics
Competitive benchmarking metrics allow you to compare your performance against industry peers and direct competitors. By evaluating metrics such as audience growth, engagement rates, conversion rates, and ROI in the context of the broader market, you gain a valuable perspective on where your brand stands and where there are opportunities for improvement.
Benchmarking helps set realistic goals, identify best practices, and spot emerging trends or risks. It also enables more informed decision-making, as you can prioritize initiatives that close performance gaps and capitalize on areas where you already lead, ultimately driving continuous improvement and sustainable business growth.
With Socialinsider’s competitive benchmarking feature, you can compare your brand’s performance against direct competitors and industry social media benchmarks across all major platforms. You get real-time, visual insights that help you refine your strategy and stand out in your industry.
Analyzing your social media reports to extract actionable insights
With all your metrics collected and ready, it’s time to analyze the data and extract actionable insights that you can include in your social media reports.
Just like the types of metrics, there are also different ways you can analyze data, including:
Pattern recognition techniques
Pattern recognition techniques help identify recurring behaviors or outcomes within your social media data.
For instance, you might find that engagement drops on the weekends, but there’s a spike in engagement on Tuesdays. This insight could suggest that you should adjust your content schedule and share more value-packed posts on high-performing days, such as Tuesdays, to maximize visibility.
How to apply it:
- Analyze engagement by day of week and time of day to uncover consistent peaks and dips in performance
- Track recurring content formats, themes, or CTAs that drive higher-than-average results
- Identify seasonal or campaign-based patterns
Trend identification and forecasting
It involves spotting emerging topics or audience behaviors on social media and predicting how they will evolve over time. By identifying trends early, you can adjust your content strategy before performance dips or jump on emerging trends before your competitors.
How to apply it:
- Monitor month-over-month changes in engagement, impressions, and follower growth to detect emerging trends
- Compare performance across different campaigns to identify shifts in audience response
- Use historical data to forecast future performance trends
Audience behavior analysis
Audience behavior analysis helps you understand what your audience likes, how they engage with your content, and what drives them to take action.
And when you know how different audience segments interact with your content, it becomes easier to build more effective and customized campaigns.
How to apply it:
- Segment your audience by buyer personas, and compare how each group engages with content
- Track which audience segments are driving conversions
- Analyze which content types and formats retain the longest attention across different audience segments
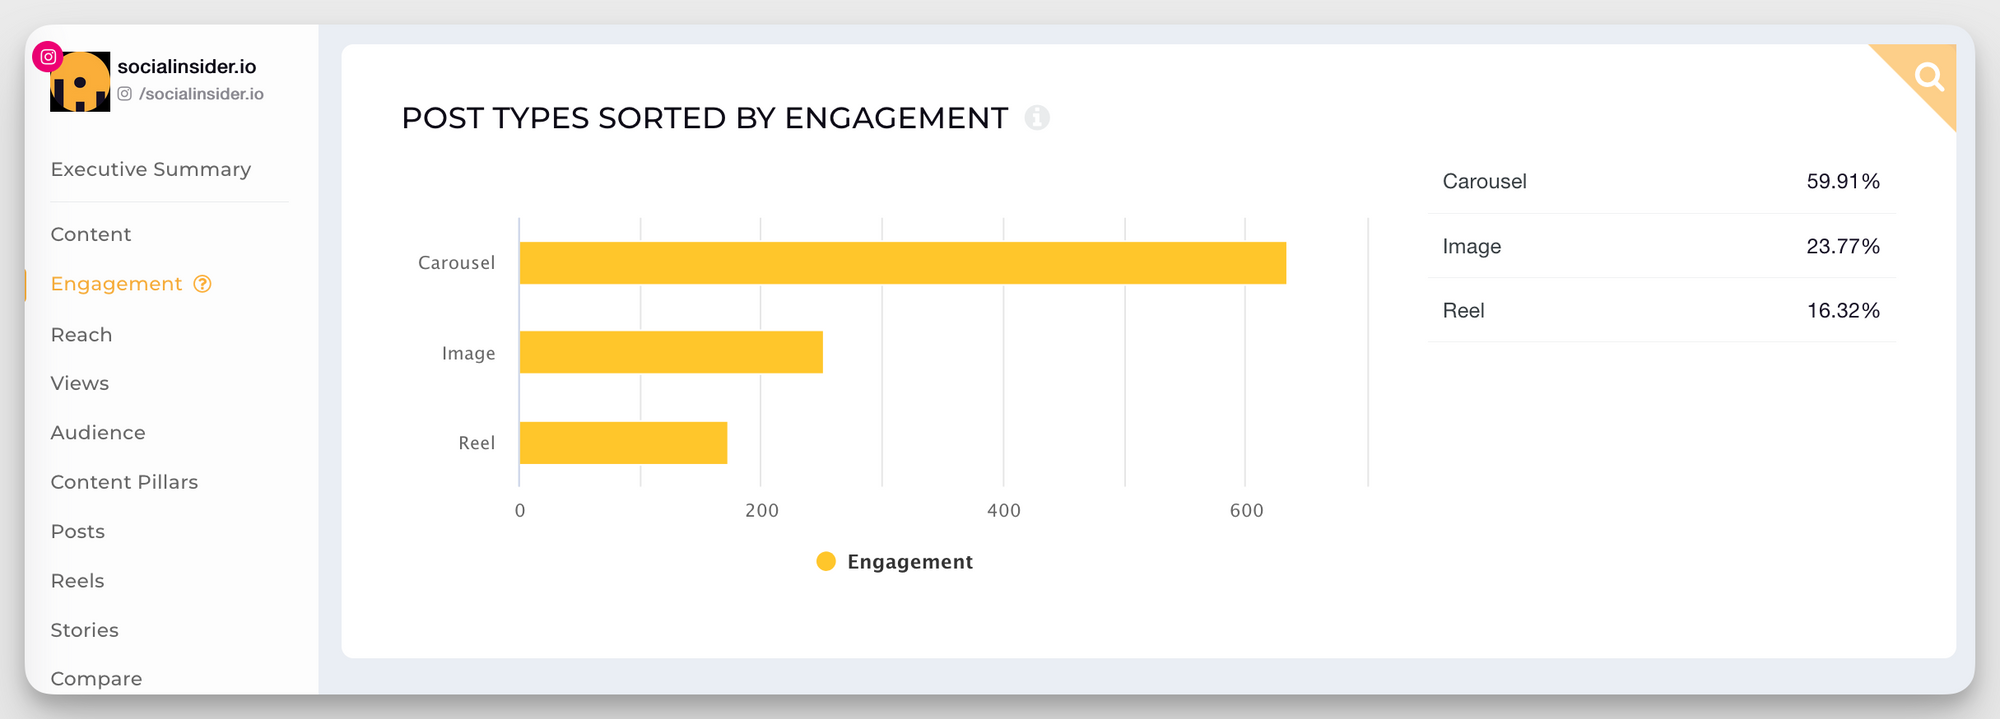
Content performance analysis
It involves identifying which content types or pillars drive the most value for your brand. Some posts are great for improving reach, while others drive clicks or leads. You need to understand which content aligns best with your marketing goals and what resonates the most with your audience.
How to apply it:
- Compare performance across videos, images, carousels, Stories, and Reels to see what format leads to the best results
- Categorize content into different pillars (such as educational, promotional, and community-focused) and track their performance to see which pillars drive more engagement and which ones drive conversions
- Run creative A/B tests (different visuals, headlines, or CTAs) to determine what boosts click-throughs or shares
Competitor analysis
Competitor analysis is all about analyzing your competitors to find out how they are performing on social media. You compare their strategies, content types, and audience engagement with yours. The analysis can give you more context into what your competitors have been up to and what’s working well for them.
How to apply it:
- Track key metrics like engagement rate, post frequency, and follower growth across your top competitors
- Use Socialinsider to identify high-performing content from competitors, including formats and campaign themes across multiple platforms, to spot content gaps, refine your posting schedule, and adapt your strategy
Common social media reporting mistakes and how to avoid them
Take a look at five common mistakes marketers make in social media reporting—and how to avoid them to ensure your reports lead to more powerful strategies.
Overemphasizing vanity metrics
There’s no point focusing too much on vanity metrics if you can’t link them to your business’s bottom line. Instead, combine them with deeper indicators like click-through rates, conversion rates, and engagement rates. For instance, track how many likes lead to comments, shares, or website visits, and ultimately, to sales or sign-ups.
Presenting data without context
For example, reporting a 15% increase in engagement means little if you don’t explain whether this is due to a successful campaign, a seasonal trend, or a change in audience behavior. Without context, data can also reinforce biases, cause confusion, and even damage credibility if stakeholders draw the wrong conclusions or act on incomplete information. Context provides the necessary background—such as benchmarks, comparisons, and explanations—that transforms data into actionable insights, making it possible for stakeholders to make informed decisions, set priorities, and understand the true impact of social media efforts.
Missing conversion tracking
This lack of visibility can lead to misallocated budgets, as you may continue to invest in underperforming tactics while overlooking those that actually contribute to growth. Inaccurate or incomplete tracking distorts performance data, potentially causing you to underestimate campaign success and miss out on scaling opportunities. Furthermore, missing conversion tracking prevents you from understanding user behavior, refining creative assets, and identifying points of friction in the customer journey, all of which are essential for continuous improvement and maximizing marketing impact.
Using inconsistent reporting periods
When data is reported over different timeframes—such as comparing a week to a month, or using misaligned start and end dates—it becomes difficult to accurately assess performance trends, identify patterns, or make meaningful comparisons across campaigns or periods. This inconsistency can lead to flawed decision-making, as you may draw incorrect conclusions about what’s working or where resources should be allocated.
Failing to segment data
Failing to segment data leads to generic, unfocused marketing efforts that often miss the mark with your audience and waste valuable resources. Without segmentation, you’re forced to treat your entire audience as a homogenous group, which results in broad messaging that fails to resonate with specific needs, interests, or behaviors. This lack of personalization can significantly reduce engagement, loyalty, and conversion rates, as customers are less likely to feel understood or valued by your brand.
Additionally, inadequate segmentation makes it difficult to identify high-value customer segments, prioritize marketing resources efficiently, or uncover profitable market niches, ultimately resulting in higher costs and lower returns on your campaigns. In short, segmentation is essential for delivering relevant, targeted messaging and for making data-driven decisions that maximize marketing effectiveness and business growth.
How to present your social media report to stakeholders
You may have the most interesting, accurate data in your social media report, but if it’s not presented in a format that makes sense to the stakeholders, then everything will fall apart.
Tailor the report for different audiences
Just like you tailor your brand messaging for different audience segments, you also need to tailor your report for different people in the company to give them exactly what they need to take action.
Executives care about business impact, not just engagement numbers. So, when reporting to leadership, focus on high-level KPIs like ROI, lead generation, or growth metrics. For marketing teams, go deeper and include platform-level metrics, audience insights, and content performance breakdowns.
Use visualizations
Don’t overcrowd your report with complex tables. Instead, use clean, easy-to-read charts to highlight important data and trends. You can also color-code your data to differentiate between different platforms, content pillars, and audience segments.
Highlight both wins and learnings
A report that only focuses on what worked without addressing what didn’t can come across as overly polished or untransparent. Stakeholders may even question its credibility. To build trust, you need to acknowledge successes AND areas for improvement.
Connect social performance to business objectives
Every insight you mention in your social media report should connect back to your main business goals, whether it’s brand awareness, lead generation, or customer retention. Instead of just saying, ‘LinkedIn engagement grew by 30%,’ you need to explain what that really means: What was the reason behind the increase? Did the boost in engagement also lead to more website hits or demo sign-ups?
Your social media profiles should be a growth engine for your business, not merely a communication channel.
Make clear, data-driven recommendations
Your report shouldn’t just present data and trends, it should guide the next steps, too. Each key insight should be followed by a clear, actionable recommendation based on the numbers. Don’t just highlight what happened; also explain what should happen next.
Automating your social media reporting
Here’s how to build an efficient, automated reporting system that works in the background while you focus on strategy.
Set up automated data collection
Manual data gathering from each platform using native analytics tools can take a lot of time and even lead to errors in some cases.
Instead, you should automate your social media management report with tools that pull data into a social media metrics report or social media monthly report without any spreadsheets needed.
By using third-party tools like SocialInsider, you can automatically collect and consolidate data from multiple social platforms into real-time social media dashboards.
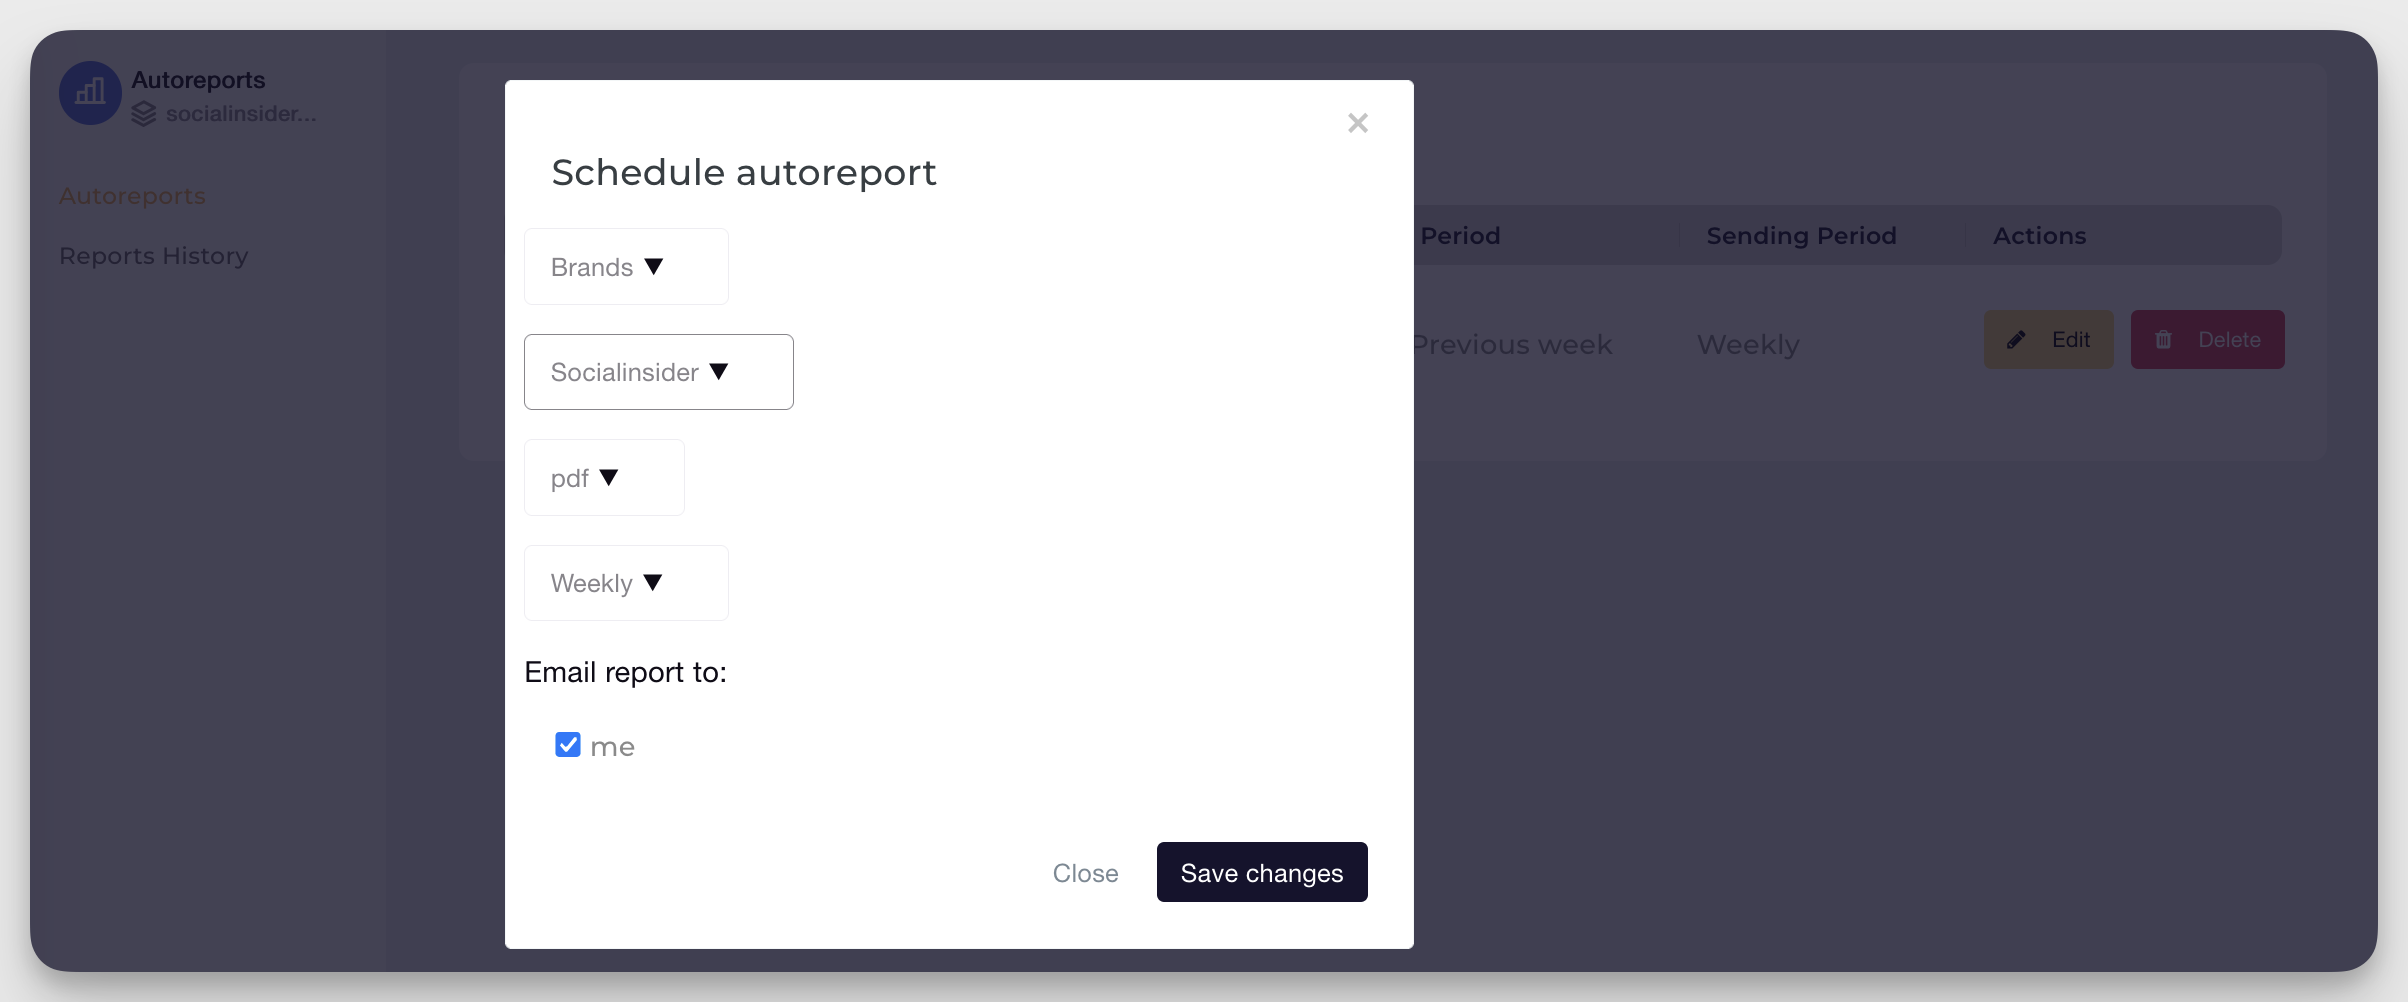
Schedule regular report generation
Once your data is flowing in automatically, the next step is to schedule recurring reports. Whether you report weekly, monthly, or quarterly, a set schedule ensures reporting becomes part of your ongoing process and not a rushed, last-minute thing.
Automated scheduling reduces the risk of missing key reporting deadlines and keeps you updated on the major trends and patterns.
Use tools that automate the entire reporting workflow
Socialinsider can automate your entire reporting process, from pulling metrics from different platforms to generating reports decked with visuals and graphs.
With Socialinsider, you can:
- Connect and sync multiple social media profiles (Facebook, Instagram, LinkedIn, TikTok) to gather all your metrics in one place
- Pull real-time data into customizable dashboards so your team always works with the latest numbers
- Create branded report templates with pre-set KPIs, charts, and sections
- Benchmark performance against competitors to add strategic context to your metrics
- Generate white-labeled social media report templates and customize them to create reports anytime, downloadable in PDF, XLS, or CSV format
- Schedule recurring report deliveries directly to stakeholders’ inboxes, ensuring consistency and keeping everyone aligned, without manual follow-ups.
Time-saving tips when automating reporting workflows
Automation is only as effective as the workflow behind it. To maximize efficiency, build reporting routines that are both scalable and easy to manage. Here are a few tips:
- Create templates for recurring reports, so you don’t start from scratch each time
- Use custom tags or UTM parameters in your campaigns to track performance by initiative or marketing funnel stage
- Automate internal alerts for unusual metric fluctuations, like a sudden drop in engagement or spike in negative brand sentiment
- Schedule 30–60 minutes after each report delivery to review and extract insights while the data is fresh
Social media crisis reporting
Social media crisis reporting involves documenting and analyzing everything that happens during and after negative content about your brand spreads online.
Unlike standard social media analysis reports, which track growth, engagement, and conversions over time, social media crisis reporting is more time-sensitive. It focuses on real-time incident tracking, response documentation, and post-crisis social media analysis.
When done right, it helps brands take control during chaotic moments and learn from past incidents.
How to document and report social media incidents
You should have a clear timeline of what happened: the initial trigger, user reactions, internal discussions, and brand responses. Include specific details about brand mentions, sentiment shifts, drop in follower count, and more. Make sure to add screenshots and use time stamps when you pull data from different platforms.
Your crisis report should ideally include the following:
- A timeline of key events
- Screenshots of key posts, comments, or coverage
- Data on engagement, sentiment, and platform impact
- A review of the brand’s public response and its reception
- Coordination steps taken across departments (PR, legal, social media, executives)
The goal is to document your team’s response efforts thoroughly to improve transparency and refine your crisis approach for future incidents.
Final words
Effective social media reporting is far more than simply collecting metrics—it’s about transforming raw data into strategic insights that drive real business value. The key to successful social media management lies in meticulous performance tracking, contextual analysis, and the ability to connect social media activities directly to business outcomes.
By implementing structured reporting processes, avoiding common pitfalls like overemphasizing vanity metrics, and leveraging automation tools, businesses can move beyond superficial engagement numbers to demonstrate tangible ROI and make data-driven decisions that fuel growth and competitive advantage.
FAQs about social media reports
1. What is in a social media report?
A social media report includes key performance metrics and insights that show how your social media channels are performing over a specific period. It typically covers engagement, reach, impressions, follower growth, and conversion metrics. Good reports include qualitative social media insights, campaign breakdowns, audience behavior trends, and actionable recommendations.
2. What is the 50/30/20 rule for social media?
The 50/30/20 rule is a content strategy where: 50% of your posts should be valuable content that educates your audience, 30% should be content you share from other sources (curated), and 20% can be promotional or sales-focused. This mix helps build trust, keep engagement high, and avoid overly salesy feeds.
3. How to make a social media report?
To create a social media report, start by defining the reporting period and objectives. Gather data from native analytics tools or cross-platform analytics tools like Socialinsider. Organize the data by platform and metric, analyze trends, and provide context for the results. Summarize key wins, challenges, and recommendations, and present the insights clearly.
Ritika Tiwari
Ritika Tiwari is a content writer and strategist with over 10 years of experience creating content for SaaS B2B brands. Outside of work, you’ll likely find her somewhere near the ocean.

Analyze your competitors in seconds
Track & analyze your competitors and get top social media metrics and more!
You might also like


Improve your social media strategy with Socialinsider!
Use in-depth data to measure your social accounts’ performance, analyze competitors, and gain insights to improve your strategy.