LinkedIn Engagement Rate: How To Calculate It, Benchmarks, and Tips To Improve It
See the 2026 LinkedIn engagement rate benchmark (5.20% avg), calculate yours instantly, and get data-backed ways to improve it.

If you're managing a LinkedIn page, you've probably typed "what's a good LinkedIn engagement rate" into Google more than once. I know I have, before I had the Socialinsider data sitting in front of me every day.
That's why, in this guide, I want to go beyond the simple LinkedIn engagement definition, actually give you a fast way to calculate your own number, benchmarks to put your own data into context, and a short list of the handful of things I've actually seen move it in time. Are you ready?
Key takeaways
- A good LinkedIn engagement rate in 2026 is above 5.20%, the current platform average based on Socialinsider's analysis of 1.3M LinkedIn business posts, with rates above 7% considered great performance.
- The most effective ways to increase LinkedIn engagement rate are shifting content mix toward native documents and multi-image posts, using video in the 120-180 second range, and reviewing performance data on a consistent cadence to guide content decisions.
- A LinkedIn engagement growth plan follows a baseline-test-report cycle: record current performance metrics, test one variable at a time, then document results before deciding whether to repeat, adapt, or drop that tactic.
How should you calculate your LinkedIn engagement rate?
LinkedIn engagement rate measures how actively people interact with your content compared with a defined audience or exposure base. The most important decision is choosing the denominator, because a rate calculated by impressions answers a different question from a rate calculated by followers.
LinkedIn engagement represents how your audience interacts with your content through various actions, including likes, comments, shares, and clicks.
Think of it as a conversation. When people engage with your content, they’re essentially saying, “This resonates with me,” or, “I want to learn more.” These interactions aren’t just numbers; they offer insight into what’s working for your LinkedIn presence.
Your engagement rate on LinkedIn is typically calculated using this formula:
[(Likes + Comments + Shares + Clicks) / Posts] / Impressions x 100
PS: Personally, I'd skip the manual math altogether and run your numbers through Socialinsider's free LinkedIn engagement rate calculator.

What's a good LinkedIn engagement rate in 2026?
Based on Socialinsider's analysis of 1.3M LinkedIn business posts, the average LinkedIn engagement rate in 2026 sits at 5.20%, an 8% increase year over year.
Here's how I'd read your own number against that:
- Below 2%: needs improvement
- 2% – 5.2%: average performance
- 5.2% – 7%: above average
- 7%+: great performance
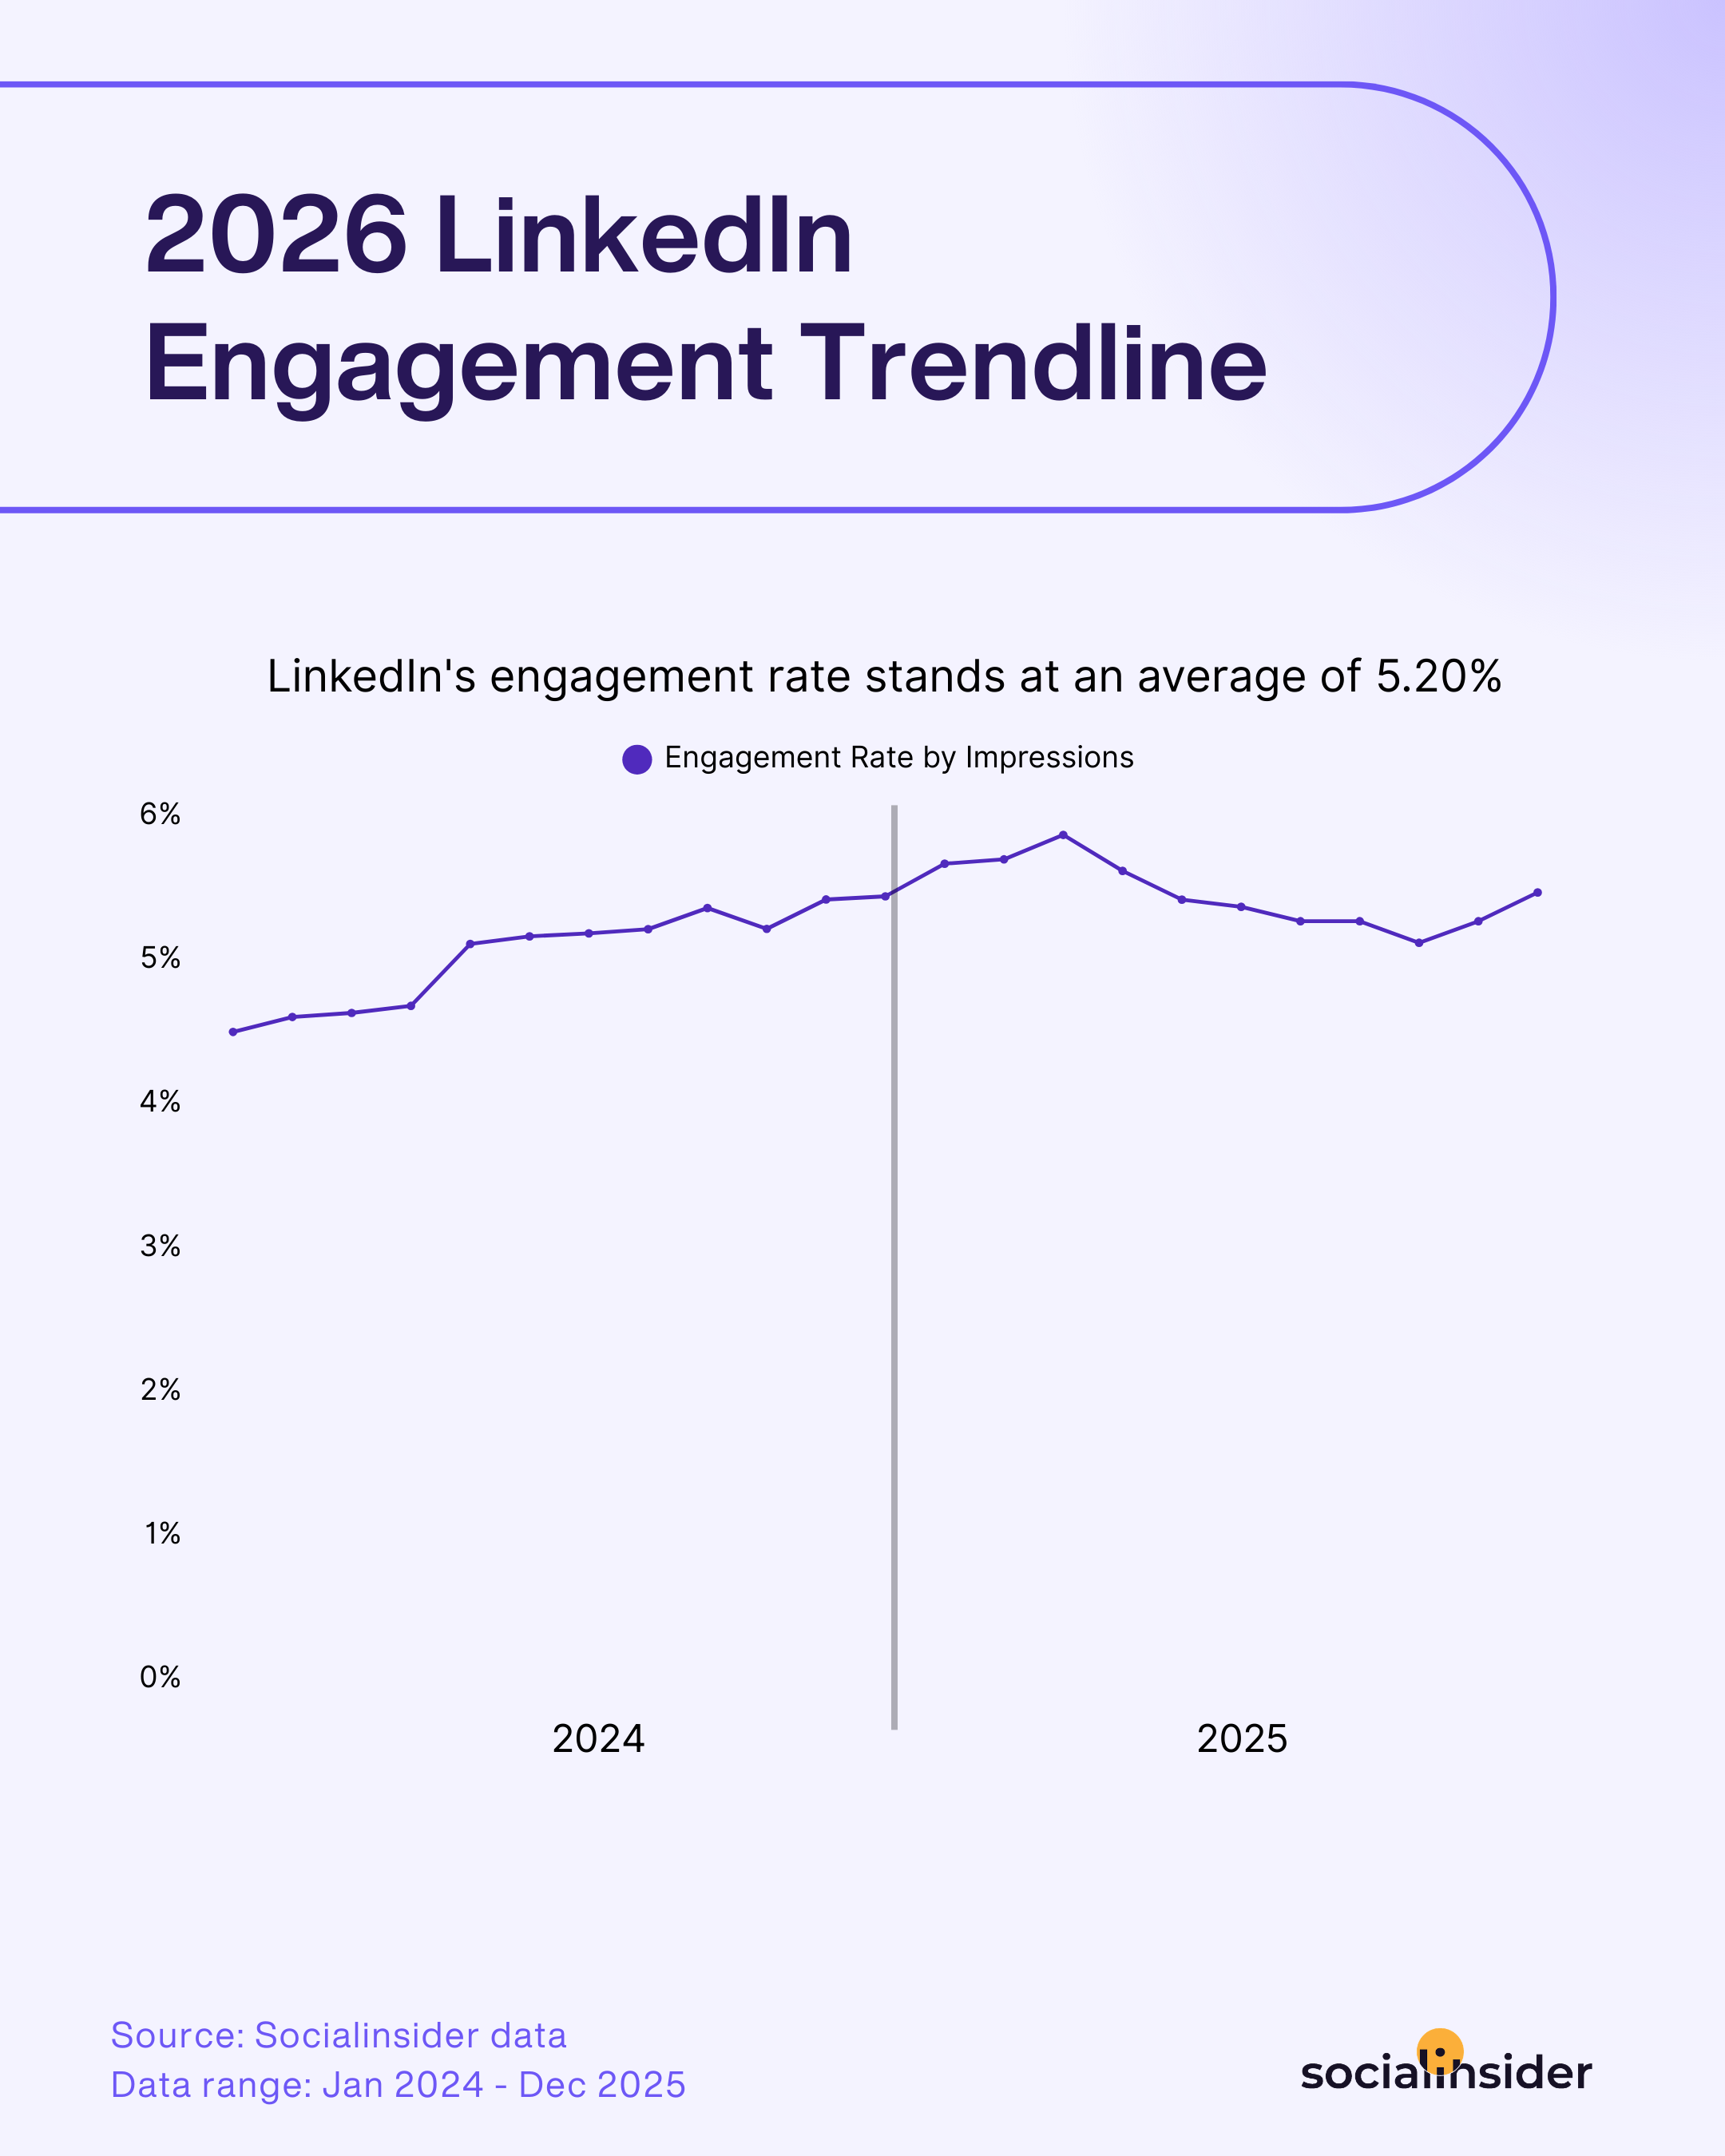
One caveat I'd want if I were reading this: that 5.20% is a page-wide average, and it shifts depending on your content mix and your page size.
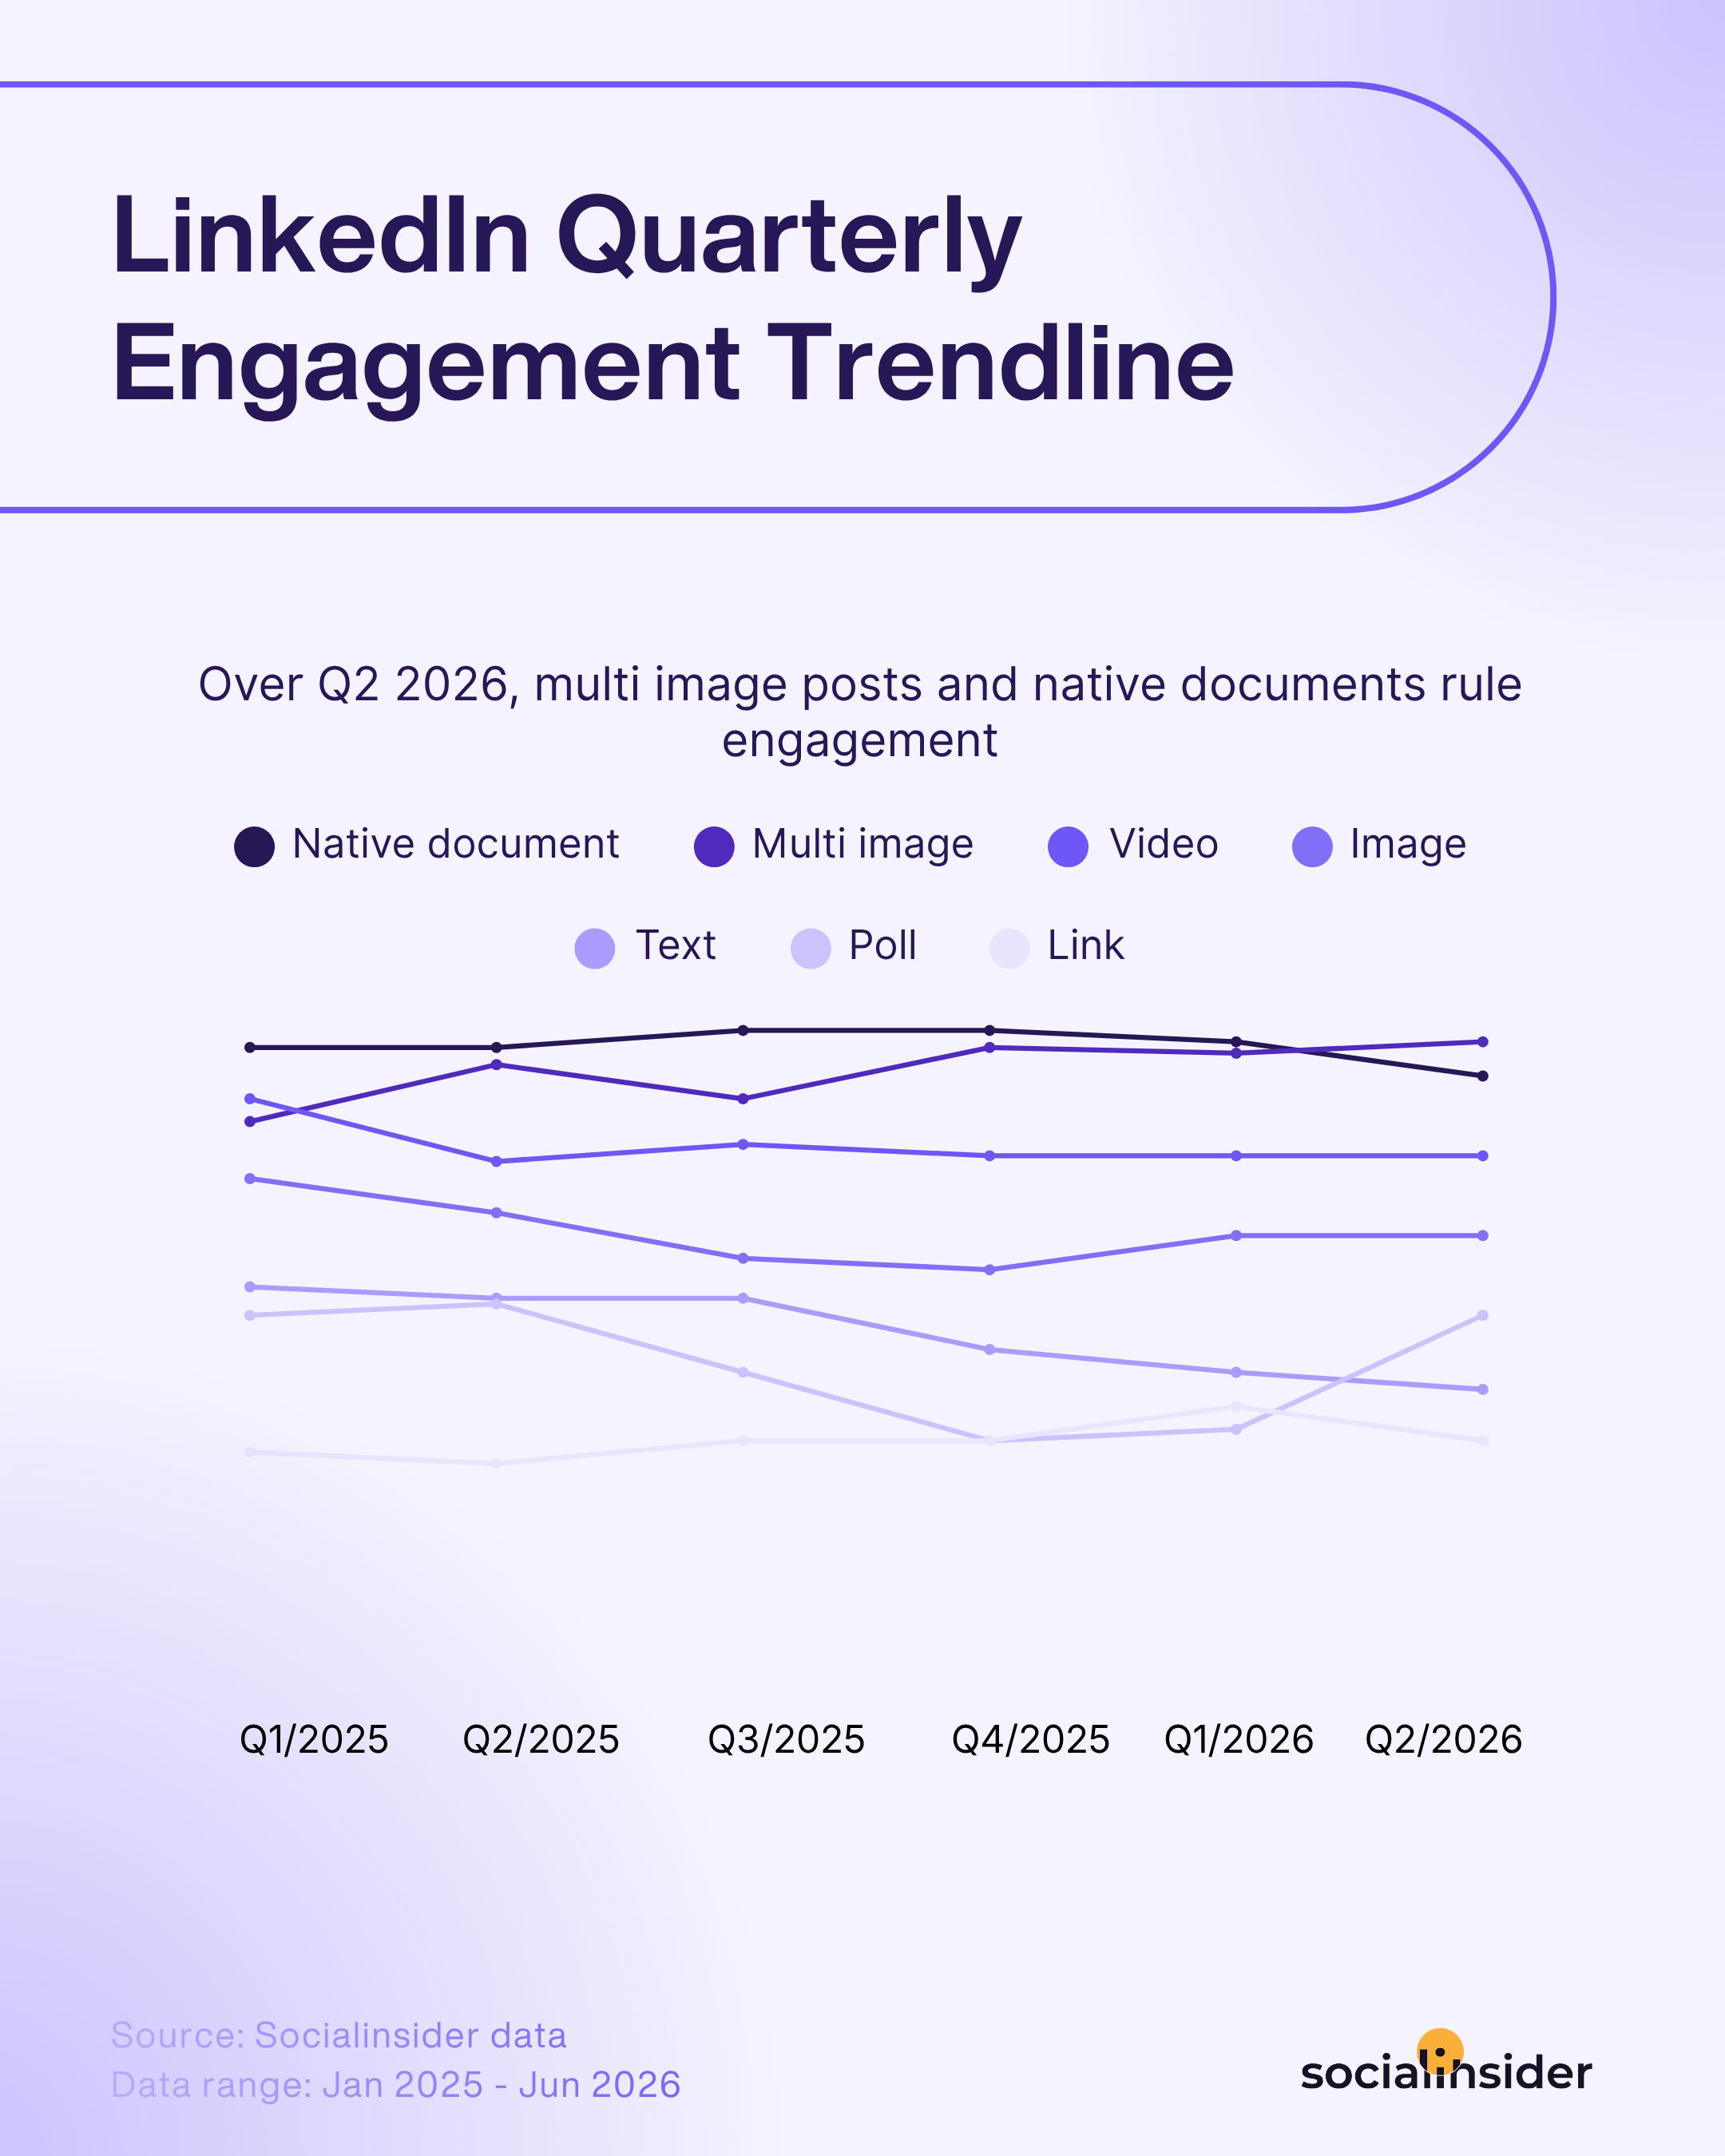
If you want the full breakdown by format, or quarter, that's exactly what our LinkedIn Benchmarks Report is for. I'm not going to reproduce that whole dataset here; this is your quick answer, that's your deep dive.
Ways to increase your LinkedIn engagement rate
Once you know where you stand, here's what I've actually seen move the number, based on what's performing across the pages we track.
Integrate more native documents, multi-image posts, and videos into your strategy
Our benchmark data consistently shows native documents leading every other format, averaging a 7.00% engagement rate this year, with multi-image posts close behind, and videos occupying the third place. If your content calendar is still weighted toward single images and text, that's the first lever I'd pull. Turn your best-performing blog posts or reports into a native document carousel or informative videos, and repurpose data-heavy content into swipeable multi-image posts instead of single graphics.
Leverage videos between 2-3 minutes
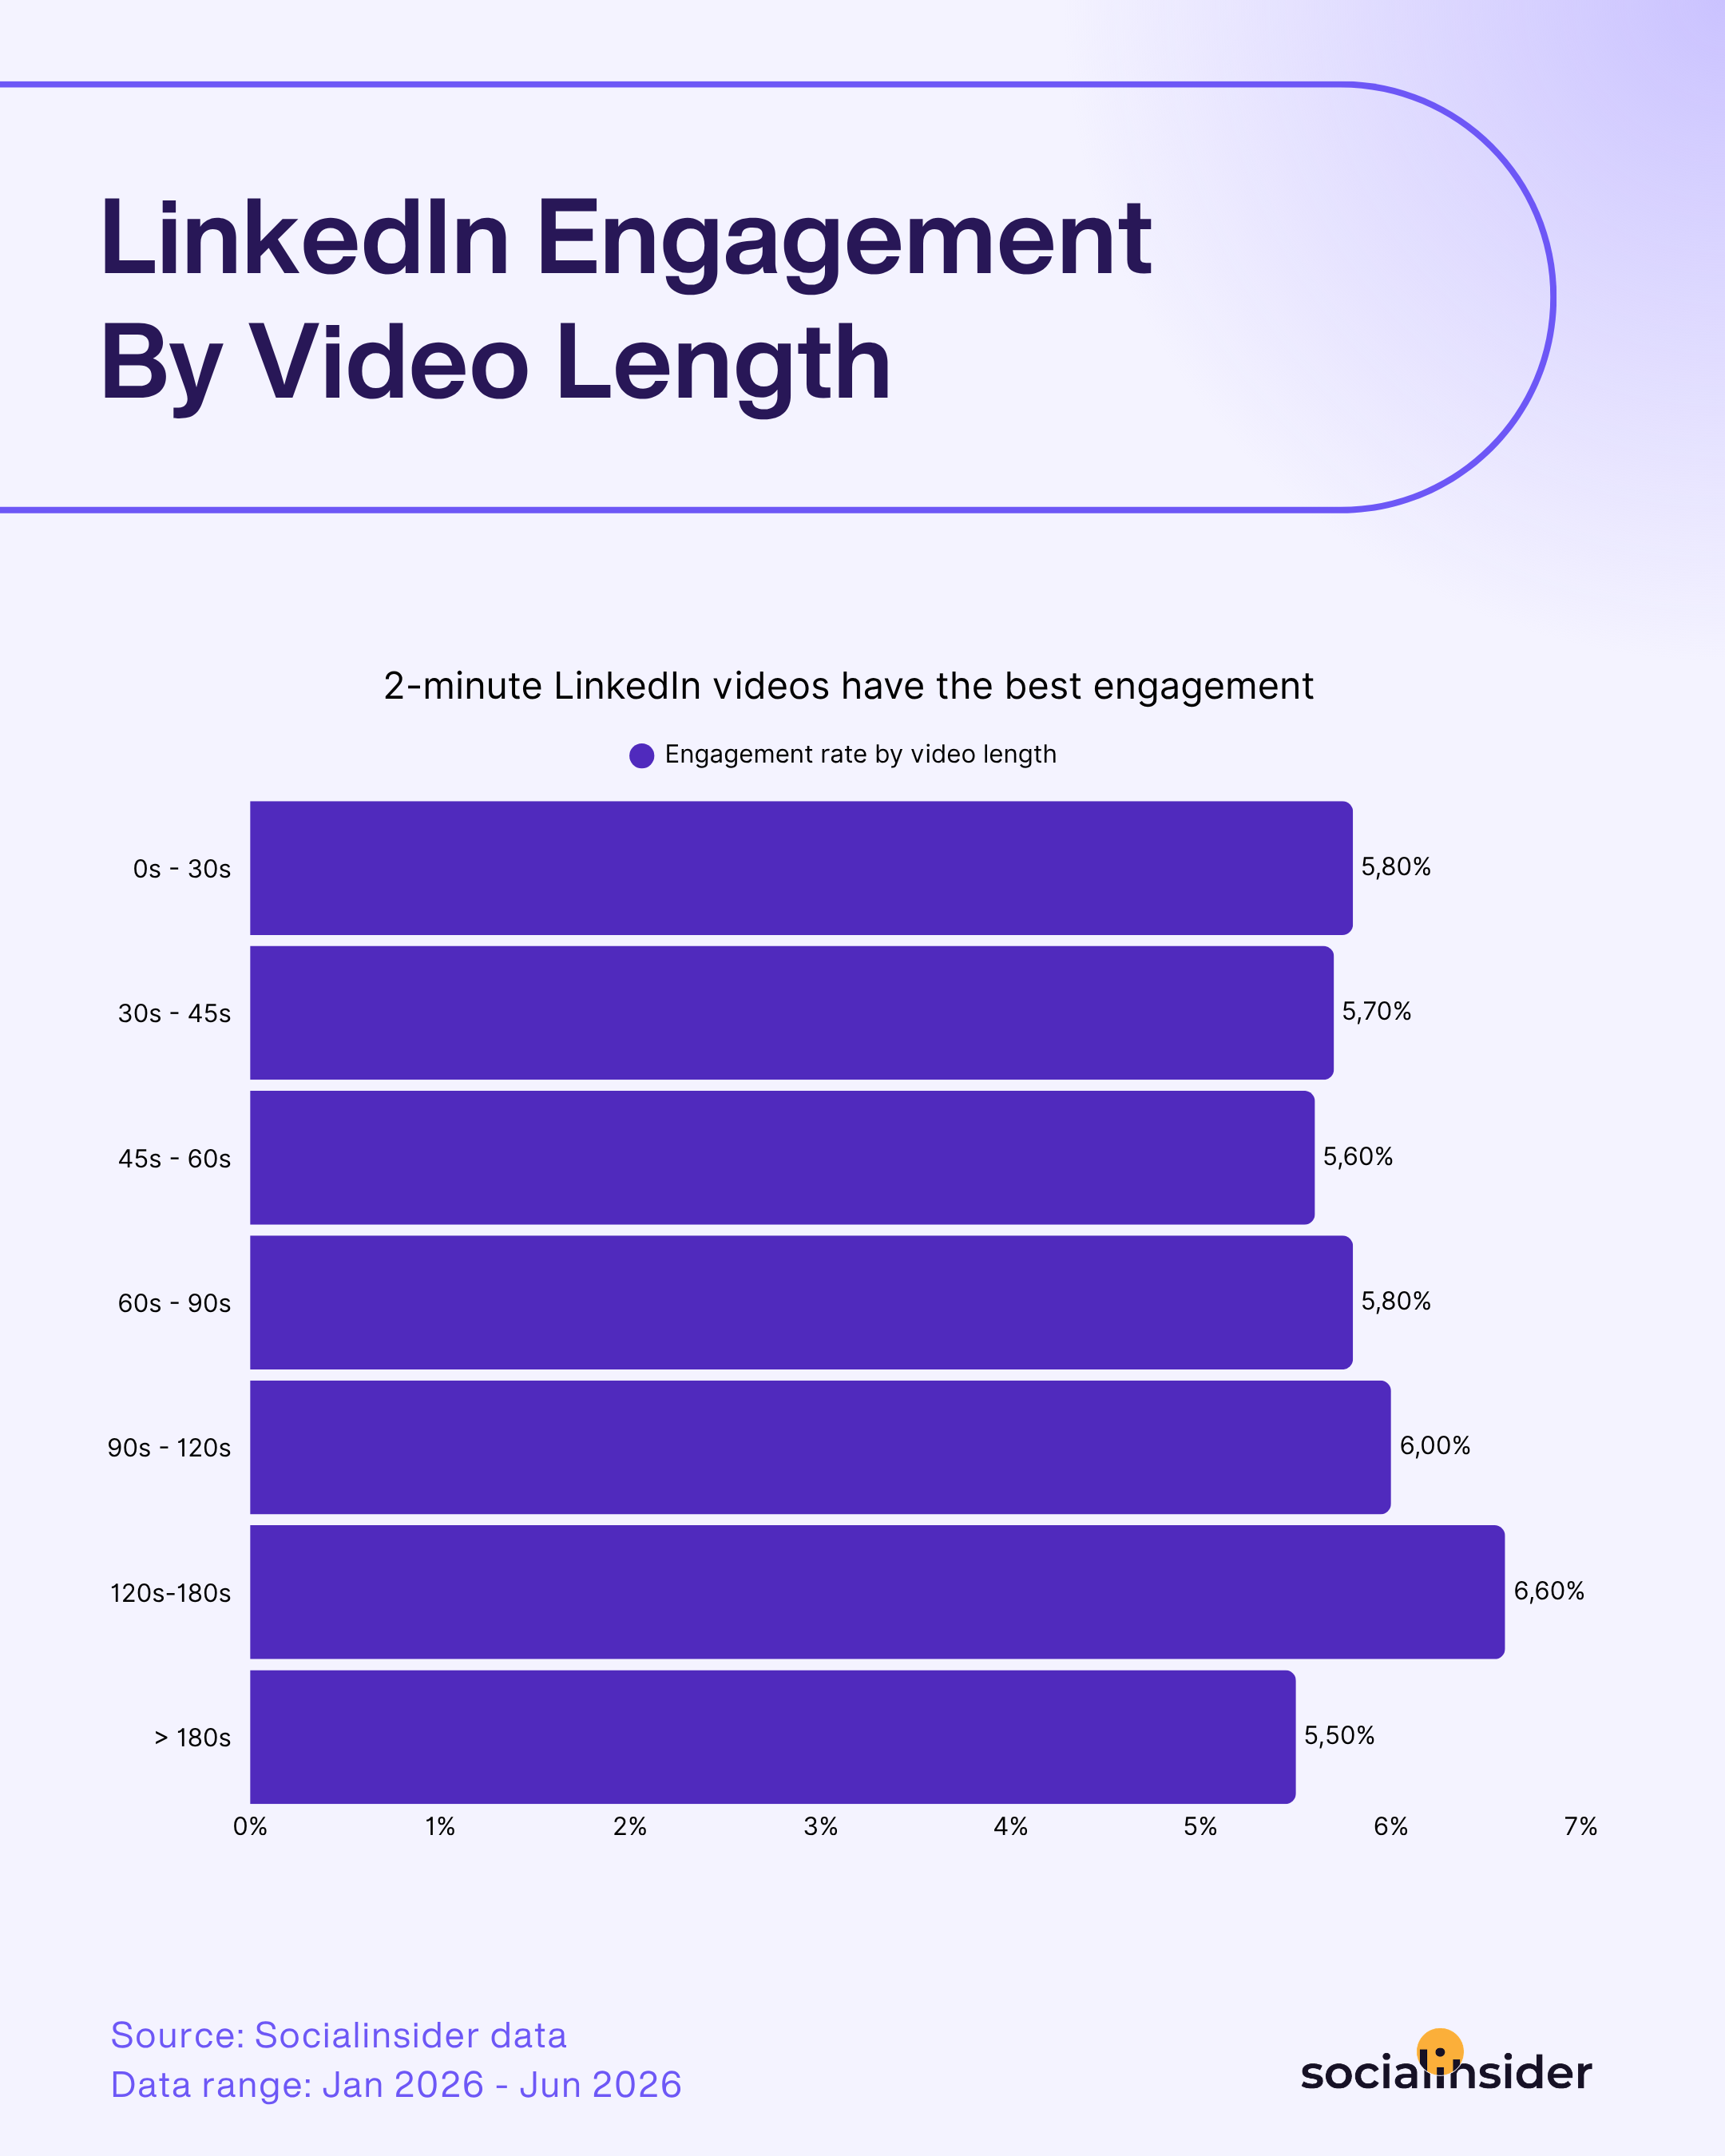
Our Socialinsider video benchmarks study, based on 111K videos across Facebook, Instagram, TikTok, and LinkedIn, found that LinkedIn video engagement peaks in the 120-180 second range, at a 6.60% average engagement rate, well above the 5.60-5.80% range shorter videos see. Views follow the same curve, nearly doubling once a video hits that same 120-180 second window, before both metrics ease back past the three-minute mark.
That makes 2-3 minutes LinkedIn's sweet spot specifically, long enough to develop a real point, short enough that you're not asking too much of an audience mostly skimming between meetings. If you're producing video for other platforms and reposting the same cut natively on LinkedIn, this is worth testing against: a shorter clip won't get punished here, but it's also leaving engagement on the table if you had more to say.
Play by LinkedIn's algorithm's rules
Nobody outside LinkedIn knows the full mechanics, but I've tested enough to know what consistently helps: strong opening hooks, clear headlines on any visual, and early engagement in the first two to three hours after posting. That early window matters more than almost anything else, comments from relevant people and shares with added commentary signal to LinkedIn that a post is worth distributing further.
If you're not already building a plan around that first-hour window, that's a more useful place to spend effort than fine-tuning hashtags.
Use memes strategically (if on-brand)
LinkedIn is still primarily a professional platform, but a well-placed meme can cut through the monotony and humanize a brand in a way a polished post rarely does. It works best when the humor is doing double duty, carrying real substance rather than being the whole point.
Here's an example from Socialinsider's very own LinkedIn page:

The line I'd hold here: keep it clean and workplace-appropriate, use a format familiar enough that the joke doesn't need explaining, and make sure the meme is working alongside real substance rather than replacing it. Before posting, I'd ask whether your CEO or CMO would be fine with it, whether it fits your brand values, and whether the post still delivers value even if someone skips the joke entirely. If the answer to all three is yes, it's probably safe to post.
Make data-based optimization decisions
When talking about improving LinkedIn engagement, I'd rather look at what's actually working for my specific page than follow generic best practices. My suggestion for you is to dive deeper then the raw engagement numbers, and look at engagement segmented by format and even content pillars.

Track engagement rate by format, and by topic, and let the pattern tell you where to invest, not the other way around. A tool like Socialinsider makes this less manual, since you can pull format-level and content pillars performance data across platforms altogether without stitching together your own spreadsheet every month, but the underlying habit matters more than the tool: review the data on a set cadence and actually change your content calendar based on it.
How to create a LinkedIn engagement growth plan?
The fastest way to make these mentioned strategies actionable is to run them through a baseline, testing, and reporting cycle.
A chronological plan gives your team a manageable operating rhythm. Instead of changing content formats, themes, and posting times simultaneously, you create a clear record of what changed and what happened afterward.
Start with a baseline and choose one test
Begin by recording enough context to understand your current LinkedIn engagement rate and identify one meaningful variable to test.
- Record the current engagement rate, impressions, comments, shares, post volume, follower growth, format, topic, and publishing window.
- Confirm the denominator, page type, post scope, and reporting period.
- Select one variable to test, such as the opening hook, format, topic, call to action, or publishing window.
- Keep the rest of the publishing routine stable enough to interpret the result.
- Review both quantitative performance and the quality of comments.
Turn results into the next content cycle
Reporting isn’t the end of the process. It’s the point where your team decides what to do next.
Identify repeatable patterns, document what changed, and decide whether to continue, adapt, or stop the test. Then carry that decision into the next content cycle.
For example, if multi-image posts generate more meaningful comments but require more production time, your decision may be to use them for high-priority educational topics rather than every post. If a timing test produces more impressions but no improvement in relevant conversations, your team may stop prioritizing that time slot.
Socialinsider’s LinkedIn analytics capabilities help teams review post-level performance, engagement metrics, follower growth, historical trends, benchmarks, and reporting. This supports a repeatable workflow: baseline, test, review, document, and adjust.
The key decision is not “Which tactic is best?” It’s “Which tactic is worth repeating for this audience, goal, and available resources?”
Final thoughts
Improving your LinkedIn engagement rate isn't about chasing every tactic at once. Start with the one or two that fit where your content already sits, whether that's shifting more of your calendar toward native documents, testing a longer video cut, or finally building a habit of checking your data on a set schedule instead of when something feels off.
Know your number, know what's realistic for your page size and format mix, and let the data tell you what to try next. That's the whole approach, everything else in this piece is just detail in service of that.
How often should I check my LinkedIn engagement rate?
I'd check it monthly at minimum, and after any notable change to your content strategy or posting frequency. Checking too infrequently means you miss the point where a format shift or algorithm change started affecting your numbers, checking daily usually just adds noise since individual post performance varies more than the underlying trend.

Elena Cucu
As Content & SEO Manager at Socialinsider, Elena Cucu helps social media leaders make sense of the numbers behind their performance. Featured in TechCrunch, TNW, and ReadWrite.

Know what your competitors do — before your manager asks
Get instant social benchmarks & reports without manual work.