Five Best Practices for Executive Reporting in Social Media
Understand how to level up your executive reporting process to gain more confidence when presenting social media report to stakeholders.


Executive reporting in social media focuses on business impact, which changes both the metrics you choose and how you interpret them.
Operational social media reports track activity and performance in detail. Executive reports are made to give the C-level enough context for decision-making, analyzing growth, revenue influence, and strategic direction.
In this article, I’ll break down the main metrics required for solid executive reporting, best practices to build an executive summary, and the common mistakes to avoid.
Key takeawways
-
Executive-level vs operational social media performance reporting: what are the main differences? Operational reports focus on platform metrics to optimize content, while executive reports translate those metrics into business impact, trends, and strategic value.
-
Best practices for executive reporting: Effective executive reporting requires tailoring insights to the audience, adding benchmarks and competitive context, focusing on trends, and providing actionable recommendations tied to business goals.
-
Common executive reporting mistakes to avoid: Executive reports fail when they focus on activity over outcomes, lack connection to business objectives, or present inconsistent and hard-to-compare data.
Executive-level vs operational social media performance reporting: what are the main differences?
When a social media team prepares an operational social media performance report, the focus is on core metrics: impressions, reach, engagement rate, click-through rate, or how many people saved a post compared to the previous period. These numbers help us understand content performance and decide what to improve next.
But executives don’t think in impressions or reach. They think in revenue, long-term goals, and business impact. So when we present clean, detailed social media data that tells us a full story, it often gives them very little in terms of answers.
The key difference between executive reporting and operational is translating social media data into terms executives understand and care about. That means:
- An executive report is more of a bird's-eye view than a hands-on report
- The metric set shifts from solely performance metrics to business metrics, supported by performance
- The time frame is broader, focusing on trends rather than short-term snapshots
Executives don’t care that engagement rate went up — but they care whether more people are getting more invested in the brand.
What to include in an executive social media report?
For a lot of executives, standard social media metrics are not something familiar simply because they don’t work with reach or engagement rate by follower every single day.
The nature of the executive report is different because the final consumer is not your social media lead or a fellow social media colleague.
Let’s go over the content you should definitely include in your file when reporting to stakeholders.
What to include: metrics executives care about
Revenue impact and pipeline influence
The hardest metric that every CMO likes to see is social media ROI. It’s relatively tough to prove the exact revenue coming from social media, and yet this is what executives care about most.
And although it’s far from a perfect attribution model, there are multiple ways to show the impact of social media. Sometimes, it’s not about the final sale, but about how social supports the customer journey.
My tip is: if you can’t attribute a direct conversion, look for indirect signals that surround it. Mentions, touchpoints, and interactions show that social media plays a role in moving people closer to purchase, and your social media analytics can support it.
So here are a couple of things you can do to track how much social media influences revenue and customer journey:
- Use UTM links. Social media isn’t always link-friendly, but you can still place UTM-tagged links in bios, posts, or campaigns. This helps your CRM track whether users came from a specific platform or post, and attribute part of the revenue to social.
- Coordinate with other departments. Work with sales, customer success, and web teams to understand where leads come from. Add a “where did you hear about us” question in onboarding, ask sales to collect qualitative feedback, and check traffic sources with your web team.
- Track assisted conversions. In tools like Google Analytics, look at multi-touch attribution or assisted conversions. Social might not be the last click, but it often plays a role earlier in the journey.
- Monitor branded search and direct traffic trends. Spikes in branded search or direct visits after social campaigns can signal increased awareness and intent driven by social media.
- Use lead quality signals. Compare leads coming from social vs other channels — deal size, conversion rate, or time to close. This shows whether social contributes to more high-quality leads or mostly brings traffic.
Track these trends over time to show how social’s share of traffic, conversions, or assisted conversions changes month over month or quarter over quarter.
But don’t just dump this data into an executive report. Translate it into a format that gives exes a clear picture of the value of social media. For example:
- Show % of total website traffic coming from social media (e.g., “Social drove 18% of total site traffic this quarter”)
- Break down % of conversions or sign-ups from social vs other channels (e.g., “15% of leads that converted came from LinkedIn webinar”)
- Include assisted conversions as a share of total conversions (e.g. “Based on onboarding questionnaire, social assisted in 27% of all conversions”)
Organic value: the ad spend equivalent of organic performance
If you’ve read the previous section and felt a sudden need to change fields, don’t. Organic Value is my personal favorite feature in Socialinsider because it makes social media evaluation that much easier.
Organic Value is a calculator that estimates how much it would cost you in ad spend to get the same results you’re getting organically.
To calculate this, Socialinsider uses industry benchmarks for engagement, awareness, and growth metrics. This comes in very handy when doing competitor research.
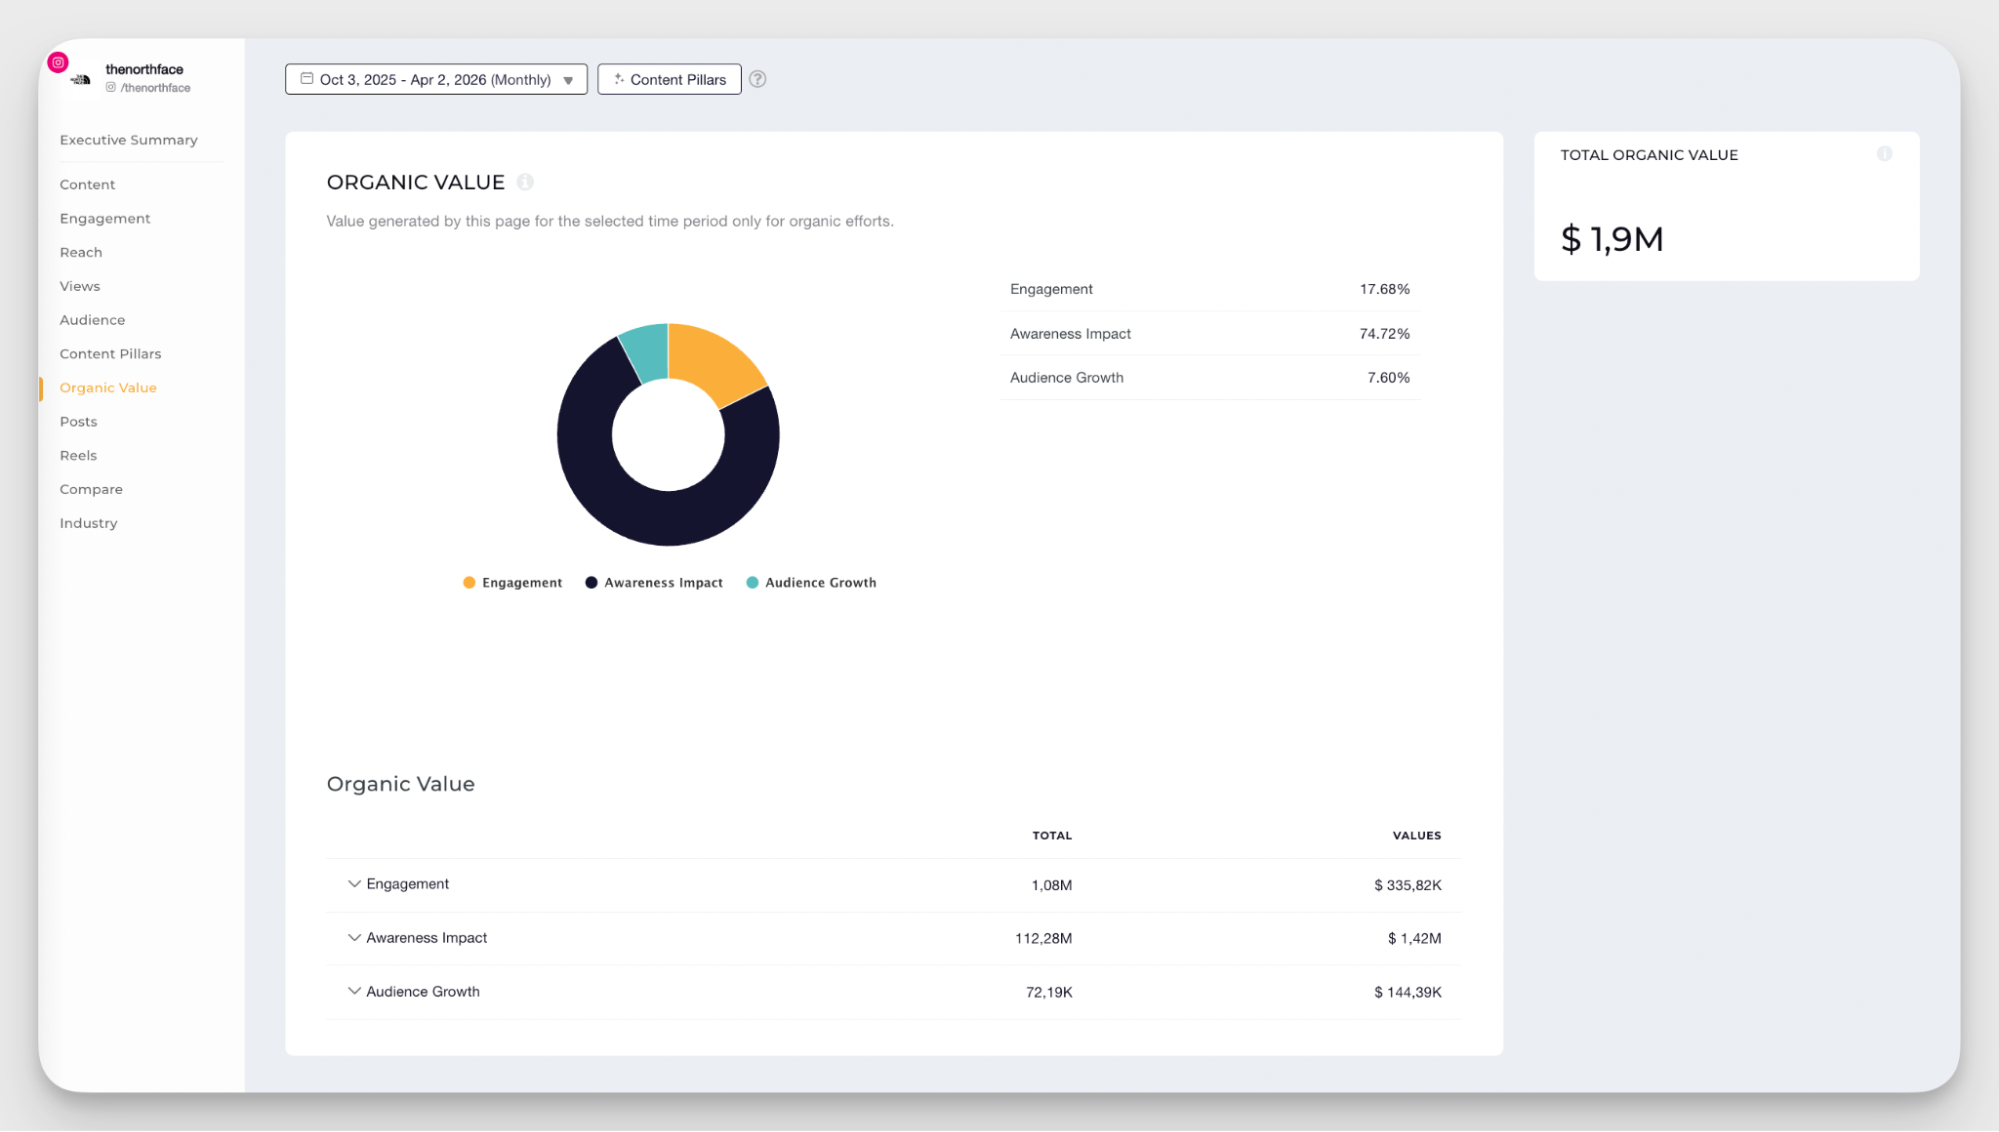
If you want the evaluation of your own brand to be as precise as possible and you have your own data, you can customize the values. You can set your actual cost per like, comment, follow, reach, or view, and get a more accurate estimate.
Including this metric in an executive report puts a price tag on your organic efforts. It makes your work more tangible and shows how much money you’re saving by investing in organic.
Share of voice and competitive positioning
Operational social media reports usually solve the problem of putting data in context by including competitors' metrics and comparing performance side-by-side.
But executives often lack context when looking at performance metrics. Plus, ongoing metrics are a little too nitty-gritty for them.
So instead of getting into a full-scale competitor report and detailed metrics, use share of voice.
Share of voice is usually calculated as:
SOV = Your brand metrics / Total market metrics
Share of voice shows how much visibility your brand has compared to competitors. This metric is usually based on mentions, engagement, or overall activity in your space. For executives, it explains how visible your brand is and how much authority it carries in the market.
This metric gives your executive report clarity on your market stance without overloading stakeholders with competitor data.
Include it alongside the main competitor benchmarks on core metrics like follower growth and engagement to give a comprehensive overview.
Audience growth as a business signal
Many social media managers see follower growth as a borderline vanity metric. But that’s not how your stakeholders see it.
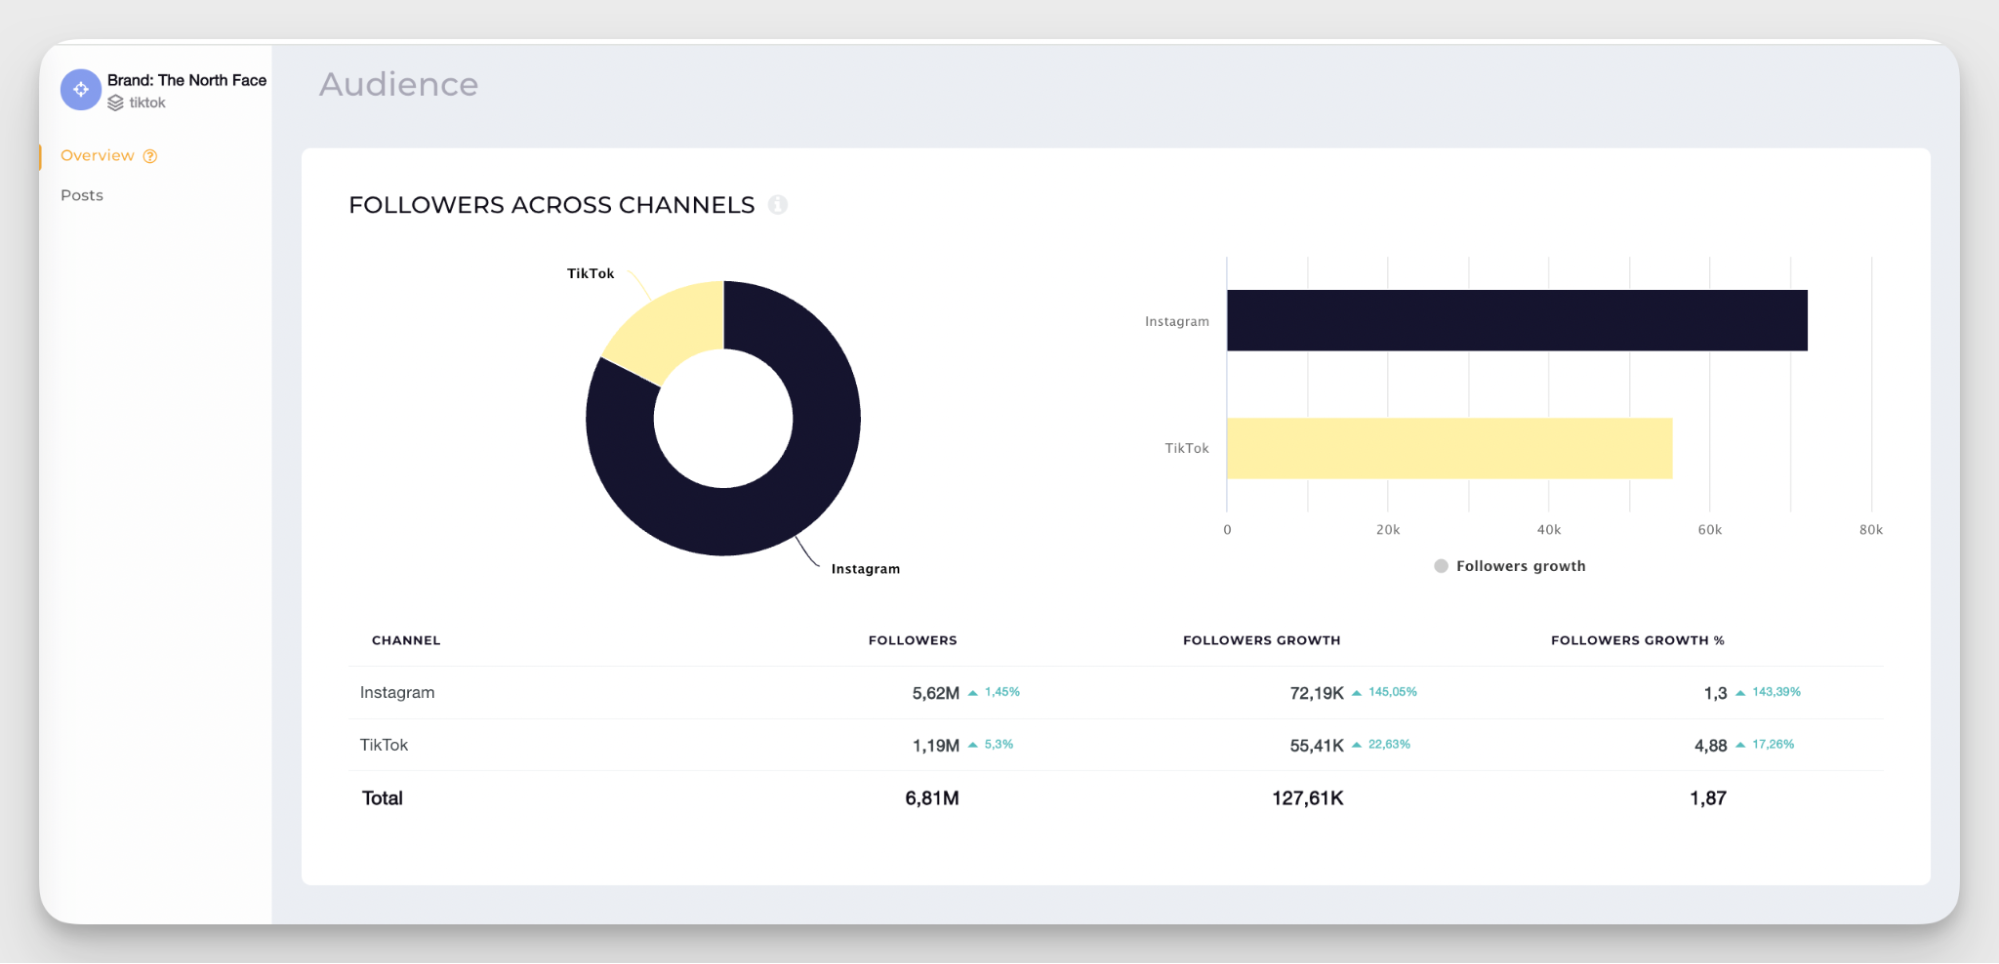
A steady increase in followers is a layered signal that shows:
- Your content keeps reaching new people
- Your brand and content are appealing enough for people to convert into followers
- Your immediate base of potential customers is growing
For social media specialists, stagnation in follower growth usually means the content isn’t breaking out of its bubble. For executives, it can signal something bigger, like that the brand’s appeal or the offer itself might be losing momentum, and it’s time to look into why.
Tip: On its own, the number of new followers gained is not representative for someone who doesn’t look at these numbers every day. When I prepare executive reports, I always include the percentage growth compared to the previous period, along with a benchmark showing how similar accounts in our niche are growing.
What to leave out: metrics that executives don’t need
Not everything you track as a team needs to make it into an executive report.
To be fair, some executives might still want to dig into raw data. But most don’t have the time, and care more about clear, ready-to-use insights they can build decisions on.
My rule of thumb is: if a metric can’t be put into a business development context or doesn’t require action from leadership, don’t add it to the executive report.
That doesn’t mean you should ignore operational metrics completely. You can still use them to support a point — for example, to highlight the success of a specific campaign or post. Just don’t build the whole report around them.
Take raw engagement numbers. Engagement rate or likes don’t mean much to an executive on their own. Without context, like trends over time or comparison to competitors, they don’t tell a useful story.
The same goes for platform-native stats. A post hitting 3 million views looks great, and it can be a nice addition. But unless it connects to something bigger, like an increased share of voice or higher conversion rates, it remains just that: a nice add-on.
Best practices for executive reporting
Every company has its own way of doing things, and that will shape the metrics your stakeholders expect to see. Some executives might prefer a more operational view and want to get closer to the raw data.
Still, no matter what metrics you include, a few ground rules will help you present social media performance in a way that certainly lands.
Here are five best practices for creating executive reports for stakeholders.
Understand your social media reporting audience
Executives are not your teammates or immediate team leads, so their reports shouldn’t look like your usual performance overviews.
That said, “executives” are also not a singular type of person. From CEO to CMO, each role looks at social media through a different lens, and the way you present data should reflect that.
So whenever you’re building an executive report, remember: different stakeholders, different cuts of data.
A CMO is usually more marketing-savvy and sees social media as one of several marketing channels. Their report can include a bit more operational detail and metrics that help evaluate how effective social media marketing is compared to email, paid ads, or web.
A CEO, on the other hand, may not be interested in marketing specifics. They tend to see social media as a brand and growth lever, and care more about long-term impact. Their report should focus on business outcomes and how social contributes to revenue, brand position, and overall growth.
The difference also shows up in decision-making. A CMO might use your report to reallocate budget between channels or adjust campaign strategy. A CEO is more likely to use it to decide whether social media deserves more investment at all, or how it supports broader business goals.
Use benchmarks to add credibility
Unlike you or your immediate team lead, executives don’t have the same context of the social media landscape that you do.
For you as a social media leader, knowing that your engagement rate by followers is 5% on TikTok can be enough to draw conclusions, because you know that the industry standard, according to Socialinsider’s social media benchmarks report, is 3.70%.
But your CEO doesn’t know that. That’s why I always recommend presenting the metrics you include in the executive report alongside relevant social media benchmarks.
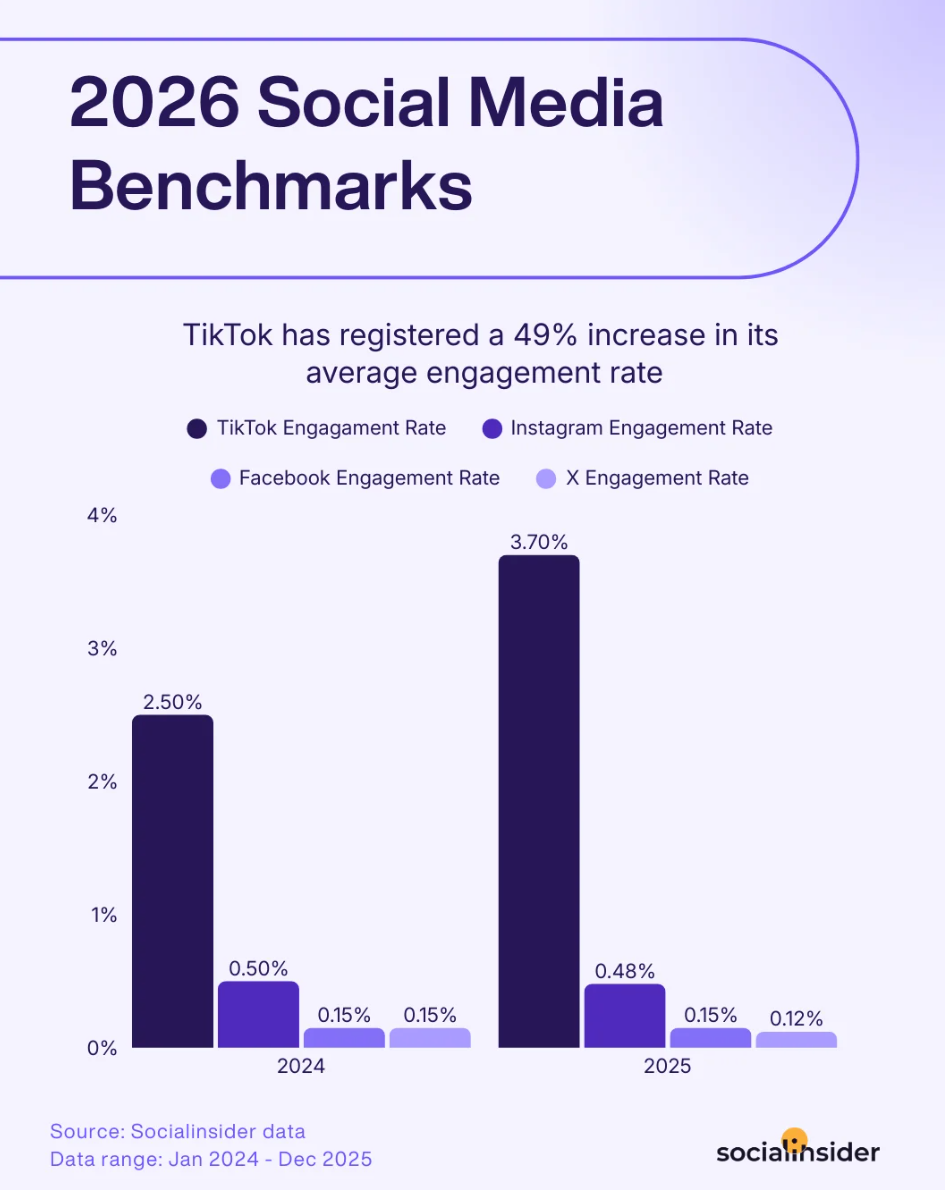
Benchmarks add credibility to your conclusions. A CEO doesn’t have to wonder whether your definition of “good performance” is subjective — the benchmark gives them a relatively clear context for what’s good and what’s not.
Lead with competitive context
Competitive insights are part of the context you need to provide to your executives.
C-level stakeholders approach the market from a bird’s-eye view, and knowing how you perform compared to competitors is often the main reason they ask for a social media report in the first place.
This is where some operational data, like follower growth, reach, and views, becomes useful. Lead with a few core KPIs in the context of your main competitors to immediately show where you stand in the market.
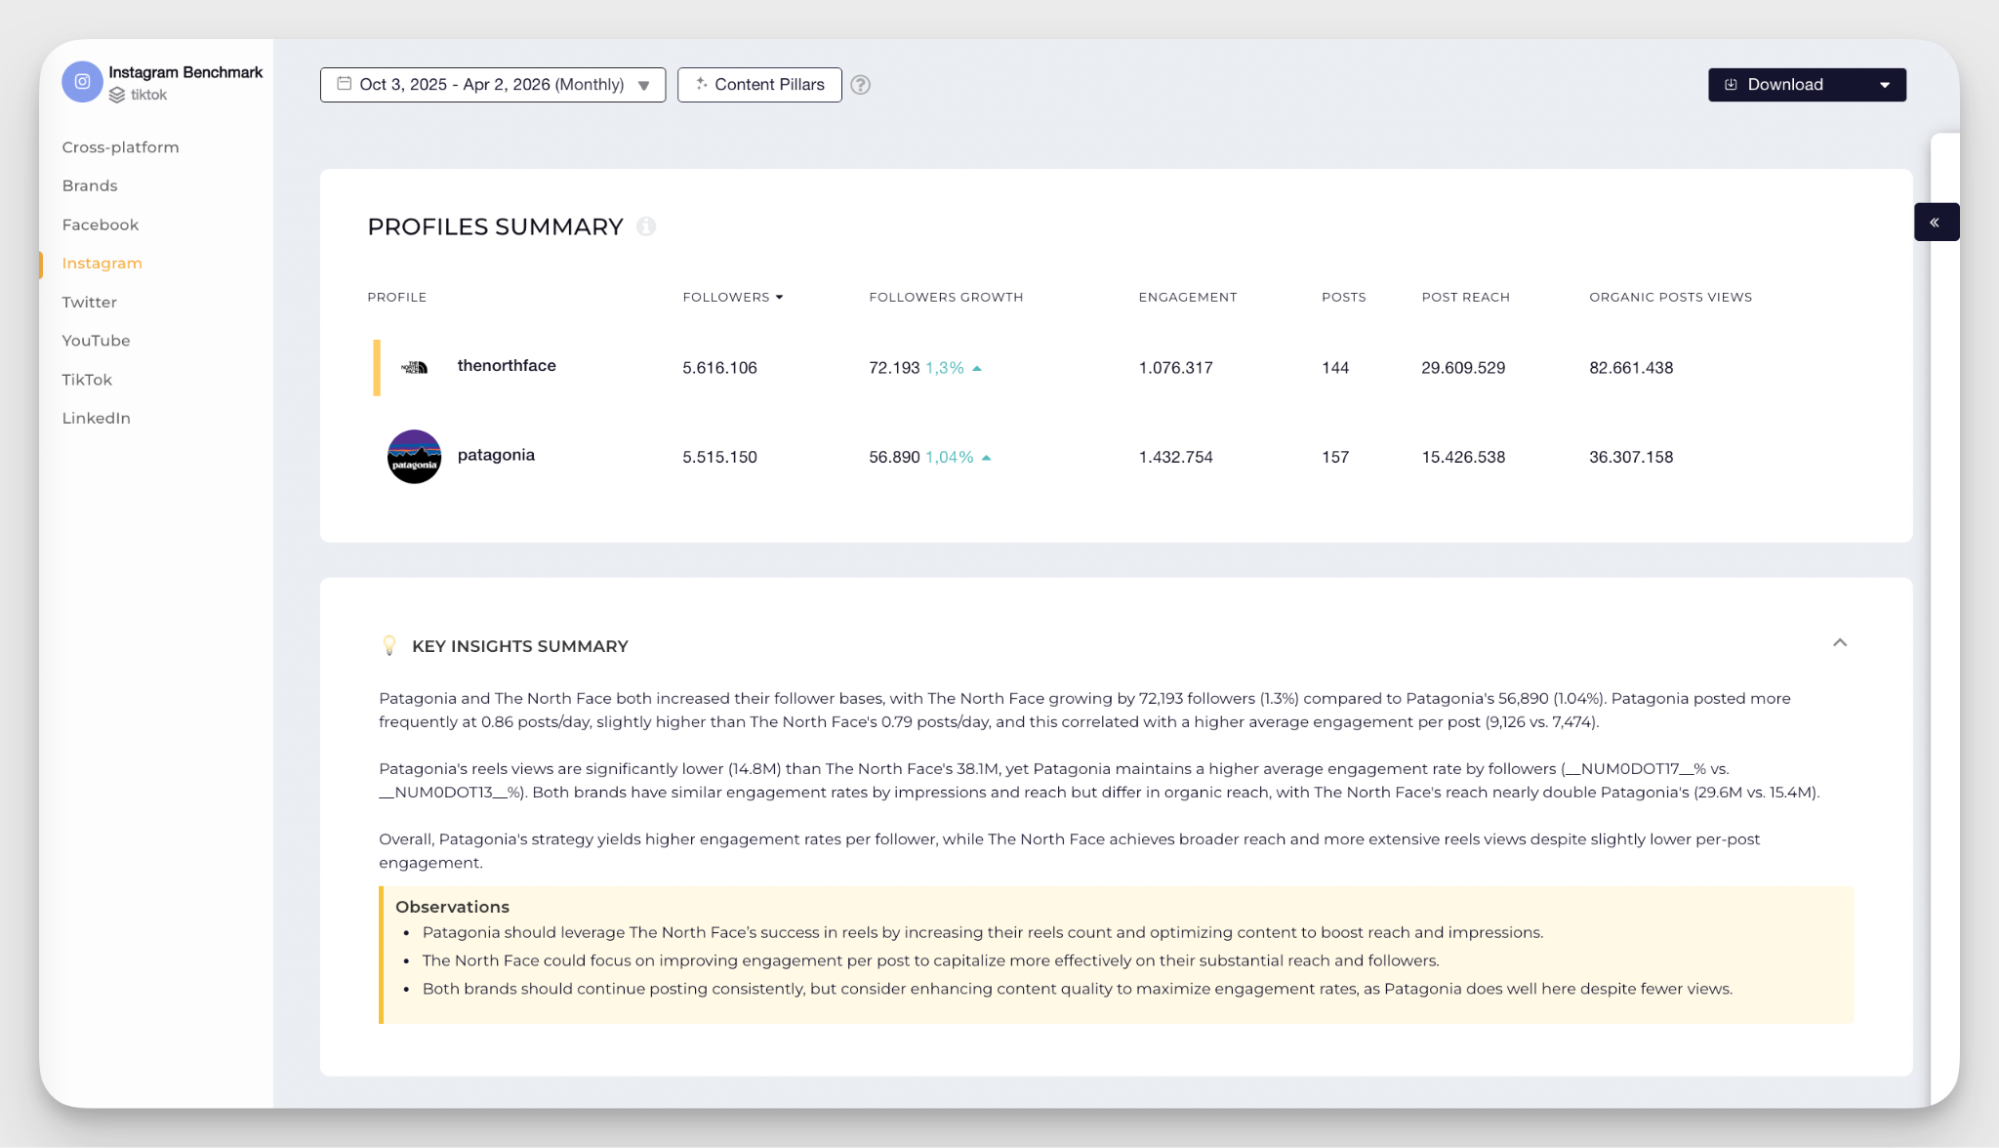
That said, be mindful of how you choose your competitors for the executive report. In operational reports, using aspirational competitors can be helpful. But in executive reporting, that can skew expectations.
Look for comparable accounts with a similar setup to create a more realistic and useful frame of reference.
Offer recommendations
It might feel a bit off to give recommendations to C-level stakeholders. But this is exactly the place to do it.
An executive report shouldn’t stop at observations or an executive summary of what already happened. It should also include what you recommend doing next.
As someone working hands-on with social media, you see patterns and opportunities that aren’t obvious from the outside. You know where performance could improve, what to text next, and whether you’re leaving something off the table and why.
Executives don’t make decisions like whether you should post more often or test a new format. But they do decide on things like budget, resourcing, and strategic direction. Your recommendations help connect your day-to-day insights with those higher-level decisions.
Socialinsider’s AI can really help here. It analyzes your brand data alongside competitors and helps you highlight trends, gaps in your strategy, and analyze what helps your competitors fly higher than you.
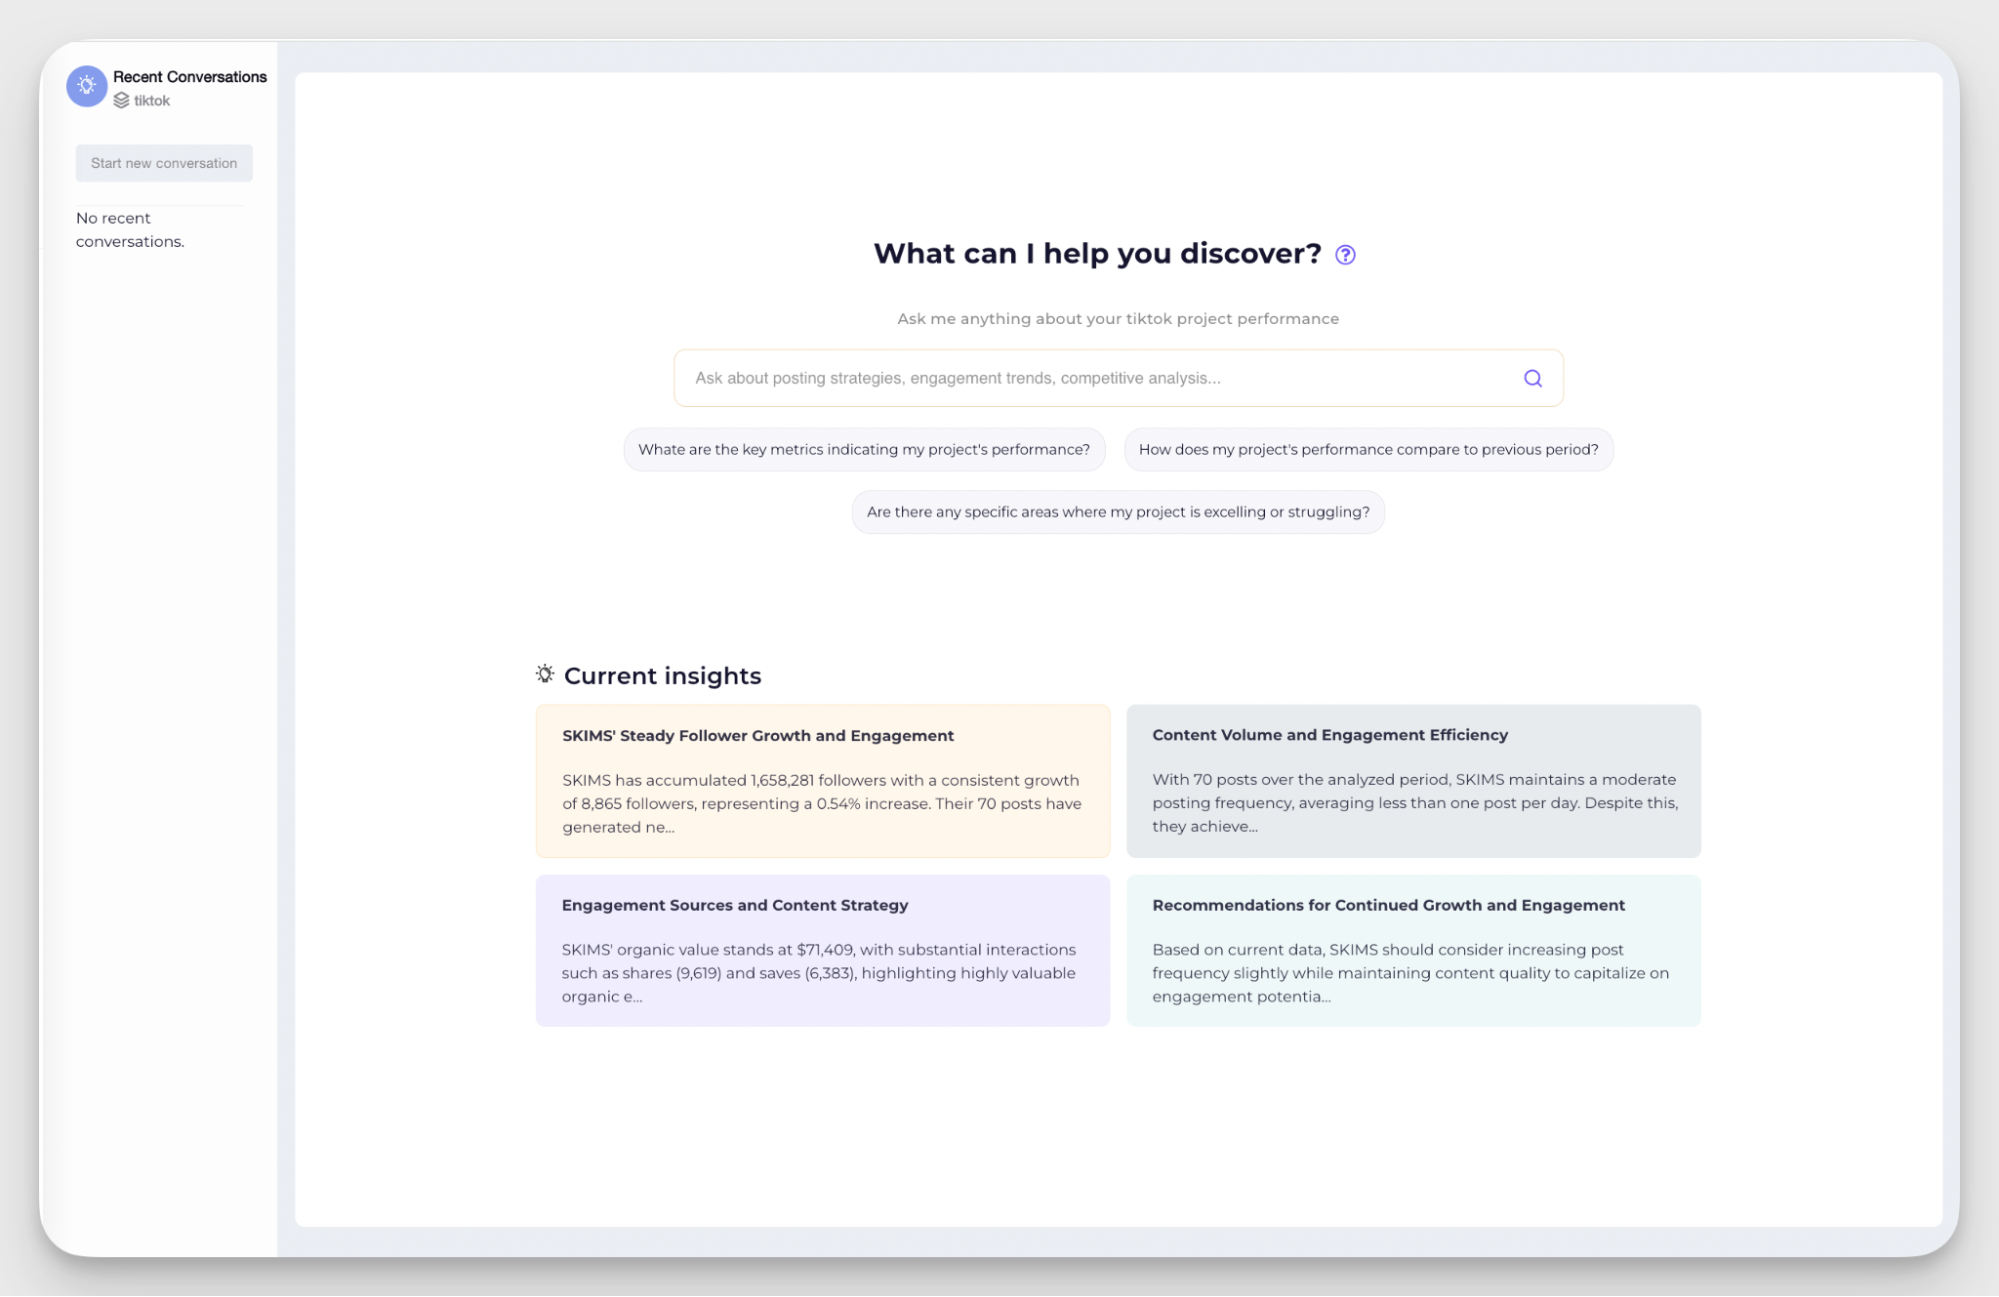
Based on that data, Socialinsider AI can form clear, action-driven recommendations tailored for executive audiences.
Use charts that show trends
Operational reporting often needs a snapshot of a situation on the ground. Executives, however, are more inclined to look for patterns and trends.
The point of an executive report is to help the C-level make strategic decisions, and to do that, they need direction. Trend-based charts help executives quickly understand momentum, spot risks, and identify opportunities.
So instead of just stating that this month you’ve gained 1,000 followers, add a graph that shows how your follower growth has changed over the past three months.
The same logic applies to most other metrics. The dynamic behind the numbers is often more interesting to C-level than a single data point. You also don’t create executive reports every day, so presenting data in larger time frames reflects your work more accurately.
Common executive reporting mistakes to avoid
Reporting on activity instead of outcomes
It’s easy to fall into reporting what was done: how many posts went out, how many campaigns were launched, how active the team has been.
But for executive reporting, activity on its own doesn’t say much. Posting more doesn’t automatically mean better results.
So focus on what that activity led to instead:
- Launched two social media campaigns -> Two campaigns brought +30% traffic to the website
- Posted 50 posts in a month -> Adding a new channel to the mix and increasing posting volume brought the brand 1000 new engaged followers
If a report focuses too much on output, it leaves a gap in why this activity was useful or helpful to the business. Executives are left connecting the dots themselves, and they usually won’t.
Not tying social performance to a business objective
If engagement is up, what does that support? Brand awareness? Lead generation? Customer retention?
Every key metric in your report should connect to a larger goal. Otherwise, it reads like a collection of stats rather than a clear picture of progress.
This also influences the way you collect metrics and approach the analysis. Let’s say you see that the engagement rate is up compared to the previous quarter. Your summary in the operational report may sound like: The engagement rate on our TikTok account grew by 5% compared to Q1.
But for an executive report, you’d need to tie it to a business objective. You would analyze what influenced the engagement rate the most to see if there is a bigger correlation there. That might bring you to a more strategic conclusion:
Engagement rate on TikTok product posts went up compared to Q1, which shows stronger interest in our offering and supports our goal of improving conversion from social traffic.
Gives your executive more signals to work with, right?
Inconsistent reporting cadence
Consistency makes your data easier to read and trust.
Switching between weekly, monthly, and quarterly views without a clear reason makes comparisons messy. Trends become harder to spot, and small changes can look bigger (or smaller) than they actually are.
Pick a reporting cadence and stick to it. If you need to zoom in or out, make that shift explicit.
A steady structure helps executives follow performance over time without second-guessing what they’re looking at.
Final thoughts
When you prepare an executive report, keep in mind the difference in perspective and goals behind it.
Operational reports help you make day-to-day decisions about content strategy and performance. Executive reports are built for people with limited social media context, who look at the bigger picture to guide long-term brand decisions.
Always put your data in context and focus on outcomes instead of ongoing activity.
Socialinsider can support you in analyzing your social media data and adding competitor insights for context. Try it out — the first 14 days are on us.
FAQs on executive reporting
How often should you create executive-level reports?
The cadence of executive reporting depends on your needs, the size of your company, and how invested the C-level is in the ongoing operations.
- Monthly executive reports are good for performance trends and checking on ongoing brand health
- Quarterly reports are best for strategic reviews and budget conversations
- Ad hoc reports can appear as a request from the higher-ups when a campaign exceeds benchmarks, a crisis hits, or a competitor makes a move
Where does the executive summary go in a report?
Best practice is to include a short, executive-oriented TL;DR at the beginning of all your operational reports. Place it before any detailed breakdowns or metrics.
This gives a quick overview of the current situation and helps stakeholders grasp the key takeaways without going through the full report. It also makes it easier for team leads to share updates upward on an ongoing basis.
Kseniia Volodina
Content marketer with a background in journalism; digital nomad, and tech geek. In love with blogs, storytelling, strategies, and old-school Instagram. If it can be written, I probably wrote it.
Know what your competitors do — before your manager asks
Get instant social benchmarks & reports without manual work.
You might also like


Improve your social media strategy with Socialinsider!
Use in-depth data to measure your social accounts’ performance, analyze competitors, and gain insights to improve your strategy.